

Genome-wide identification and characterization of the KCS gene family in sorghum (Sorghum bicolor (L.) Moench)
- PMID: 36225907
- PMCID: PMC9549899
- DOI: 10.7717/peerj.14156
Genome-wide identification and characterization of the KCS gene family in sorghum (Sorghum bicolor (L.) Moench)
Abstract
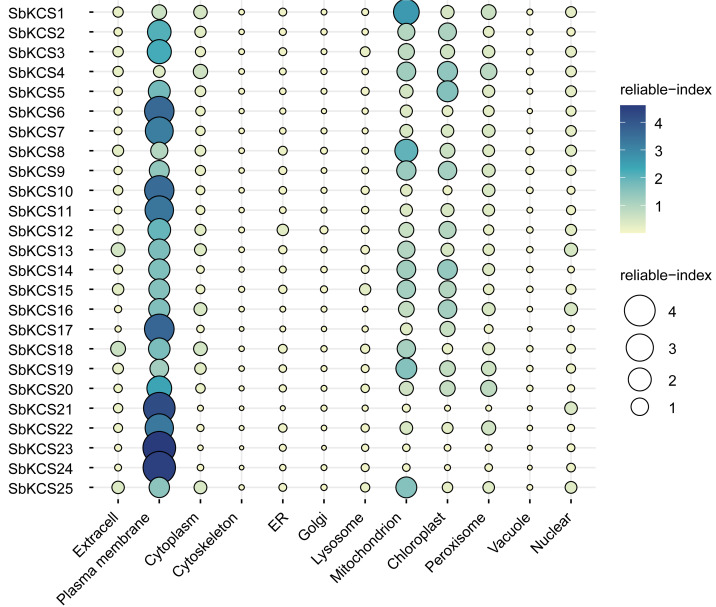
The aboveground parts of plants are covered with cuticle, a hydrophobic layer composed of cutin polyester and cuticular wax that can protect plants from various environmental stresses. β-Ketoacyl-CoA synthase (KCS) is the key rate-limiting enzyme in plant wax synthesis. Although the properties of KCS family genes have been investigated in many plant species, the understanding of this gene family in sorghum is still limited. Here, a total of 25 SbKCS genes were identified in the sorghum genome, which were named from SbKCS1 to SbKCS25. Evolutionary analysis among different species divided the KCS family into five subfamilies and the SbKCSs were more closely related to maize, implying a closer evolutionary relationship between sorghum and maize. All SbKCS genes were located on chromosomes 1, 2, 3, 4, 5, 6, 9 and 10, respectively, while Chr 1 and Chr 10 contained more KCS genes than other chromosomes. The prediction results of subcellular localization showed that SbKCSs were mainly expressed in the plasma membrane and mitochondria. Gene structure analysis revealed that there was 0-1 intron in the sorghum KCS family and SbKCSs within the same subgroup were similar. Multiple cis-acting elements related to abiotic stress, light and hormone response were enriched in the promoters of SbKCS genes, which indicated the functional diversity among these genes. The three-dimensional structure analysis showed that a compact spherical space structure was formed by various secondary bonds to maintain the stability of SbKCS proteins, which was necessary for their biological activity. qRT-PCR results revealed that nine randomly selected SbKCS genes expressed differently under drought and salt treatments, among which SbKCS8 showed the greatest fold of expression difference at 12 h after drought and salt stresses, which suggested that the SbKCS genes played a potential role in abiotic stress responses. Taken together, these results provided an insight into investigating the functions of KCS family in sorghum and in response to abiotic stress.
Keywords: Abiotic stress; KCS gene family; Sorghum bicolor.
©2022 Zhang et al.
Conflict of interest statement
Junping Wu is employed by Nantong Changjiang Seed Co., Ltd.
Figures


Similar articles
-
Genome-wide identification and analysis of ACP gene family in Sorghum bicolor (L.) Moench.BMC Genomics. 2022 Jul 25;23(1):538. doi: 10.1186/s12864-022-08776-2. BMC Genomics. 2022. PMID: 35879672 Free PMC article. Review.
-
Genome-wide identification, expression analysis, and functional study of the GRAS transcription factor family and its response to abiotic stress in sorghum [Sorghum bicolor (L.) Moench].BMC Genomics. 2021 Jul 6;22(1):509. doi: 10.1186/s12864-021-07848-z. BMC Genomics. 2021. PMID: 34229611 Free PMC article.
-
Genome-wide identification and expression profile analysis of nuclear factor Y family genes in Sorghum bicolor L. (Moench).PLoS One. 2019 Sep 19;14(9):e0222203. doi: 10.1371/journal.pone.0222203. eCollection 2019. PLoS One. 2019. PMID: 31536532 Free PMC article.
-
A Comprehensive Analysis In Silico of KCS Genes in Maize Revealed Their Potential Role in Response to Abiotic Stress.Plants (Basel). 2024 Dec 16;13(24):3507. doi: 10.3390/plants13243507. Plants (Basel). 2024. PMID: 39771204 Free PMC article.
-
Current advances in the molecular regulation of abiotic stress tolerance in sorghum via transcriptomic, proteomic, and metabolomic approaches.Front Plant Sci. 2023 May 10;14:1147328. doi: 10.3389/fpls.2023.1147328. eCollection 2023. Front Plant Sci. 2023. PMID: 37235010 Free PMC article. Review.
Cited by
-
Genome-wide identification and expression analysis of the KCS gene family in soybean (Glycine max) reveal their potential roles in response to abiotic stress.Front Plant Sci. 2023 Dec 5;14:1291731. doi: 10.3389/fpls.2023.1291731. eCollection 2023. Front Plant Sci. 2023. PMID: 38116151 Free PMC article.
-
Genome-wide analysis of the KCS gene family in Medicago truncatula and their expression profile under various abiotic stress.Sci Rep. 2025 May 7;15(1):15938. doi: 10.1038/s41598-025-00809-6. Sci Rep. 2025. PMID: 40335581 Free PMC article.
-
Genome-Wide Analysis of KCS Gene Family in Ginkgo biloba L. and Functional Identification of KCS7 in Oleic Acid Synthesis.Genes (Basel). 2025 Jun 30;16(7):773. doi: 10.3390/genes16070773. Genes (Basel). 2025. PMID: 40725436 Free PMC article.
-
Genome-Wide Investigation and Functional Analysis Reveal That CsKCS3 and CsKCS18 Are Required for Tea Cuticle Wax Formation.Foods. 2023 May 16;12(10):2011. doi: 10.3390/foods12102011. Foods. 2023. PMID: 37238828 Free PMC article.
-
Tackling functional redundancy of Arabidopsis fatty acid elongase complexes.Front Plant Sci. 2023 Jan 25;14:1107333. doi: 10.3389/fpls.2023.1107333. eCollection 2023. Front Plant Sci. 2023. PMID: 36798704 Free PMC article.
References
-
- Bourdenx B, Bernard A, Domergue F, Pascal S, Léger A, Roby D, Pervent M, Vile D, Haslam RP, Napier JA, Lessire R, Joubès J. Overexpression of Arabidopsis ECERIFERUM1 promotes wax very-long-chain alkane biosynthesis and influences plant response to biotic and abiotic stresses. Plant Physiology. 2011;156(1):29–45. doi: 10.1104/pp.111.172320. - DOI - PMC - PubMed
Publication types
MeSH terms
Substances
LinkOut - more resources
Full Text Sources
