. 2022 Sep 26:15:935111.
doi: 10.3389/fnmol.2022.935111. eCollection 2022.

Combined brain-derived neurotrophic factor and neurotrophin-3 treatment is preferred over either one separately in the preservation of the auditory nerve in deafened guinea pigs

Affiliations

Combined brain-derived neurotrophic factor and neurotrophin-3 treatment is preferred over either one separately in the preservation of the auditory nerve in deafened guinea pigs

Henk A Vink et al. Front Mol Neurosci. .

Abstract

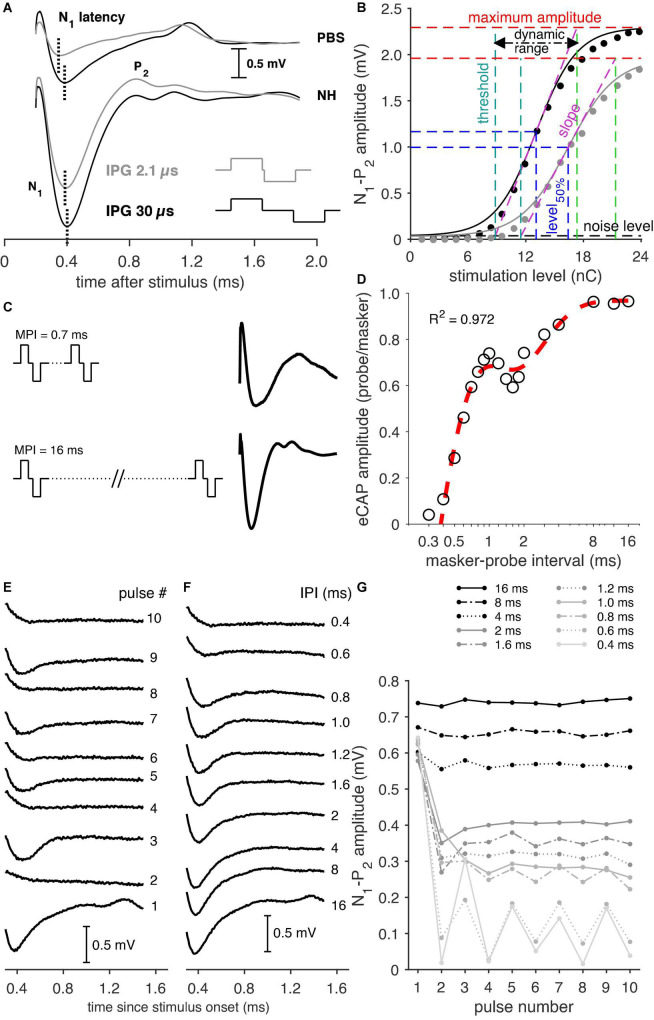
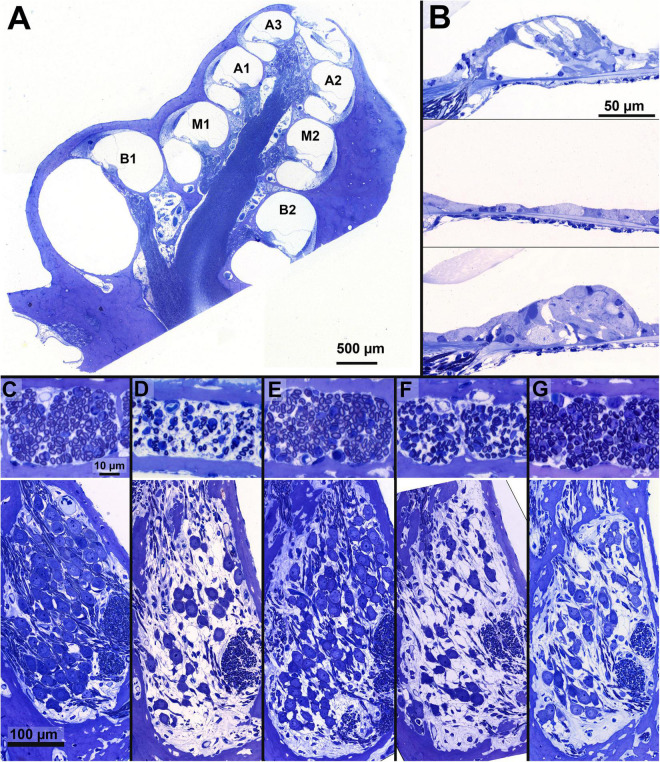
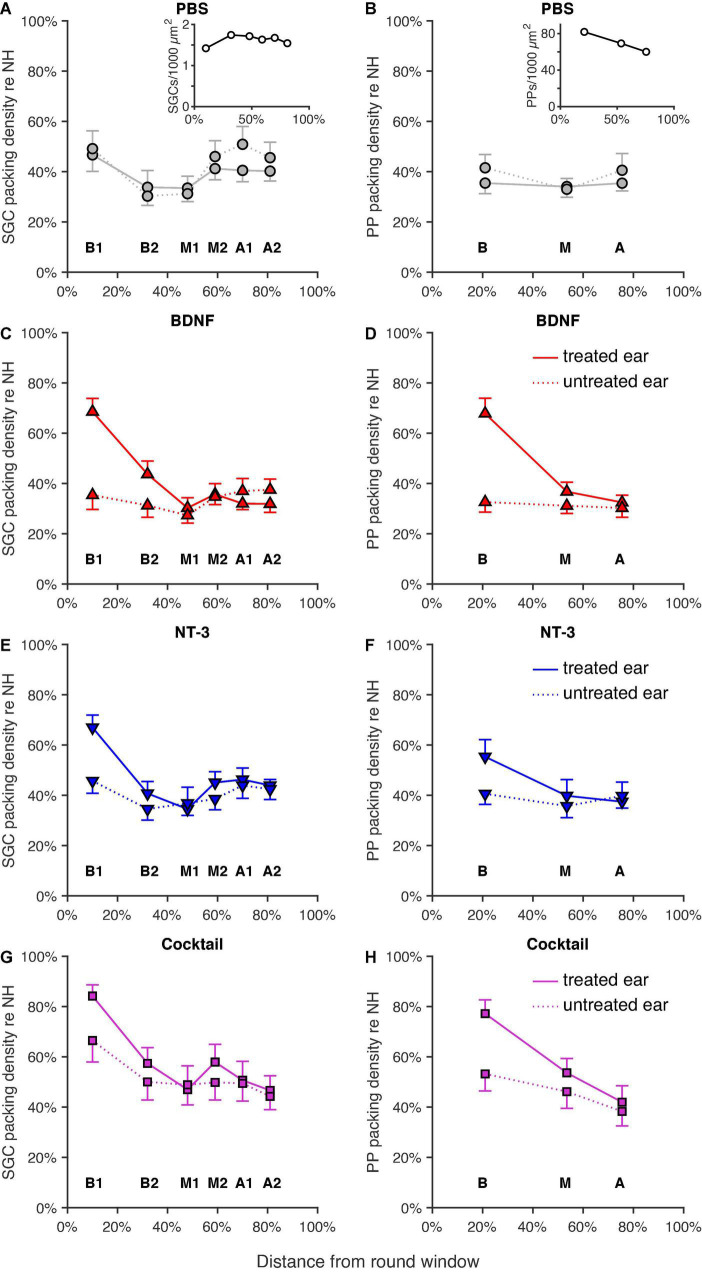
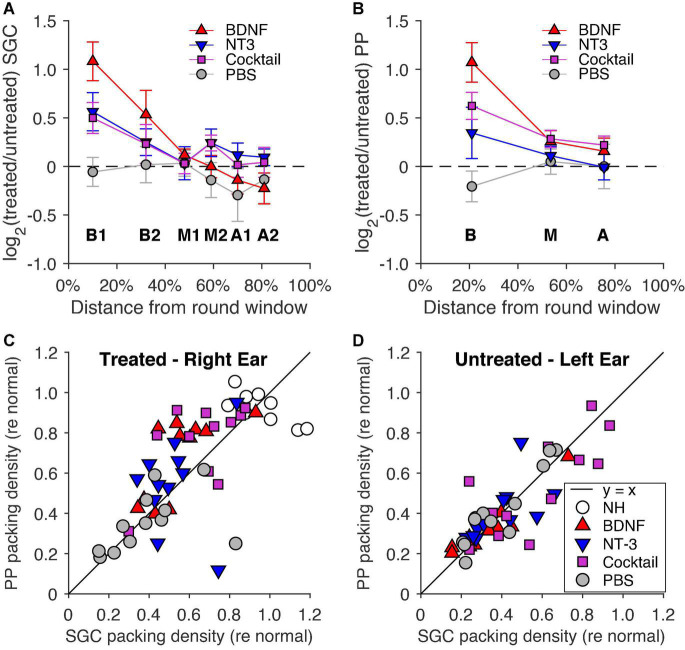
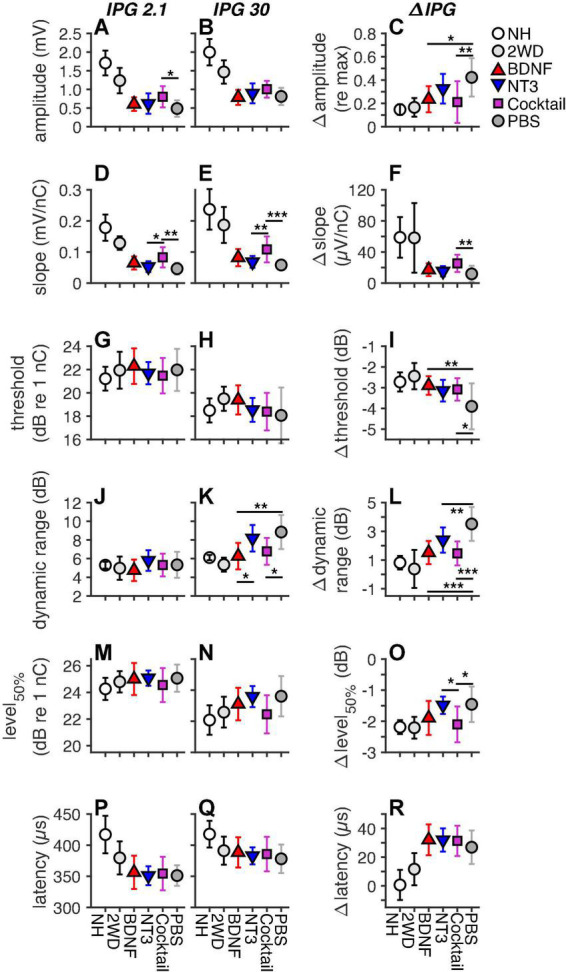
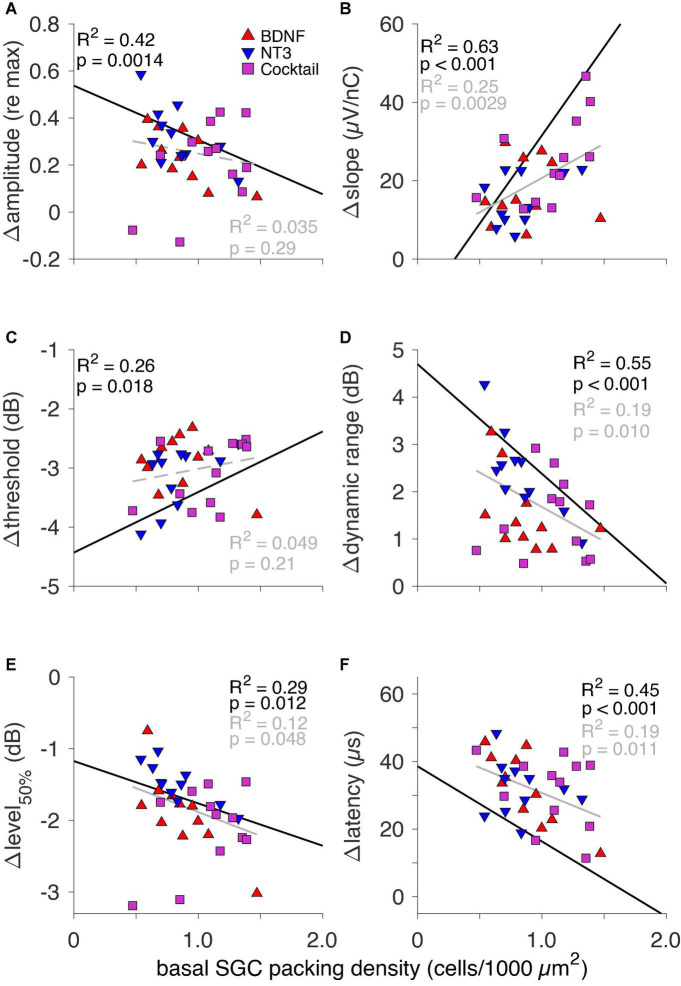
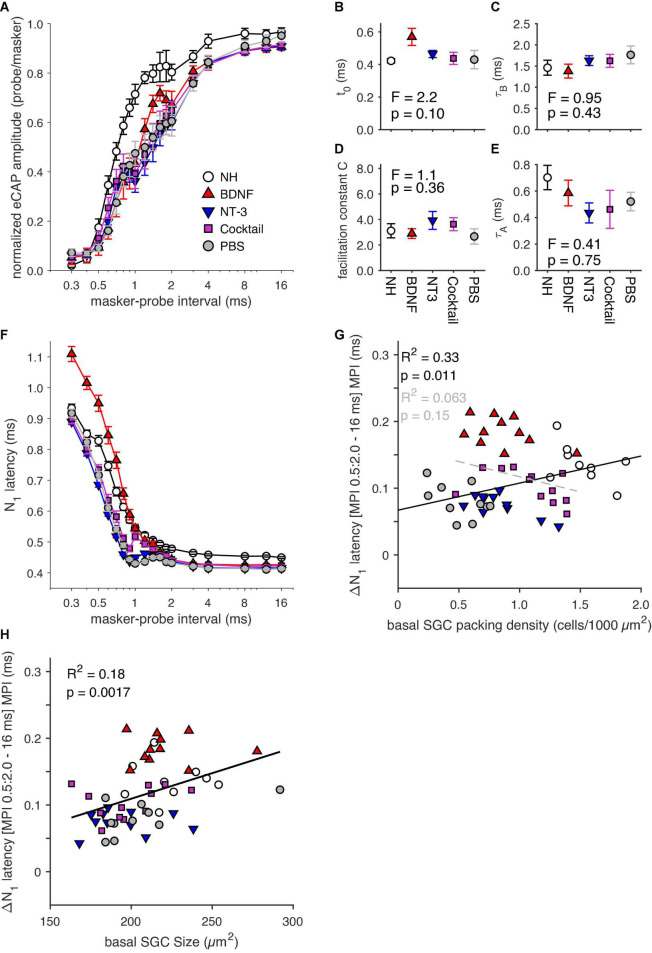
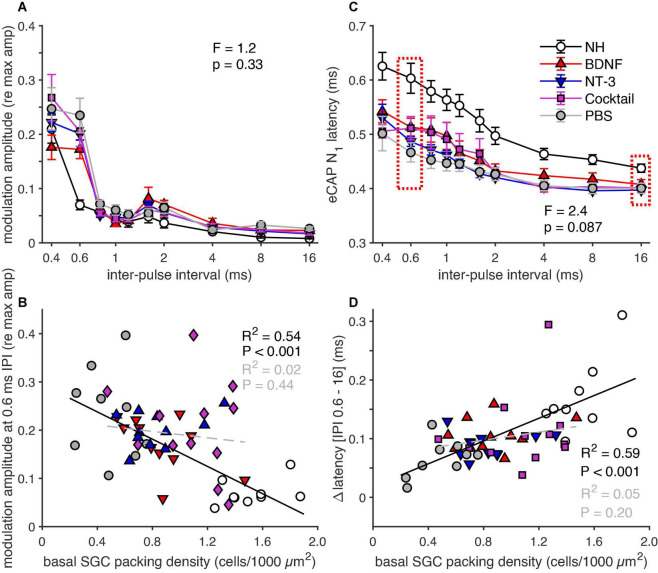
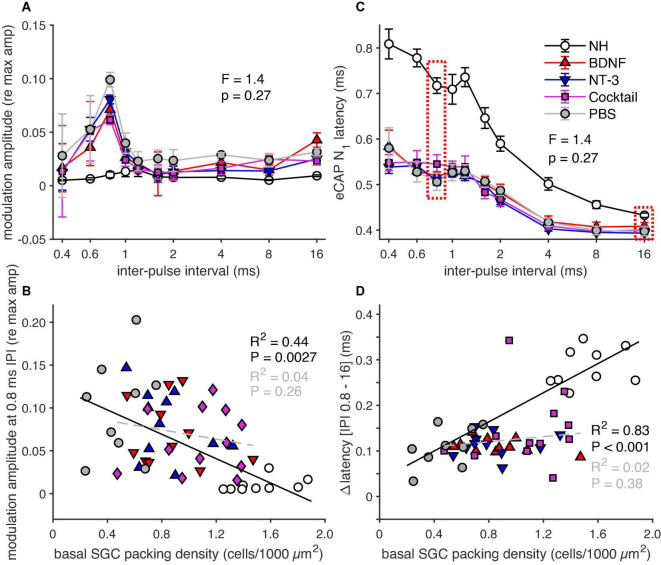
Severe hearing loss or deafness is often caused by cochlear hair cell loss and can be mitigated by a cochlear implant (CI). CIs target the auditory nerve, consisting of spiral ganglion cells (SGCs), which degenerate gradually, following hair cell loss. In animal models, it has been established that treatment with the neurotrophins brain-derived neurotrophic factor (BDNF) and neurotrophin-3 (NT-3) reduce SGC degeneration. In this study, we aimed to investigate whether treatment with both BDNF and NT-3 (Cocktail) is superior to treatment with each neurotrophin separately regarding cell preservation and neural responsiveness to electrical stimulation. To this end, deafened guinea pigs received neurotrophic treatment in their right ear via a gelatin sponge on the perforated round window membrane, followed by cochlear implantation 4 weeks later in the same ear for electrophysiological recordings to various stimulation paradigms. Normal-hearing and deafened untreated guinea pigs were included as positive and negative controls, respectively. Substantial SGC loss occurred in all deafened animals. Each of the neurotrophic treatments led to enhanced SGC survival mainly in the basal turn of the cochlea, gradually decreasing toward the apex. The Cocktail treatment resulted in the highest SGC survival in the treated ear, followed by BDNF, with the least protection of SGCs following NT-3 treatment. Survival of the SGC's peripheral processes (PPs) followed the same trend in response to the treatment. However, survival of SGCs and PPs in the contralateral untreated ears was also highest in the Cocktail group. Consequently, analysis of the ratio between the treated and untreated ears showed that the BDNF group, which showed low SGC survival in the untreated ear, had the highest relative SGC survival of the three neurotrophin-treated groups. Neurotrophic treatment had positive effects in part of the electrically evoked compound action-potential recording paradigms. These effects were only observed for the BDNF or Cocktail treatment. We conclude that treatment with either BDNF or a cocktail of BDNF and NT-3 is preferred to NT-3 alone. Furthermore, since the Cocktail treatment resulted in better electrophysiological responsiveness and overall higher SGC survival than BDNF alone, we are inclined to recommend the Cocktail treatment rather than BDNF alone.

Keywords: cochlea; cochlear implant; eCAP; hearing loss; neurodegeneration; neuroprotection; neurotrophin.


Conflict of interest statement

The authors declare that the research was conducted in the absence of any commercial or financial relationships that could be construed as a potential conflict of interest.

Figures

FIGURE 1
FIGURE 1
Examples of the various eCAP recording paradigms. (A) Examples of eCAPs from a PBS animal (top) and a normal-hearing (NH) animal (bottom) for both an IPG of 2.1 and 30 μs (pulse shapes illustrated in the lower right corner), with the indication of the N1 latency. (B) Input–output curves of an NH animal for an IPG of 2.1 (gray markers) and 30 μs (black markers), with corresponding sigmoid fitting (solid lines) and the derived eCAP measures. (C) Examples of eCAP recordings following a short (0.7 ms) masker-probe interval (MPI) and the longest (16 ms) MPI from a normal-hearing animal. (D) Example of an eCAP amplitude recovery function from an NH animal including the double exponential fit (red trace). (E) eCAP recordings from a Cocktail animal to the first ten pulses of a pulse train with an inter-pulse interval (IPI) of 0.6 ms. Note the alternating pattern in the eCAP waveform, with higher amplitudes following odd-numbered pulses and lower amplitudes following even-numbered pulses. (F) Examples of eCAPs evoked by the tenth pulse at each IPI used in the pulse-train paradigm. Note the gradual decrease of eCAP amplitude and increase of N1 latency with shorter IPIs. (G) The eCAP N1-P2 amplitudes in response to each of ten pulses for every IPI (0.4–16 ms).
FIGURE 2
FIGURE 2
Examples of cochlear micrographs. (A) A cross-section of a guinea pig cochlea along a midmodiolar plane, with the seven cochlear locations (semi-turns), B1-A3 from base to apex. (B) Examples of the organ of Corti containing the cochlear hair cells, with an NH example (top, M1), and two examples following ototoxic deafening: a completely degenerated (middle, M1) and a collapsed and degenerating organ of Corti (bottom, M2). (C–G) Examples of a cross-section of peripheral processes in the osseous spiral lamina of the basal turn (in between B1 and B2; top) and Rosenthal’s canal from the upper basal turn (B2) containing the SGC somata (bottom) from a single animal per group, with a normal-hearing example in panel (C). The average PP and SGC survival relative to NH, of the examples are given in percentages: (D) PBS: SGC 49%, PP 37%; (E) BDNF-treated: SGC 65%, PP 81%; (F) NT-3-treated: SGC 37%, PP 75% and (G) a Cocktail-treated animal: SGC 78%, PP 85%.
FIGURE 3
FIGURE 3
Normalized SGC and PP packing densities as a function of cochlear location as a relative distance to the round window, with 0% as the round window membrane and 100% being the helicotrema. Group means of SGC (left column) and PP (right column) packing densities for both the treated right ears (solid lines) and the untreated left ears (dotted lines) are shown for (A,B) the PBS group (n = 12; n = 11 for location A in B), the insets represent the absolute SGC (A), and PP (B) packing densities for the NH animals, (C,D) the BDNF-treated group (n = 11), (E,F) the NT-3-treated group (n = 11; n = 10 for location B1 in F), and (G,H) the Cocktail-treated group (n = 12; n = 10 for location B1 in G; n = 11 for location A in H). Error bars represent SEM.
FIGURE 4
FIGURE 4
Log2 transformed ratio between the right (treated) and left (untreated) ears for (A) SGC packing density and (B) PP packing density as a function of cochlear location relative to the round window, with 0% as the round window and 100% as the helicotrema. The dashed line indicates equal packing densities between the treated and untreated ears. PBS, n = 12 (n = 11 for location A in B); BDNF, n = 12; NT-3, n = 11 (n = 10 for location B1 in A); Cocktail, n = 12 (n = 10 for location B1 in A; n = 11 for location A in B). Error bars represent SEM. Normalized basal packing densities of PPs are shown as a function of normalized SGC packing density for (C) the right (treated) ear and (D) the left (untreated) ear. The black y = x line represents the 1:1 ratio of PP: SGC packing density.
FIGURE 5
FIGURE 5
Mean eCAP characteristics for each group, including animals with a deafness duration of 2 weeks (2WD), the time point at which the treatment was started, which were taken from Ramekers et al. (2014). The left and middle columns represent the absolute eCAP characteristics for an IPG of 2.1 and 30 μs, respectively. The right column represents the IPG effect (ΔIPG), as the difference between the two preceding columns. (A–C), maximum amplitude; (D–F), slope; (G–I), threshold; (J–L), dynamic range; (M–O), level50%; (P–R), N1 latency. NH, n = 9; PBS, n = 12; BDNF, n = 11; NT-3, n = 11; Cocktail, n = 12. Error bars represent standard deviation. Note that some error bars in the NH group are very small and overlap with the data point. *p < 0.05; **p < 0.01; ***p < 0.001.
FIGURE 6
FIGURE 6
The IPG effect for all six eCAP characteristics as a function of basal SGC packing density for individual neurotrophin-treated animals only. Black text and regression lines represent the correlation between the ΔIPG measure and SGC packing density for both NH and the sham-treated PBS (i.e., non-neurotrophin-treated) groups. The gray text and regression lines represent this correlation for the neurotrophin-treated animals only. Solid lines indicate an R2 value with p < 0.05; dashed lines indicate p > 0.05. (A) Δamplitude, (B) Δslope, (C) Δthreshold, (D) Δdynamic range, (E) Δlevel50%, and (F) Δlatency.
FIGURE 7
FIGURE 7
(A) Group means of masker-probe recovery functions constructed using 18 masker-probe intervals (MPIs; range: 0.3–16 ms). (B–E) Fitting parameters derived from fitting a double exponential to the recovery functions in panel (A). (F) N1 latency of the eCAP evoked by the probe stimulus for the 18 MPIs. (G) ΔN1 latency between the mean latency of the MPI range 0.5–2 ms, and that for the 16-ms MPI for individual animals as a function of basal SGC packing density. (H) ΔN1 latency between the mean latency of the MPI range 0.5–2 ms, and that for the 16-ms MPI for individual animals as a function of basal SGC size. NH, n = 9; PBS, n = 10; BDNF, n = 11; NT-3, n = 11; Cocktail, n = 12. Error bars represent SEM.
FIGURE 8
FIGURE 8
eCAP parameters derived from the responses to the first ten pulses in a pulse train. (A) Group means of the normalized eCAP amplitude modulation, of the last six of the ten pulses, as function of IPI. (B) Group means of eCAP N1 latency of the last six of the ten pulses, as function of IPI. (C) Amplitude modulation for an IPI of 0.6 ms for all individual animals as a function of basal SGC packing density, regression was calculated on the NH and PBS animals (black line) and on the neurotrophin-treated animals (gray line). (D) ΔN1 latency between 0.6 and 16 ms, for the individual animals as a function of SGC packing density. The regression was calculated on the NH and PBS animals (black line) and on the neurotrophin-treated animals (gray line). NH, n = 9; PBS, n = 9; BDNF, n = 11; NT-3, n = 11; Cocktail, n = 12. Error bars represent SEM.
FIGURE 9
FIGURE 9
eCAP parameters derived from the responses to the last ten pulses of a 100-ms pulse train. (A) Group means of the normalized eCAP amplitude modulation as a function of IPI for all ten pulses. (B) Group means of eCAP N1 latency as a function of IPI for all ten pulses. (C) Amplitude modulation for an IPI of 0.8 ms for all individual animals as a function of basal SGC packing density, regression was performed on the NH and PBS animals only. (D) ΔN1 latency between 0.8 and 16 ms, for the individual animals as a function of SGC packing density. The regression was calculated on the NH and PBS animals only. NH, n = 9; PBS, n = 9; BDNF, n = 11; NT-3, n = 11; Cocktail, n = 12. Error bars represent SEM.

Similar articles

Cited by

References

    1. Adamson C. L., Reid M. A., Davis R. L. (2002). Opposite actions of brain-derived neurotrophic factor and Neurotrophin-3 on firing features and ion channel composition of murine spiral ganglion neurons. J. Neurosci. 22 1385–1396. 10.1523/JNEUROSCI.22-04-01385.2002 - DOI - PMC - PubMed
    1. Agterberg M. J. H., Versnel H., de Groot J. C. M. J., Smoorenburg G. F., Albers F. W. J., Klis S. F. L. (2008). Morphological changes in spiral ganglion cells after intracochlear application of brain-derived neurotrophic factor in deafened guinea pigs. Hear. Res. 244 25–34. 10.1016/j.heares.2008.07.004 - DOI - PubMed
    1. Agterberg M. J. H., Versnel H., van Dijk L. M., de Groot J. C. M. J., Klis S. F. L. (2009). Enhanced survival of spiral ganglion cells after cessation of treatment with brain-derived neurotrophic factor in deafened guinea pigs. J. Assoc. Res. Otolaryngol. 10 355–367. 10.1007/s10162-009-0170-2 - DOI - PMC - PubMed
    1. Budenz C. L., Wong H. T., Swiderski D. L., Shibata S. B., Pfingst B. E., Raphael Y. (2015). Differential Effects of AAV.BDNF and AAV.Ntf3 in the Deafened Adult Guinea Pig Ear. Sci. Rep. 5:8619. 10.1038/srep08619 - DOI - PMC - PubMed
    1. Coggeshall R. E., Lekan H. A. (1996). Methods for determining numbers of cells and synapses: a case for more uniform standards of review. J. Comp. Neurol. 364 6–15. 10.1002/(SICI)1096-9861(19960101)364:1<6::AID-CNE2>3.0.CO;2-9 - DOI - PubMed