. 2022 Oct 13;18(10):e1010431.
doi: 10.1371/journal.pgen.1010431. eCollection 2022 Oct.

The entry of unclosed autophagosomes into vacuoles and its physiological relevance

Affiliations

The entry of unclosed autophagosomes into vacuoles and its physiological relevance

Zulin Wu et al. PLoS Genet. .

Abstract

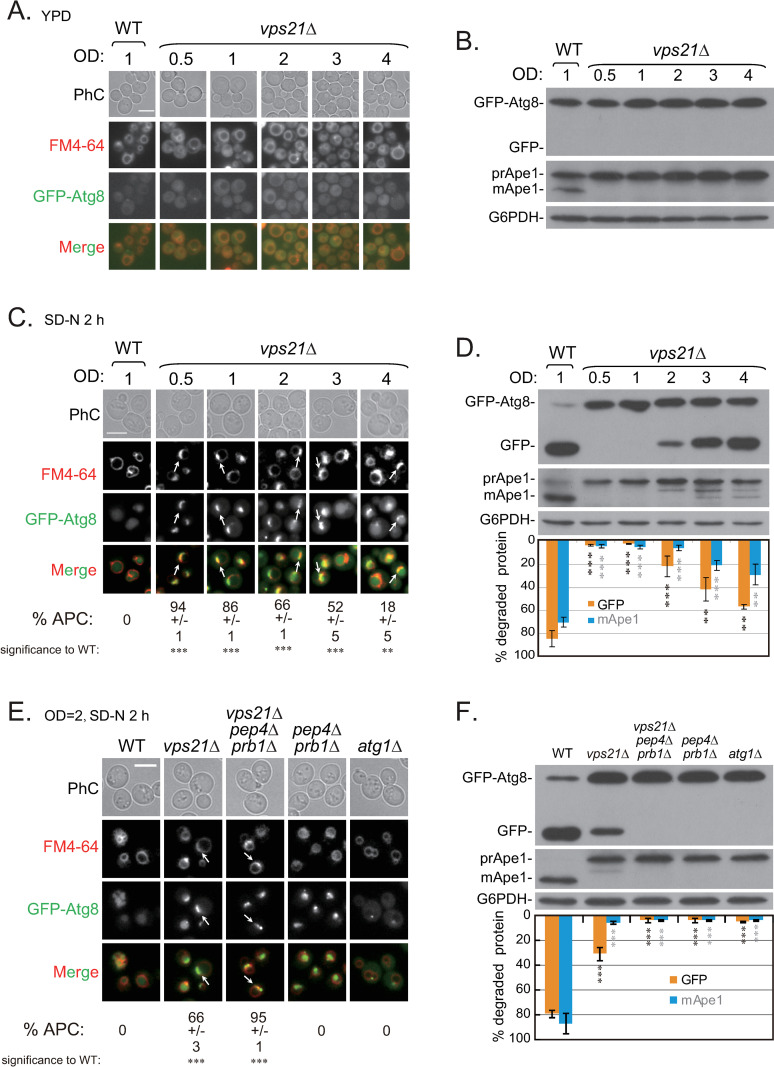
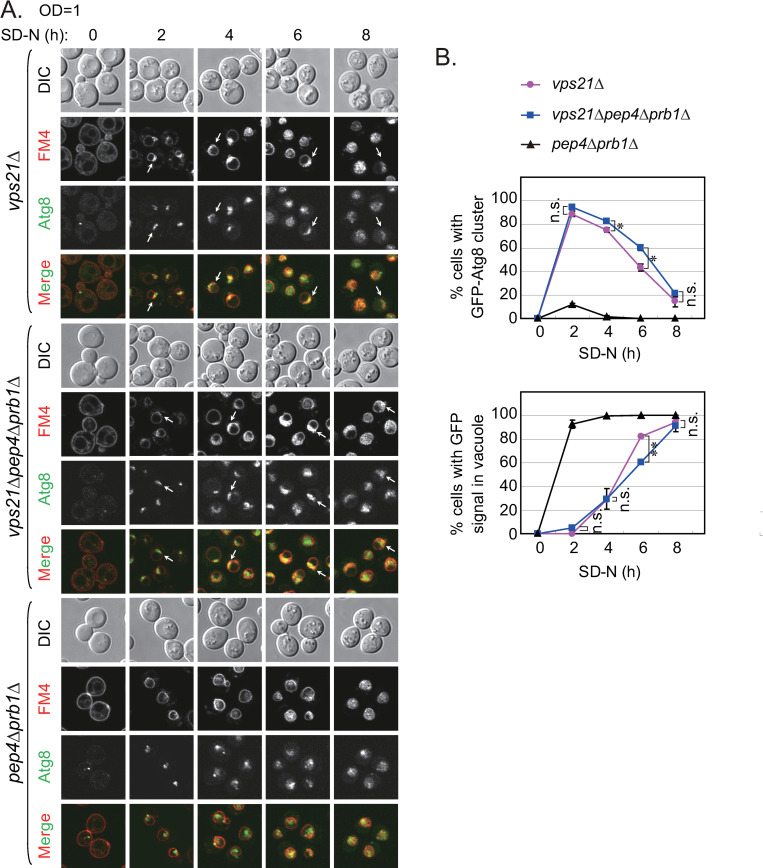
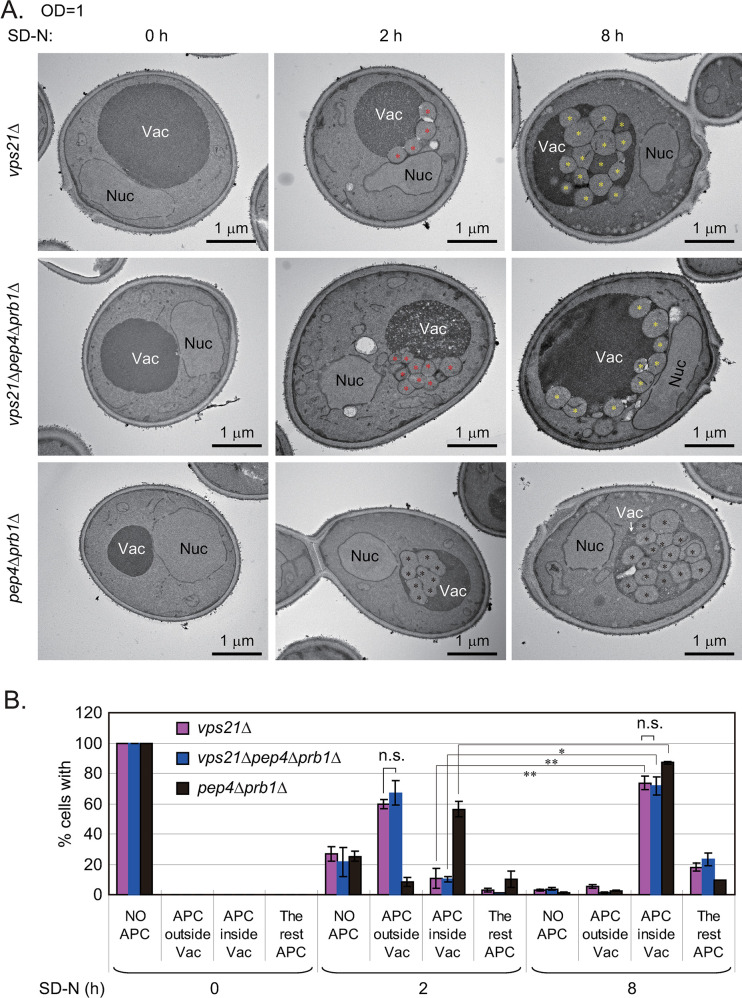
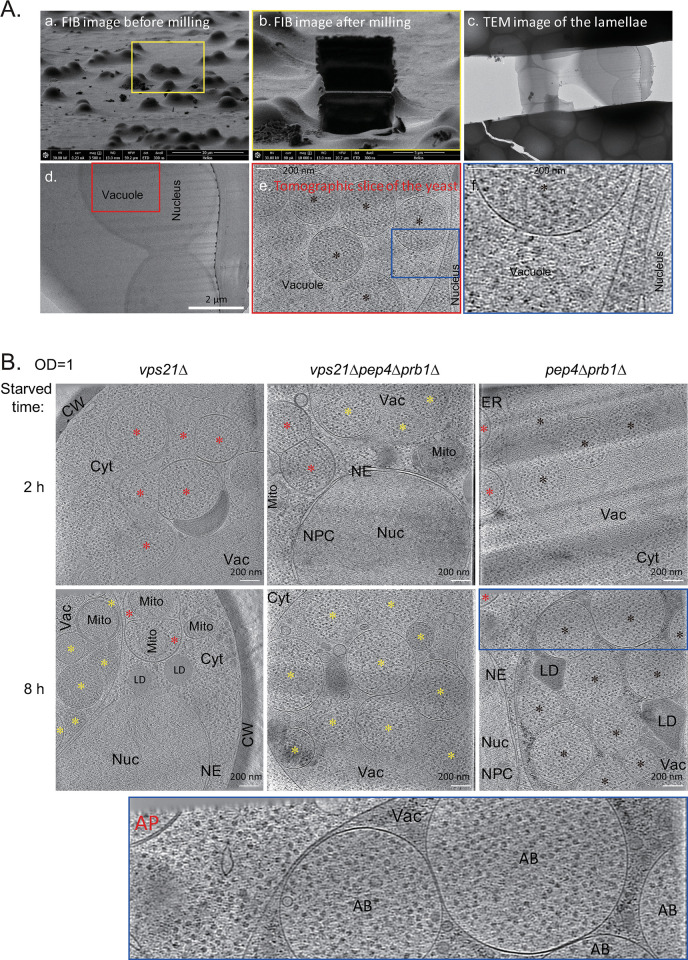
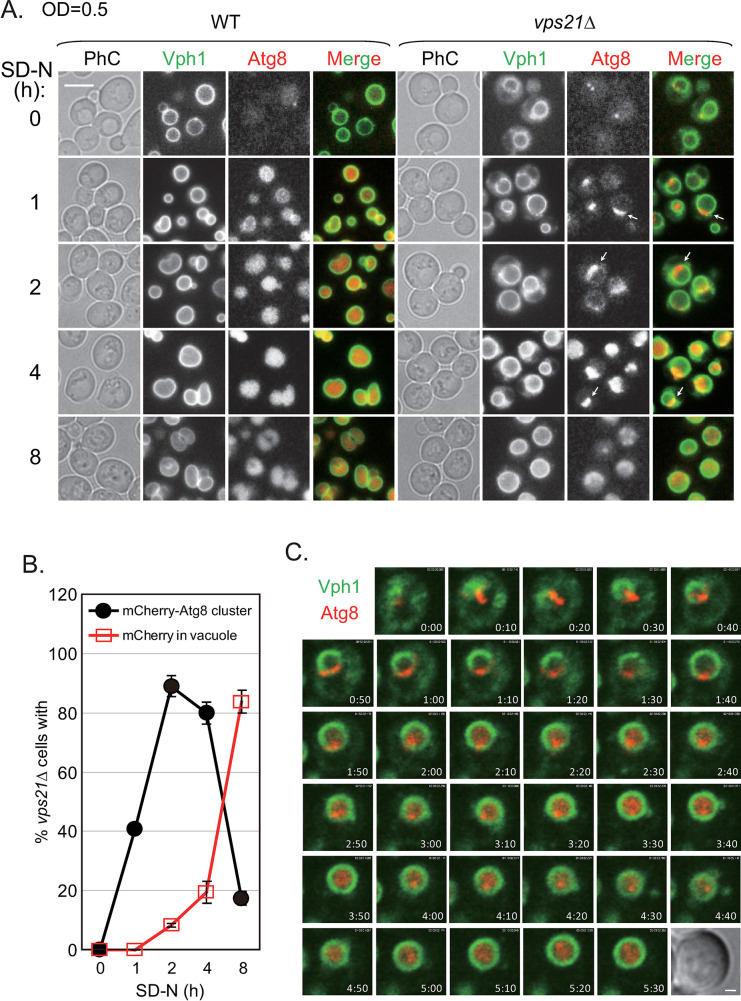
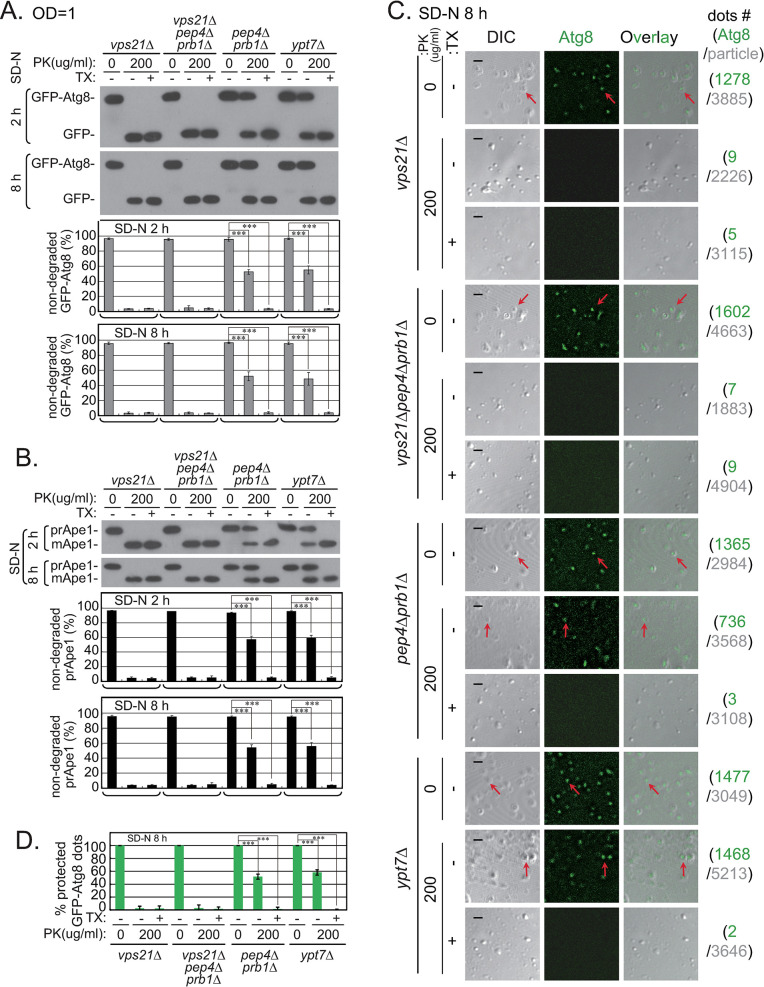
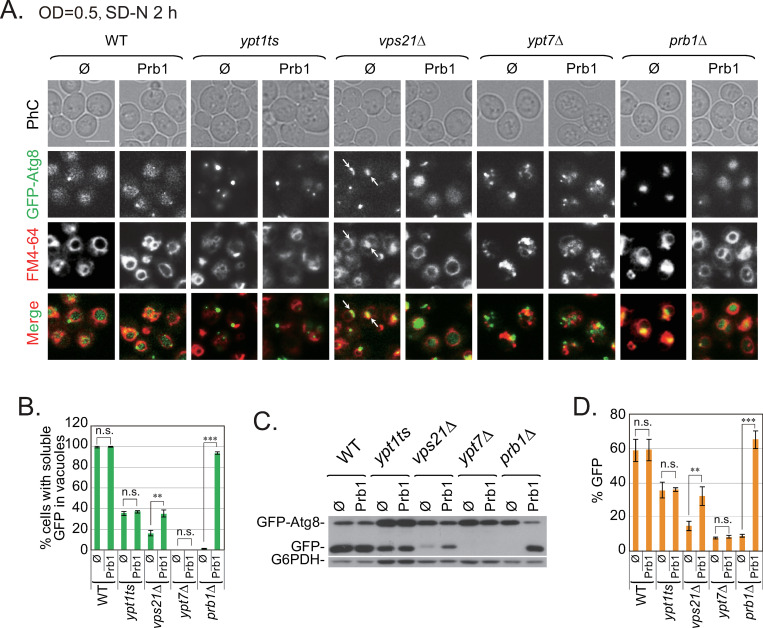
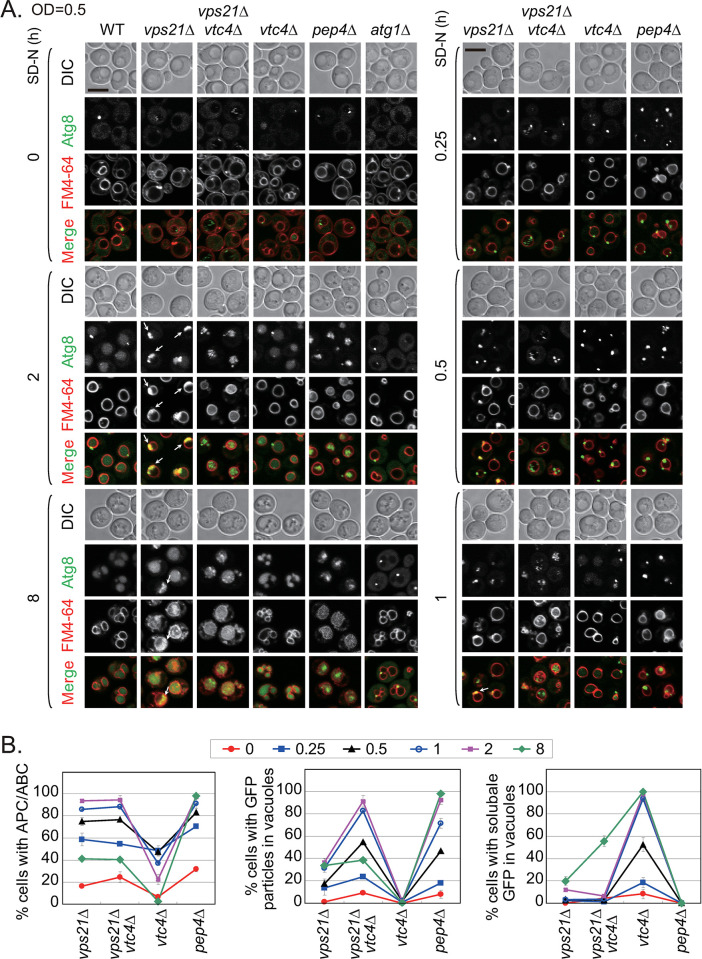
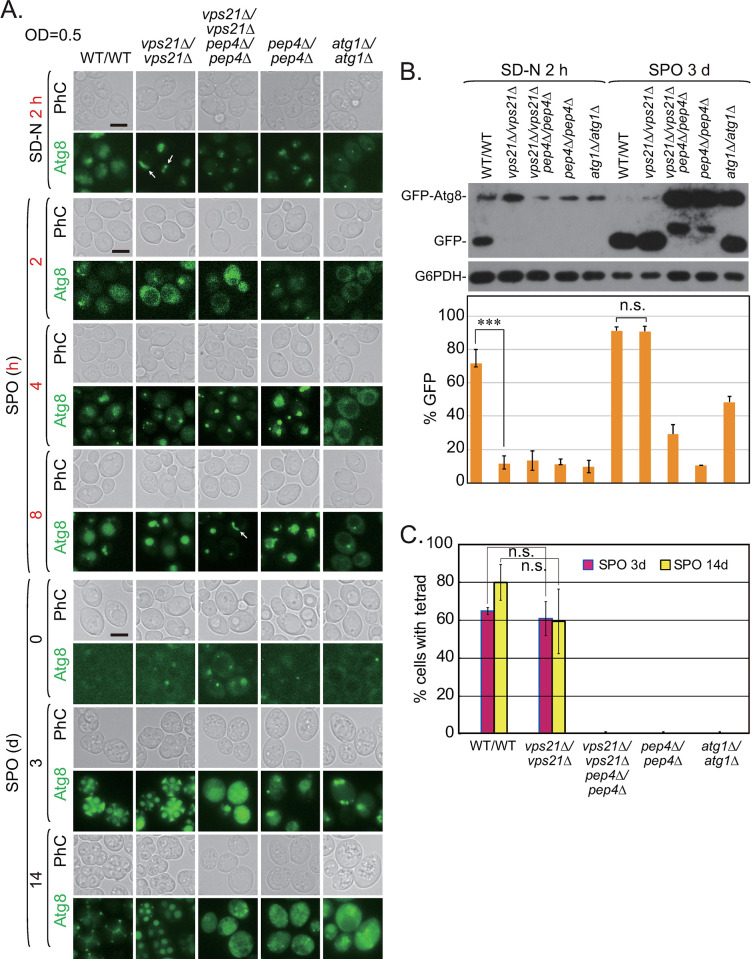
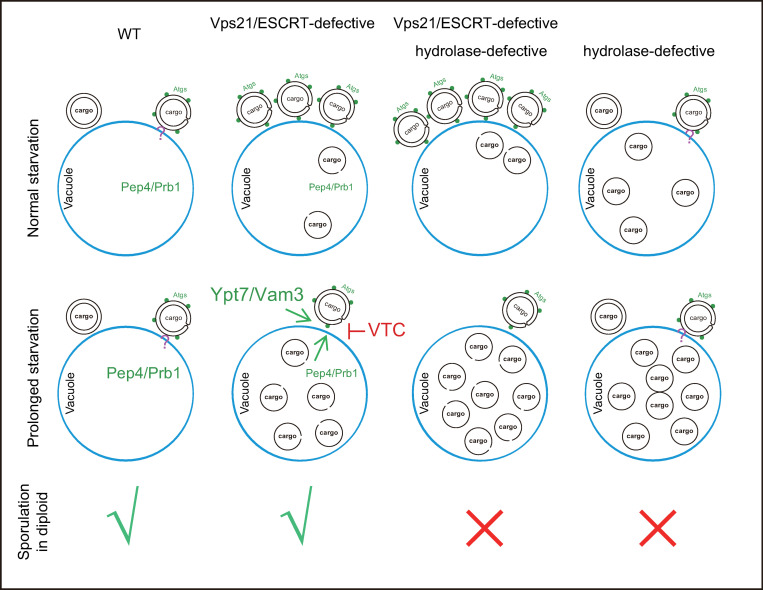
It is widely stated in the literature that closed mature autophagosomes (APs) fuse with lysosomes/vacuoles during macroautophagy/autophagy. Previously, we showed that unclosed APs accumulated as clusters outside vacuoles in Vps21/Rab5 and ESCRT mutants after a short period of nitrogen starvation. However, the fate of such unclosed APs remains unclear. In this study, we used a combination of cellular and biochemical approaches to show that unclosed double-membrane APs entered vacuoles and formed unclosed single-membrane autophagic bodies after prolonged nitrogen starvation or rapamycin treatment. Vacuolar hydrolases, vacuolar transport chaperon (VTC) proteins, Ypt7, and Vam3 were all involved in the entry of unclosed double-membrane APs into vacuoles in Vps21-mutant cells. Overexpression of the vacuolar hydrolases, Pep4 or Prb1, or depletion of most VTC proteins promoted the entry of unclosed APs into vacuoles in Vps21-mutant cells, whereas depletion of Pep4 and/or Prb1 delayed the entry into vacuoles. In contrast to the complete infertility of diploid cells of typical autophagy mutants, diploid cells of Vps21 mutant progressed through meiosis to sporulation, benefiting from the entry of unclosed APs into vacuoles after prolonged nitrogen starvation. Overall, these data represent a new observation that unclosed double-membrane APs can enter vacuoles after prolonged autophagy induction, most likely as a survival strategy.


Conflict of interest statement

The authors have declared that no competing interests exist.

Figures

Fig 1
Fig 1. The growth stage before nitrogen starvation and the availability of vacuolar hydrolases impacted the accumulation of autophagosome clusters (APCs) in vps21Δ cells.
A. The increased cell density (OD600) of vps21Δ cells grown in rich medium did not result in GFP-Atg8 entering into vacuoles. GFP-Atg8-labeled WT and vps21Δ cells were grown to the indicated OD600 values in rich medium (yeast extract peptone dextrose [YPD] medium) and observed for GFP-Atg8 localization and FM4-64 signals. For WT cells, only the results at an OD600 of 1 are presented. B. No autophagy processing was detected in vps21Δ cells with OD600 values ranging from 0.5 to 4. The cells were grown as described in panel A. GFP-Atg8 processing to GFP and prApe1 processing to mApe1 were determined for cell lysates by performing immunoblotting analysis with anti-GFP and anti-Ape1 antibodies, respectively. G6PDH was detected as a loading control. C. When starting with a high cell density before nitrogen starvation, the accumulation of GFP-Atg8-labeled APCs in vps21Δ cells decreased after nitrogen starvation. WT and vps21Δ cells were grown and starved as indicated and stained with FM4-64 for 1 h before being harvested for fluorescence observations. The percentages of cells containing APCs were quantified and are presented below the merged pictures. D. When the cell density was high before nitrogen starvation, autophagy processing in vps21Δ cells increased after nitrogen starvation. Cells were grown as described in panel C. GFP-Atg8 and prApe1 processing were determined for cell lysates as described in panel B. G6PDH was detected as a loading control. GFP-Atg8 and prApe1 processing were quantified and are presented below the G6PDH blot. E. The accumulation of GFP-Atg8-labeled APCs in vps21Δ cells increased after nitrogen starvation in the absence of the vacuolar hydrolases Pep4 and Prb1. Cells were grown as described in panel A to an OD600 of 2 and starved in SD-N medium for 2 h. The cells were examined and the data are presented as described in panel C. F. The partial autophagy processing observed in vps21Δ cells after nitrogen starvation was completely blocked in vps21Δpep4Δprb1Δ cells. The cells were grown as described in panel E, and autophagy processing was determined and presented as done in panel D. PhC, phase contrast; scale bars in panels A, C, and E, 5 μm; arrows, APCs, and OD, OD600. The data shown are presented as the mean +/- the standard deviation (STD). **p < 0.01; ***p < 0.001. Over 600 cells per strain were counted. The results shown represent three independent experiments.
Fig 2
Fig 2. The accumulated APCs in vps21Δ cells entered vacuoles after prolonged nitrogen starvation.
A. The accumulated GFP-Atg8-labeled APCs observed in vps21Δ cells gradually entered vacuoles during prolonged nitrogen starvation. The indicated cells expressing GFP-Atg8 (as in Fig 1E) were grown in YPD medium as described in Fig 1A to an OD600 value of 1 and then starved in SD-N medium for the indicated durations before fluorescence observations were made. FM4-64 was added 1 h before the cells were collected for visualization by fluorescence microscopy. DIC, differential- interference contrast; scale bar, 5 μm; arrows, APCs. B. Quantification of the cells containing APCs and GFP signals in vacuoles shown in panel A. Under prolonged nitrogen starvation, the percentage of vps21Δ and vps21Δpep4Δprb1Δ cells (top) containing APCs peaked after 2 h of nitrogen starvation and subsequently declined, whereas the percentage of vps21Δ and vps21Δpep4Δprb1Δ cells containing GFP signals in vacuoles gradually increased in the cells (bottom). However, GFP-Atg8 increasingly entered vacuoles in pep4Δprb1Δ cells to accumulate under prolonged nitrogen starvation (bottom). The data shown are presented as the mean +/- STD. *p < 0.05; **p < 0.01; n.s., not significant. Over 500 cells per strain were counted. The results shown represent two independent experiments.
Fig 3
Fig 3. Ultrastructural analysis of APCs in vps21Δ cells after representative durations of nitrogen starvation.
Cells were grown and treated as described in Fig 2A but were not stained with FM4-64. A. Cells after 0, 2 or 8 h of nitrogen starvation were fixed and subjected to transmission electron microscopy (TEM) analysis as described [11]. We referred to the autophagosome-like structures outside vacuoles as autophagosomes (APs) and to those inside vacuoles as autophagic bodies (ABs). If they were found in clusters, they were referred as AP clusters (APCs) or AB clusters (ABCs). Vac, vacuole; Nuc, nucleus; red asterisks, APs; yellow asterisks, ABs; black asterisks, closed ABs. B. Quantification for cells containing APCs in panel A. Cells were divided into four categories regarding APCs: NO APCs, no obvious APCs; APC outside Vac, greater than or equal to half of the AP-like structures resided outside of vacuoles; APCs inside Vac, over half of the AP-like structures (APs and/or ABs) resided inside vacuoles; the rest, difficult to distinguish whether the AP-like structures resided inside or outside of vacuoles. The columns represent the mean and the error bars represent the STD. *p < 0.05; **p < 0.01; n.s., not significant. Over 400 slices were counted for each strain following each treatment. The results shown represent two independent experiments.
Fig 4
Fig 4. Cryo-focus ion beam (Cryo-FIB) and cryo-electron tomography (Cryo-ET) analyses of APCs in vps21Δ cells under conditions representative of nitrogen starvation.
Cells of vps21Δ were grown and treated as described in Fig 3A. After subjecting the cells to nitrogen starvation for 2 or 8 h, they were immediately analyzed using the Cryo-FIB and Cryo-ET methods, as described in the Materials and methods section. A. The major steps of Cryo-FIB and Cryo-ET are shown from the left top to the right bottom: a. FIB image before milling; b. FIB image after milling; c. TEM image of the lamellae; d. magnified TEM image; e. tomographic slice of the yeast cells; f. magnified tomographic slice of the yeast cells. The same color frame indicates the same area. B. Tomographic slice of the nucleus–vacuole junction area of the indicated yeast cells starved for 2 or 8 h. The blue framed area of pep4Δprb1Δ cells after 8 h of nitrogen starvation was magnified below to show the image in greater details. Red asterisks, APs with a double-membrane; yellow asterisks, ABs with a single-membrane; black asterisks, closed ABs with a single-membrane; CW, cell wall; Cyt, cytoplasm; Vac, vacuole; Nuc, nucleus; NE, nuclear envelope; NPC, nuclear pore complex; Mito, mitochondria; ER, endoplasmic reticulum; LD, lipid droplet. See the supplemental video (S1–S6 Movies) for tomograms.
Fig 5
Fig 5. The entry of accumulated mCherry-Atg8-labeled clusters into vps21Δ cell vacuoles after prolonged nitrogen starvation.
WT and vps21Δ cells labeled with Vph1-GFP and mCherry-Atg8 were subjected to prolonged nitrogen starvation as described in Fig 2A, except that the cell density was set to an OD600 of 0.5 before nitrogen starvation in order to show more Atg8 clusters. A. The accumulated mCherry-Atg8 clusters on Vph1-GFP-labeled vacuole membranes in vps21Δ cells entered the vacuoles after prolonged nitrogen starvation. In contrast, the mCherry-Atg8 signal entered vacuoles in WT cells quickly after nitrogen starvation. Scale bar, 5 μm. The arrows indicate mCherry-Atg8 clusters on vacuole membranes. B. Quantification of vps21Δ cells containing mCherry-Atg8 clusters and mCherry in vacuoles. The data shown are presented as the mean +/- STD. C. Time-lapse fluorescence microscopy showed that the mCherry-Atg8 clusters of vps21Δ cells entered vacuoles after prolonged nitrogen starvation. The vps21Δ cells were grown and starved as described in Fig 5A for 1 h and loaded onto a solid SD-N-medium pad on a glass slide for time-lapse fluorescence microscopy observations with 1 min intervals. Sequential overlapping frames showing mCherry-Atg8 and Vph1-GFP fluorescence at 10 min intervals are shown in the still images, with DIC at time zero. Scale bar, 1 μm. See the supplemental video of mCherry-Atg8 and Vph1-GFP in vps21Δ cells with 1 min intervals at 5.5 h and a play rate of 10 frames/s (fps) (S7 Movie) for further details. The results shown represent at least two independent experiments.
Fig 6
Fig 6. AP-related membrane structures that entered vacuoles of vps21Δ cells after prolonged nitrogen starvation were sensitive to protease K (PK) digestion.
Cells were grown as described in Fig 2A and subjected to a conventional protease K (PK)-protection assay as described [10,45] or a modified microscopy-based PK-protection assay [10,26]. The ypt7Δ and pep4Δprb1Δ cells served as controls for closed APs outside vacuoles and closed ABs inside vacuoles, respectively. A-B. Performing the conventional PK-protection assay combined with immunoblotting analysis showed that GFP-Atg8 (A) or prApe1 (B) on AP-related membrane structures (pellet) isolated from vps21Δ and vps21Δpep4Δprb1Δ cells grown under prolonged nitrogen starvation (8 h) were still sensitive to PK. The top blots in panels A-B represent pellets from cells starved in SD-N medium for 2 h, and the bottom blots represent pellets from cells starved for 8 h. Protease protection of GFP-Atg8 or prApe1 was detected when PK was added to the membranes without detergent. The levels of non-degraded GFP-Atg8 and prApe1 were quantified and are presented below the blots. C. The modified microscopy-based PK-protection assay showed that GFP-Atg8 in AP-related membrane structures isolated from vps21Δ and vps21Δpep4Δprb1Δ cells grown under prolonged nitrogen starvation (8 h) were accessible to PK. Following the steps of the conventional PK-protection assay, but the fractions were observed by fluorescence microscopy instead of immunoblotting analysis. GFP-Atg8 was not observed in particles from vps21Δ and vps21Δpep4Δprb1Δ cells when PK was added to membranes without detergent. The results for the AP-related membrane structures isolated from cells grown in SD-N medium for 8 h are presented here. The data obtained after 2 h in SD-N medium are presented in S1D Fig. Scale bars, 2 μm; arrows point to representative GFP-Atg8-positive particles. The right column indicates the total GFP-Atg8-positive dots in green numbers and particles in grey numbers from three independent experiments used for quantification in panel D. D. Quantification of the percentages of GFP-Atg8 particles protected from PK for the strains shown in panel C; >1800 DIC particles were quantified for each condition (1–2 fields × 3 replicates). The columns in panels A-B and D represent the mean, and the error bars represent the STD. ***p < 0.001.
Fig 7
Fig 7. Prb1 overexpression promoted APC entry into vacuoles in vps21Δ cells (but not in ypt1ts and ypt7Δ cells) after nitrogen starvation.
A. The accumulation of GFP-Atg8-labeled APCs in vps21Δ cells decreased after Prb1 overexpression. The indicated cells were transformed with a Prb1-expression plasmid or the empty vector (pRS415, ∅), grown to log phase, and starved in SD-N for 2 h with FM4-64 staining for 1 h before being harvested for fluorescence observations. Scale bar, 5 μm; arrows, APCs. B. Quantification of cells containing soluble GFP in their vacuoles. The percentages of cells containing diffused GFP in vacuoles in panel A were quantified and are presented as the mean +/- STD. Over 600 cells were counted for each strain. C. GFP-Atg8 degradation in vps21Δ cells increased after Prb1 overexpression. The cells were grown as described in panel A and examined for GFP-Atg8 degradation as described in Fig 1. G6PDH was detected as a loading control. D. Quantification of GFP-Atg8 degradation represented in the immunoblot shown in panel C. The quantification was performed as described in Fig 1D for GFP-Atg8 degradation and the data are presented as the mean +/- STD. P values in B and D: n.s., not significant; **p < 0.01; ***p < 0.001. The results shown represent at least two independent experiments.
Fig 8
Fig 8. Vtc4 inhibited APC entry into vacuoles in vps21Δ cells under nitrogen starvation.
A. Vtc4 depletion promoted the entry of accumulated APCs into vacuoles in vps21Δ cells under nitrogen starvation. The indicated GFP-Atg8-labeled cells were grown and examined as described in Fig 2. The four core strains incubated in SD-N medium between 0–2 h are presented on the right side. Scales bars, 5 μm; arrows, APCs. B. Quantification of the location and format of GFP signals in the four core strains represented in panel A. The percentages of cells in panel A with APCs/ABCs (left), GFP particles in vacuoles (middle), and soluble GFP in vacuoles (right) were quantified for vps21Δ, vps21Δvtc4Δ, vtc4Δ, and pep4Δ cells starved in SD-N medium for different durations. Quantification was performed as done in Fig 2B. Over 200 cells were counted for each strain.
Fig 9
Fig 9. Diploid vps21Δ/vps21Δ cells could sporulate in sporulation medium (SPO).
A. The vps21Δ/vps21Δ cells were capable of sporulation like WT/WT cells. The indicated diploid cells were grown in SD-N medium for 2 h (top), SPO for different numbers of h in the first day (middle), or SPO for days (bottom), after which PhC and GFP fluorescence images were obtained. GFP-Atg8-labeled clusters clearly accumulated in vps21Δ/vps21Δ cells in SD-N medium. Scale bars, 5 μm; arrows, APCs. B. Immunoblotting analysis of the autophagy process in the indicated diploid cells grown in SD-N medium for 2 h (left) or SPO for 3 days (right). The cells were grown as described in panel A and collected for immunoblotting analysis as described in Fig 1B. C. The percentages of cells with tetrad spores shown in panel A after sporulation proceeded for 3 and 14 days. n.s., not significant; *p < 0.05; ***p < 0.001. The results shown represent at least two independent experiments.
Fig 10
Fig 10. Diagram of the promotion of unclosed autophagosome entry into vacuoles in Vps21/Rab5- and ESCRT-mutant cells after prolonged nitrogen starvation.
The entry of unclosed double-membrane autophagosomes into vacuoles after prolonged nitrogen starvation required Vam3 and Ypt7, was negatively promoted by VTC proteins, and was associated with the vacuolar hydrolases Pep4 and Prb1. However, it remains unclear how the unclosed double-membrane autophagosomes entered vacuoles to become unclosed single-membrane structures (autophagic bodies), which are sensitive to protease digestion, and are dissociated with Atg11. It also remains unknown whether unclosed autophagosomes in WT and hydrolase-defective mutants enter vacuoles. However, the entry of unclosed autophagosomes into vacuoles in diploid Vps21-mutant cells was clearly beneficial for sporulation.

References

    1. Yang Z, Klionsky DJ. Eaten alive: a history of macroautophagy. Nat Cell Biol. 2010;12(9):814–22. doi: 10.1038/ncb0910-814 ; PubMed Central PMCID: PMC3616322. - DOI - PMC - PubMed
    1. Inoue Y, Klionsky DJ. Regulation of macroautophagy in Saccharomyces cerevisiae. Semin Cell Dev Biol. 2010;21(7):664–70. doi: 10.1016/j.semcdb.2010.03.009 ; PubMed Central PMCID: PMC2930024. - DOI - PMC - PubMed
    1. Saha S, Panigrahi DP, Patil S, Bhutia SK. Autophagy in health and disease: A comprehensive review. Biomed Pharmacother. 2018;104:485–95. doi: 10.1016/j.biopha.2018.05.007 . - DOI - PubMed
    1. Weidberg H, Shvets E, Elazar Z. Biogenesis and cargo selectivity of autophagosomes. Annu Rev Biochem. 2011;80:125–56. doi: 10.1146/annurev-biochem-052709-094552 . - DOI - PubMed
    1. Feng Y, He D, Yao Z, Klionsky DJ. The machinery of macroautophagy. Cell Res. 2014;24(1):24–41. doi: 10.1038/cr.2013.168 ; PubMed Central PMCID: PMC3879710. - DOI - PMC - PubMed

Publication types

MeSH terms

LinkOut - more resources