

Geographic variation and factors associated with under-five mortality in Ethiopia. A spatial and multilevel analysis of Ethiopian mini demographic and health survey 2019
- PMID: 36227894
- PMCID: PMC9560495
- DOI: 10.1371/journal.pone.0275586
Geographic variation and factors associated with under-five mortality in Ethiopia. A spatial and multilevel analysis of Ethiopian mini demographic and health survey 2019
Abstract
Background: The distribution of under-five mortality (U5M) worldwide is uneven and the burden is higher in Sub-Saharan African countries, which account for more than 53% of the global under-five mortality. In Ethiopia, though U5M decreased substantially between 1990 and 2019, it remains excessively high and unevenly distributed. Therefore, this study aimed to assess geographic variation and factors associated with under-five mortality (U5M) in Ethiopia.
Methods: We sourced data from the most recent nationally representative 2019 Ethiopian Mini-Demographic and Health Survey for this study. A sample size of 5,695 total births was considered. Descriptive, analytical analysis and spatial analysis were conducted using STATA version 16. Both multilevel and spatial analyses were employed to ascertain the factors associated with U5M in Ethiopia.
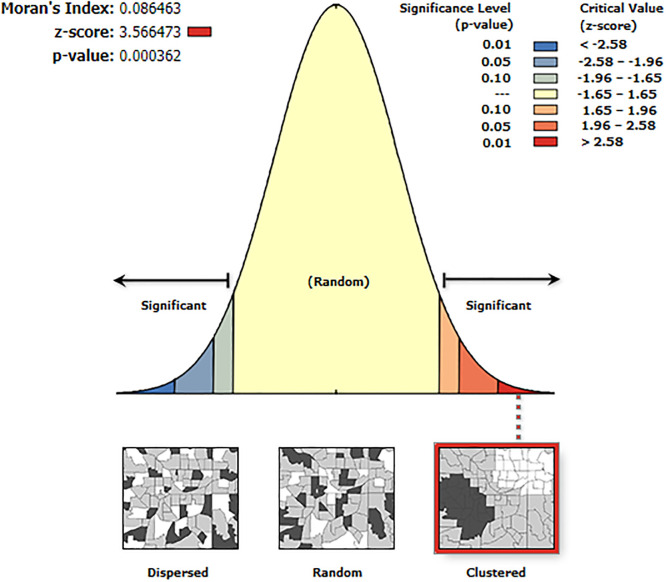
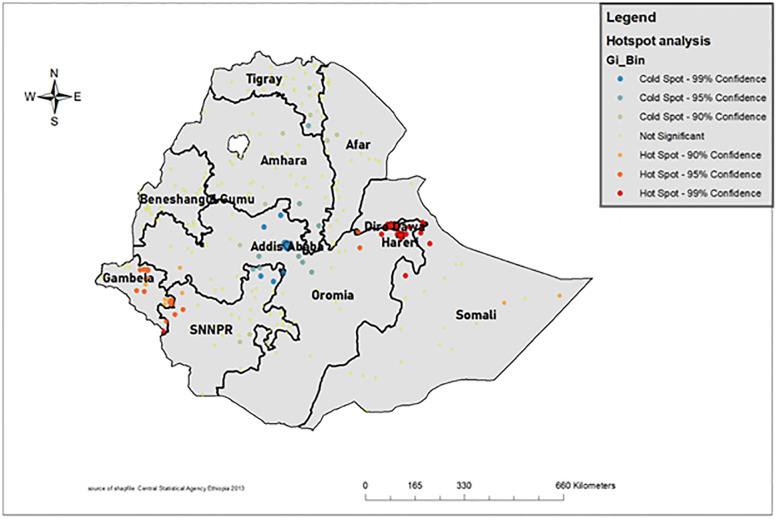
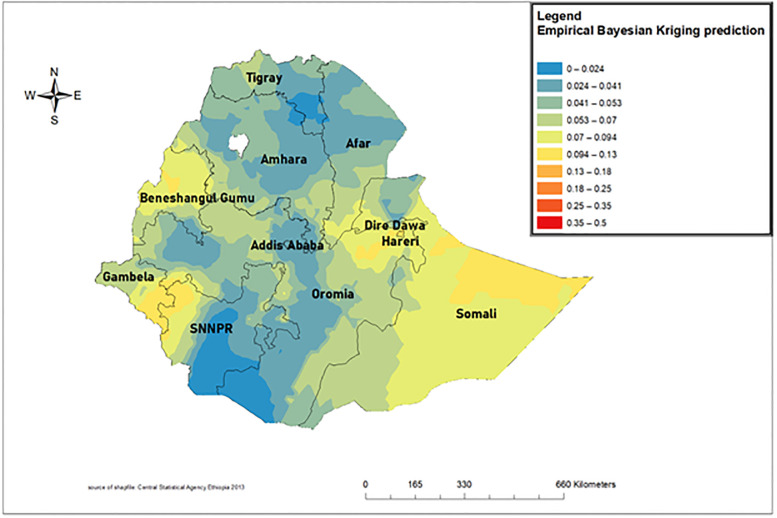
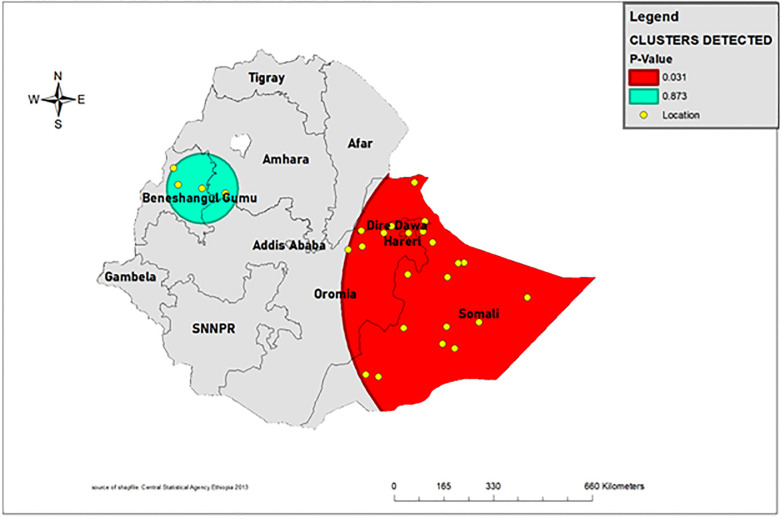
Results: The U5M was 5.9% with a 95% CI 5.4% to 6.6%. Based on the multivariable multilevel logistic regression model results, the following characteristics were associated with under-five mortality: family size (AOR = 0.92, 95% CI: 0.84,0.99), number of under-five children in the family (AOR = 0.17, 95% CI: 0.14, 0.21), multiple birth (AOR = 14.4, 95% CI: 8.5, 24.3), children who were breastfed for less than 6 months (AOR = 5.04, 95% CI: 3.81, 6.67), people whose main roof is palm (AOR = 0.57, 95% CI: 0.34, 0.96), under-five children who are the sixth or more child to be born (AOR = 2.46, 95% CI: 1.49, 4.06), institutional delivery (AOR = 0.57, 95% CI: 0.41, 0.81), resident of Somali and Afar region (AOR = 3.46, 95% CI: 1.58, 7.55) and (AOR = 2.54, 95% CI: 1.10, 5.85), respectively. Spatial analysis revealed that hot spot areas of under-five mortality were located in the Dire Dawa and Somali regions.
Conclusion: Under-five mortality in Ethiopia is high and unacceptable when compared to the 2030 sustainable development target, which aims for 25 per 1000 live births. Breastfeeding for less than 6 months, twin births, institutional delivery and high-risk areas of under-five mortality (Somali and Dire Dawa) are modifiable risk factors. Therefore, maternal and community education on the advantages of breastfeeding and institutional delivery is highly recommended. Women who deliver twins should be given special attention. An effective strategy should be designed for intervention in under-five mortality hot spot areas such as Somali and Dire Dawa.
Conflict of interest statement
The authors have declared that no competing interests exist.
Figures
Similar articles
-
Individual and community-level determinants, and spatial distribution of institutional delivery in Ethiopia, 2016: Spatial and multilevel analysis.PLoS One. 2020 Nov 12;15(11):e0242242. doi: 10.1371/journal.pone.0242242. eCollection 2020. PLoS One. 2020. PMID: 33180845 Free PMC article.
-
Geographic variation and associated factors of long-acting contraceptive use among reproductive-age women in Ethiopia: a multi-level and spatial analysis of Ethiopian Demographic and Health Survey 2016 data.Reprod Health. 2021 Jun 10;18(1):122. doi: 10.1186/s12978-021-01171-2. Reprod Health. 2021. PMID: 34112194 Free PMC article.
-
Spatial distribution of short birth interval and associated factors among reproductive age women in Ethiopia: spatial and multilevel analysis of 2019 Ethiopian mini demographic and health survey.BMC Pregnancy Childbirth. 2023 Apr 22;23(1):275. doi: 10.1186/s12884-023-05610-9. BMC Pregnancy Childbirth. 2023. PMID: 37087447 Free PMC article.
-
Applied nutritional investigation spatial variation and determinants of stunting among children aged less than 5 y in Ethiopia: A spatial and multilevel analysis of Ethiopian Demographic and Health Survey 2019.Nutrition. 2022 Nov-Dec;103-104:111786. doi: 10.1016/j.nut.2022.111786. Epub 2022 Jul 1. Nutrition. 2022. PMID: 35970098 Review.
-
Prevalence and risk factors of type-2 diabetes mellitus in Ethiopia: systematic review and meta-analysis.Sci Rep. 2021 Nov 5;11(1):21733. doi: 10.1038/s41598-021-01256-9. Sci Rep. 2021. PMID: 34741064 Free PMC article.
Cited by
-
Inequalities of Infant Mortality in Ethiopia.Int J Environ Res Public Health. 2023 Jun 6;20(12):6068. doi: 10.3390/ijerph20126068. Int J Environ Res Public Health. 2023. PMID: 37372655 Free PMC article.
-
Child health outcomes and associated factors among under five years children in Ethiopia: a population attributable fractions analysis of Ethiopia demographic and health survey (2005-2016).BMC Pediatr. 2024 Sep 4;24(1):560. doi: 10.1186/s12887-024-05019-z. BMC Pediatr. 2024. PMID: 39232700 Free PMC article.
-
Geographical equity in Ethiopian infant feeding practices: a secondary analysis of a birth cohort study.BMJ Open. 2025 Jan 2;15(1):e088762. doi: 10.1136/bmjopen-2024-088762. BMJ Open. 2025. PMID: 39753250 Free PMC article.
-
Spatiotemporal modeling of under-five mortality and associated risk factors in Ethiopia using 2000-2016 EDHS data.BMC Pediatr. 2024 Mar 21;24(1):201. doi: 10.1186/s12887-024-04676-4. BMC Pediatr. 2024. PMID: 38515055 Free PMC article.
References
-
- Croft T, Marshall A, Allen C. Guide to DHS statistics. Rockville: ICF; 2018. 2018.
-
- Ezbakhe F, Pérez-Foguet A. Child mortality levels and trends. Demographic Research. 2020;43:1263–96.
-
- Johnston R. Arsenic and the 2030 Agenda for sustainable development. Arsen Res Glob Sustain-Proc 6th Int Congr Arsen Environ AS. 2016;2016:12–4.
-
- Li Z, Hsiao Y, Godwin J, Martin BD, Wakefield J, Clark SJ, et al.. Changes in the spatial distribution of the under-five mortality rate: Small-area analysis of 122 DHS surveys in 262 subregions of 35 countries in Africa. PloS one. 2019;14(1):e0210645. doi: 10.1371/journal.pone.0210645 - DOI - PMC - PubMed
MeSH terms
LinkOut - more resources
Full Text Sources
