. 2022 Oct 18;119(42):e2200108119.
doi: 10.1073/pnas.2200108119. Epub 2022 Oct 13.

Molecular convergence by differential domain acquisition is a hallmark of chromosomal passenger complex evolution

Affiliations

Molecular convergence by differential domain acquisition is a hallmark of chromosomal passenger complex evolution

Shinichiro Komaki et al. Proc Natl Acad Sci U S A. .

Abstract

The chromosomal passenger complex (CPC) is a heterotetrameric regulator of eukaryotic cell division, consisting of an Aurora-type kinase and a scaffold built of INCENP, Borealin, and Survivin. While most CPC components are conserved across eukaryotes, orthologs of the chromatin reader Survivin have previously only been found in animals and fungi, raising the question of how its essential role is carried out in other eukaryotes. By characterizing proteins that bind to the Arabidopsis Borealin ortholog, we identified BOREALIN RELATED INTERACTOR 1 and 2 (BORI1 and BORI2) as redundant Survivin-like proteins in the context of the CPC in plants. Loss of BORI function is lethal and a reduced expression of BORIs causes severe developmental defects. Similar to Survivin, we find that the BORIs bind to phosphorylated histone H3, relevant for correct CPC association with chromatin. However, this interaction is not mediated by a BIR domain as in previously recognized Survivin orthologs but by an FHA domain, a widely conserved phosphate-binding module. We find that the unifying criterion of Survivin-type proteins is a helix that facilitates complex formation with the other two scaffold components and that the addition of a phosphate-binding domain, necessary for concentration at the inner centromere, evolved in parallel in different eukaryotic groups. Using sensitive similarity searches, we find conservation of this helical domain between animals and plants and identify the missing CPC component in most eukaryotic supergroups. Interestingly, we also detect Survivin orthologs without a defined phosphate-binding domain, likely reflecting the situation in the last eukaryotic common ancestor.

Keywords: cell division; evolution; microtuble cytoskeleton.


Conflict of interest statement

The authors declare no competing interest.

Figures

Fig. 1.
Fig. 1.
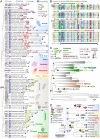
BOREALIN RELATED INTERACTOR (BORI) genes in plants. (A) The CPC consists of an Aurora-type kinase scaffolded by the triple helix-based trimer INCENP, Borealin, and Survivin. Metaphase CPC localization at the centromere is dependent on a Survivin–H3T3ph interaction and anaphase localization at the central spindle relies on interactions with microtubules and kinesins. (B) Presence–absence matrix of CPC components in model organisms that have previously been found throughout the eukaryotic tree of life (2, 19). Colors: similar to A. Numbers: paralog amount. Question mark: inability to detect orthologs. Gray circles: loss of components. (C) Multiple alignment of Borealin Related Interactor 1 and 2 found in Arabidopsis thaliana. FHA (yellow); C-terminal helix (dark blue). Secondary structure consensus of the Alphafold2 predicted 3D structures of BORI1-2 is projected below the alignment. Stars: three arginine residues (ARG-15-32-35), which likely face the phosphorylated histone H3 tail (see ball-and-sticks representation in D). Color scheme: 100% identity (black), similar physicochemical properties (gray), others (white). (D) Unrooted maximum-likelihood phylogenetic tree of FHA domains most similar to BORI orthologs in prokaryotes and eukaryotes. Branch lengths (scaled; number of substitutions per site). Circles: bootstrap support (1,000× replicates, only higher than 80% support shown). Red squares: duplication nodes. Right: AthaBORI1 and 2 Alphafold2-predicted 3D structures, with putative phosphate-interacting residues in ball-and-sticks representation (see also C). Colors: FHA (yellow); helix (blue). See Dataset S2 for full-length 3D structures. For phylogenetic analysis details see Dataset S3.
Fig. 2.
Fig. 2.
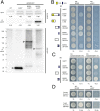
Interaction between Survivin, BORIs, and BORR. (A) Co-IP of BORIs and BORR. Seven-day-old Arabidopsis seedlings expressing BORR:RFP and BORI1:mGFP or BORR:RFP and BORI2:mGFP were used for IP with an anti-GFP antibody. Both input and IP fractions were subjected to immunoblotting with an anti-RFP antibody to detect BORR:RFP. The relative intensity of the band signal (input fraction of mGFP = 1.00) is shown at the bottom. IP fractions were also subjected to immunoblotting with an anti-GFP antibody to detect GFP-tagged fusion proteins. Seedlings expressing both BORR:RFP and mGFP as well as wild-type (WT) seedlings were used as negative controls. The asterisk indicates a nonspecific band. Arrowheads indicate GFP-tagged fusion proteins. (BD) Identification of the interaction domain between Survivin, BORIs, and BORR by yeast two-hybrid assay. Each strain was spotted on SD plates without Trp and Leu (−TL; control media) or without Trp, Leu, and His (−TLH; selection media) and photographed after incubation at 30 °C for 2 d (B and D) or for 3 d (C). AD, GAL4-activation domain. BD, GAL4-DNA binding domain. mGFP was used as a negative control.
Fig. 3.
Fig. 3.
The FHA domain of BORIs directly binds to H3T3ph. (A) Multiple sequence alignment of the H3 N terminus in different species showing conservation of threonine 3 and 11 (T3, T11). Histone H3 polypeptides are typically numbered with omission of the N-terminal methionine, since it is likely removed cotranslationally (58, 59). Therefore, the initiator Met has not been included in the peptides used in the in vitro assays in C. (B) Co-IP of BORIs and Histone H3. Seven-day-old Arabidopsis seedlings expressing BORI1:mGFP or BORI2:mGFP were used for IP with an anti-GFP antibody. Both input and IP fractions were subjected to immunoblotting with an anti-Histone H3 antibody. Seedlings expressing mGFP and wild-type (WT) seedlings were used as negative controls. (C) Peptide-binding assay. All peptides were biotinylated at the C terminus and were preincubated with streptavidin-coated beads before addition of FHA domains. Protein binding was subjected to immunoblotting with an anti-GFP antibody. A GST-fusion of human Survivin and GST alone were used as positive and negative controls, respectively. (D) Relative band intensities comparing H31-21T3ph and H31-21 in B were calculated. Data shown represent three independent experiments.
Fig. 4.
Fig. 4.
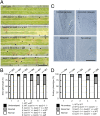
Mutants in BORI exhibit defects in embryo development. (A) Developing seeds in a silique resulting from reciprocal crosses between bori mutants and the wild type (WT). Arrowheads indicate aborted seeds. (Scale bar, 1 cm.) (B) Frequency of seed phenotypes shown in each cross. (C) Embryo phenotypes observed in bori mutants. Whole-mount clearing was conducted 4 d after the pollination. (Scale bar, 100 μm.) (D) Frequency of embryo phenotypes shown in each cross.
Fig. 5.
Fig. 5.
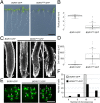
Phenotypic analysis of amiRNA-mediated BORI knockdown plants. (A) Seven-day-old wild-type (WT) and BORI knockdown seedlings. (Scale bar, 1 cm.) (B) Root length of 7-d-old WT and BORI knockdown seedlings. Graph bars represent means ± SD. Asterisks indicate significant difference between the WT and BORI knockdown seedlings tested by Student’s t test (**P < 0.001, n = 30). (C) Confocal images of 7-d-old WT and BORI knockdown roots stained with 20 μg/mL propidium iodide to visualize cell walls and dead cells. Arrowheads indicate the boundary between the division region and the elongation region of the root. (Scale bar, 100 μm.) (D) Cell death area in C. Asterisks indicate significant difference between WT and BORI knockdown seedlings tested by Student’s t test (*P < 0.01, **P < 0.001, n = 20). (E) Meristem size in C. Meristem size was measured from quiescent center to the first elongated cell in the cortical cell file. Asterisks indicate significant difference between WT and BORI knockdown seedlings tested by Student’s t test (**P < 0.001, n = 20). (F) Number of meristematic cortex cells in C. Asterisks indicate significant difference between WT and BORI knockdown seedlings tested by Student’s t test (**P < 0.001, n = 20). (G) Representative images of normally distributed and lagging chromosomes in 5-d-old WT and BORI knockdown roots. Microtubules and centromeres were visualized by RFP:TUA5 and GFP:CENH3, respectively. Arrowheads indicate lagging chromosomes. (Scale bar, 5 μm.) (H) Frequency of lagging chromosomes in anaphase cells in G. n = 50. (I) Representative images of AUR3 accumulation levels at metaphase centromeres in 5-d-old WT and BORI knockdown roots. Microtubules and AUR3 were visualized by RFP:TUA5 and AUR3:GFP, respectively. (Scale bar, 5 μm.) (J) AUR3 signal intensity in I. AUR3:GFP signals at metaphase centromeres were measured. Asterisks indicate significant difference between WT and BORI knockdown roots tested by Student’s t test (**P < 0.001, n = 50). (K) Representative images of AUR3 accumulation levels at the middle part of the phragmoplast in 5-d-old WT and BORI knockdown roots. Microtubules and AUR3 were visualized by RFP:TUA5 and AUR3:GFP, respectively. (Scale bar, 5 μm.) (L) AUR3 signal intensity in K. AUR3:GFP signals at the middle part of the phragmoplast were measured. Asterisks indicate significant difference between WT and BORI knockdown roots tested by Student’s t test (**P < 0.001, n = 10).
Fig. 6.
Fig. 6.
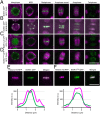
Subcellular localization of BORI1 during the cell cycle. (A) Subcellular localization of BORI1:GFP during the cell cycle. Microtubule structures were visualized by RFP:TUA5. (B) Colocalization of BORI1:GFP and BORR:RFP. (C and D) Subcellular localization of BORI1_N:GFP (C) or BORI1R3A:GFP (D) during the cell cycle. Microtubule structures were visualized by RFP:TUA5. For live imaging, root tips of 5-d-old seedlings were used. (Scale bar, 10 μm.) (E and F) Colocalization of Histone H3:RFP and BORI1:GFP (E) or BORI1R3A:GFP (F) in metaphase cells. The yellow dotted line indicates the positions where the line profiles were obtained. (Scale bar, 10 μm.).
Fig. 7.
Fig. 7.
Proper centromere localization of BORIs is required for genome stability. (A) Seven-day-old transgenic lines expressing BORI1:GFP or BORI1R3A:GFP in bori1 bori2. (Scale bar, 1 cm.) (B) Root length of 7-d-old transgenic seedlings. Graph bars represent means ± SD. Asterisks indicate significant difference tested by Student’s t test (**P < 0.001, n = 30). (C) Confocal images of 7-d-old BORI1:GFP and BORI1R3A:GFP seedling roots stained with 20 μg/mL propidium iodide to visualize cell walls and dead cells. (Scale bar, 100 μm.) (D) Cell death area in C. Asterisks indicate significant difference tested by Student’s t test (**P < 0.001, n = 20). (E) GFP signals in interphase cells of BORI1:GFP and BORI1R3A:GFP seedling roots. (Scale bar, 5 μm.) (F) Number of chromosomes in interphase cells of BORI1:GFP and BORI1R3A:GFP seedling roots (n = 50).
Fig. 8.
Fig. 8.
A conserved helix and the recurrent acquisition of a phosphate-binding domain characterize the divergent Survivin/BORI gene family. (A) Presence–absence matrix of the four subunits of the CPC: Aurora kinase, INCENP, Borealin, and Survivin/BORI found across different eukaryotic supergroups [according to Burki et al. (60)]. Dashed lines indicate uncertain relationships among supergroups. LECA refers to the position of the last eukaryotic common ancestor. Numbers indicate paralog count. Domain topologies for Survivin/BORI on the right, with a conserved helix (blue) as the defining feature of this gene family. Different colored FHA domains indicate a unique evolutionary origin found in Survivin/BORI orthologs in different eukaryotes. (B) Multiple alignment of a conserved helix found in four subtypes of Survivin/BORI orthologs. Four-letter abbreviations refer to species that can be found in A. Numbers on the right indicate the position of the C terminus of a 47-residue-long helix. (C) Collapsed and unrooted maximum-likelihood phylogenetic tree of eukaryotic and prokaryotic FHA domains most similar to BORI, and Survivin/BORI-like proteins found among Archaeplastida, SAR, and Haptista. Representative domains for each collapsed clade are projected. Branch lengths are scaled (number of substitutions per site). Circles indicate bootstrap support (1,000× replicates, only higher than 80% support shown). Colors indicate diverse evolutionary histories of various domains (e.g., FHA of KAPPs and BORIs). For phylogenetic analysis details see Dataset S4. (D) Evolutionary scenario of the Survivin/BORI gene family. An helix-only Survivin/BORI was present in LECA and independently fused to a phosphate-binding domain at least three different times during eukaryotic evolution, in the ancestors of Fungi and Metazoa (1:BIR), SAR and Haptista (2:C-terminal FHA), and Viridiplantae (3:N-terminal FHA). FHA domains were laterally transferred from Deltaproteobacteria. Colors are similar to A and C.

Similar articles

Cited by

References

    1. Motta M. R., Schnittger A., A microtubule perspective on plant cell division. Curr. Biol. 31, R547–R552 (2021). - PubMed
    1. Tromer E. C., van Hooff J. J. E., Kops G. J. P. L., Snel B., Mosaic origin of the eukaryotic kinetochore. Proc. Natl. Acad. Sci. U.S.A. 116, 12873–12882 (2019). - PMC - PubMed
    1. Musacchio A., Desai A., A molecular view of kinetochore assembly and function. Biology (Basel) 6, 5 (2017). - PMC - PubMed
    1. Müller S., Jürgens G., Plant cytokinesis-No ring, no constriction but centrifugal construction of the partitioning membrane. Semin. Cell Dev. Biol. 53, 10–18 (2016). - PubMed
    1. Brown J. R., Koretke K. K., Birkeland M. L., Sanseau P., Patrick D. R., Evolutionary relationships of Aurora kinases: Implications for model organism studies and the development of anti-cancer drugs. BMC Evol. Biol. 4, 39 (2004). - PMC - PubMed

Publication types

LinkOut - more resources