

Comprehensive analyses reveal the role of histone deacetylase genes in prognosis and immune response in low-grade glioma
- PMID: 36227941
- PMCID: PMC9560174
- DOI: 10.1371/journal.pone.0276120
Comprehensive analyses reveal the role of histone deacetylase genes in prognosis and immune response in low-grade glioma
Abstract
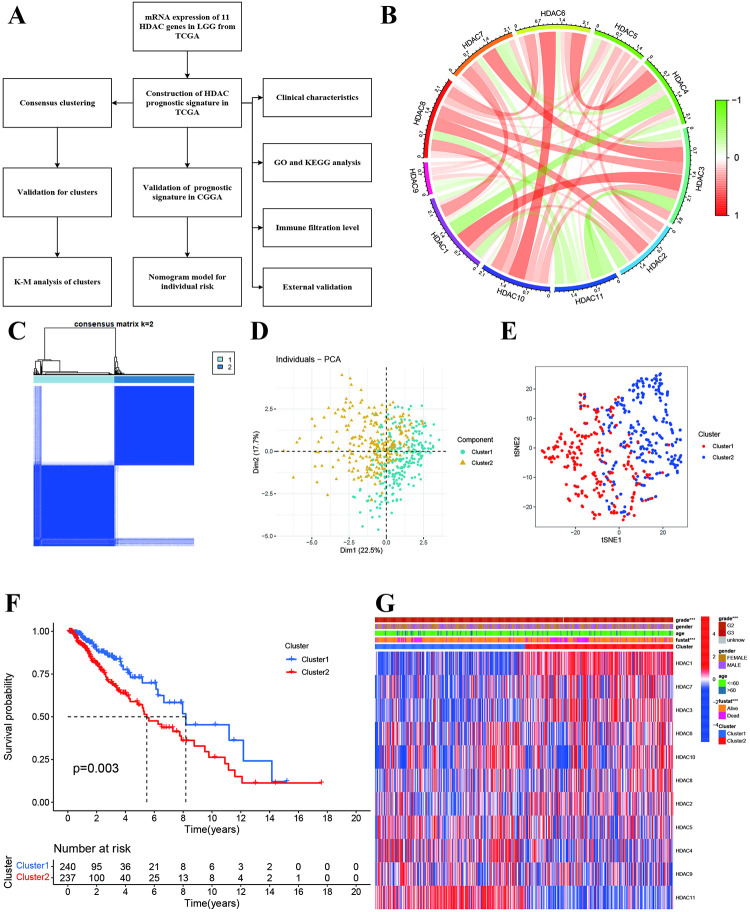
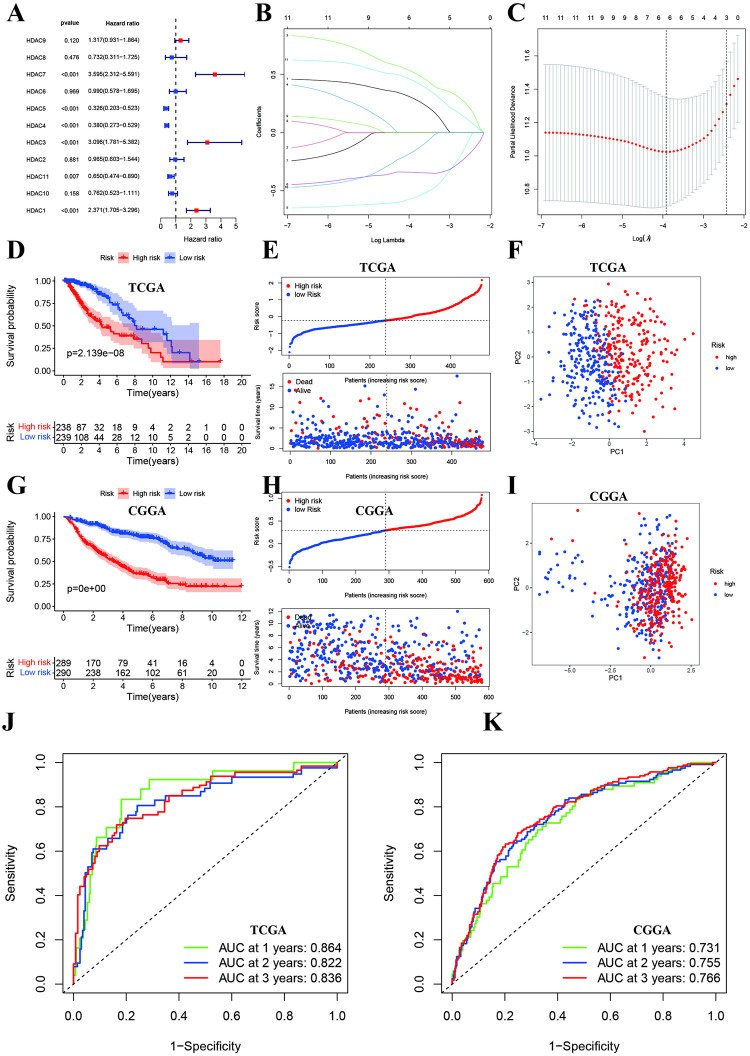
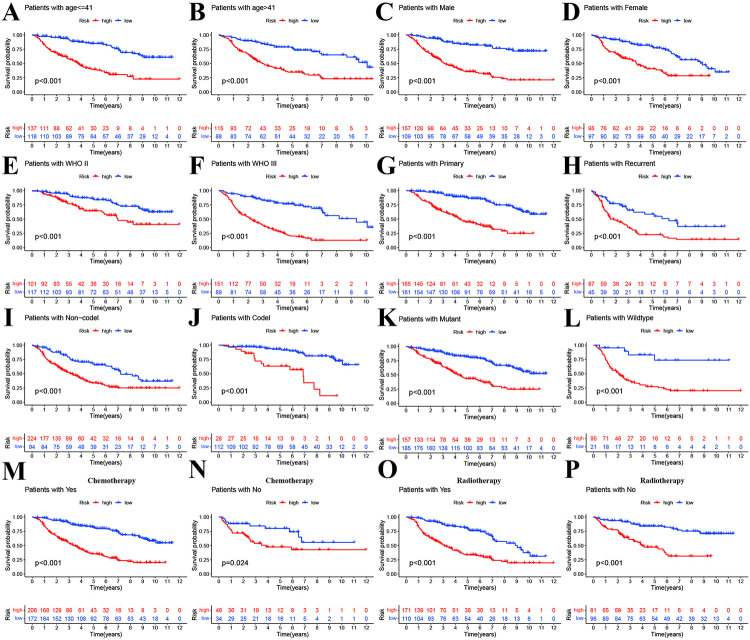
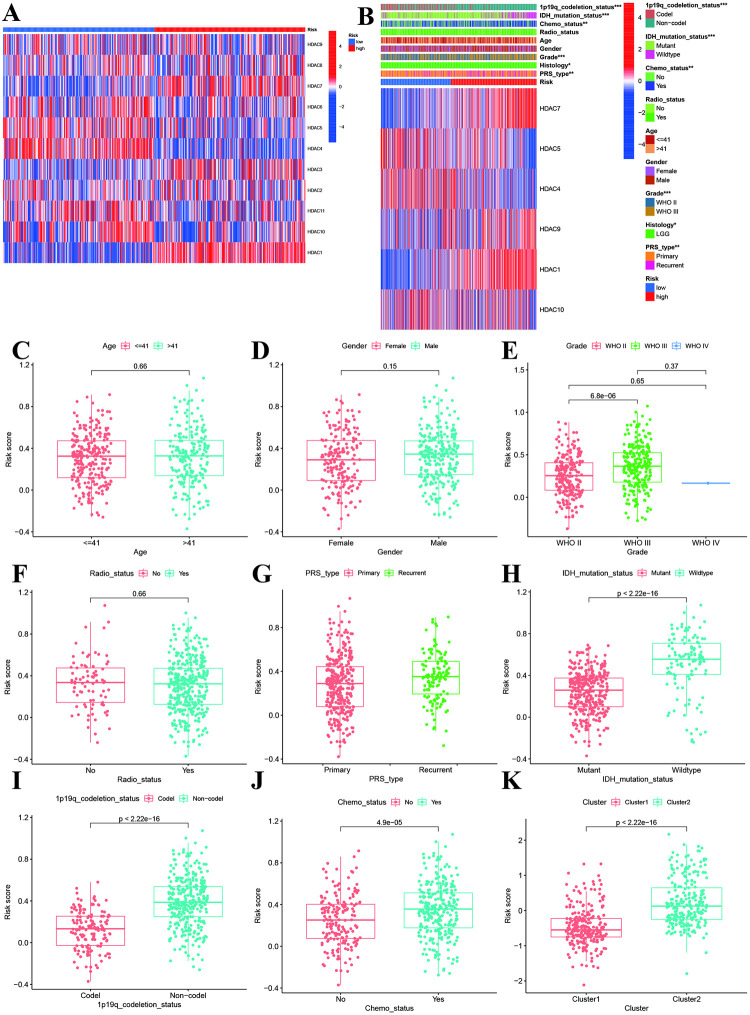
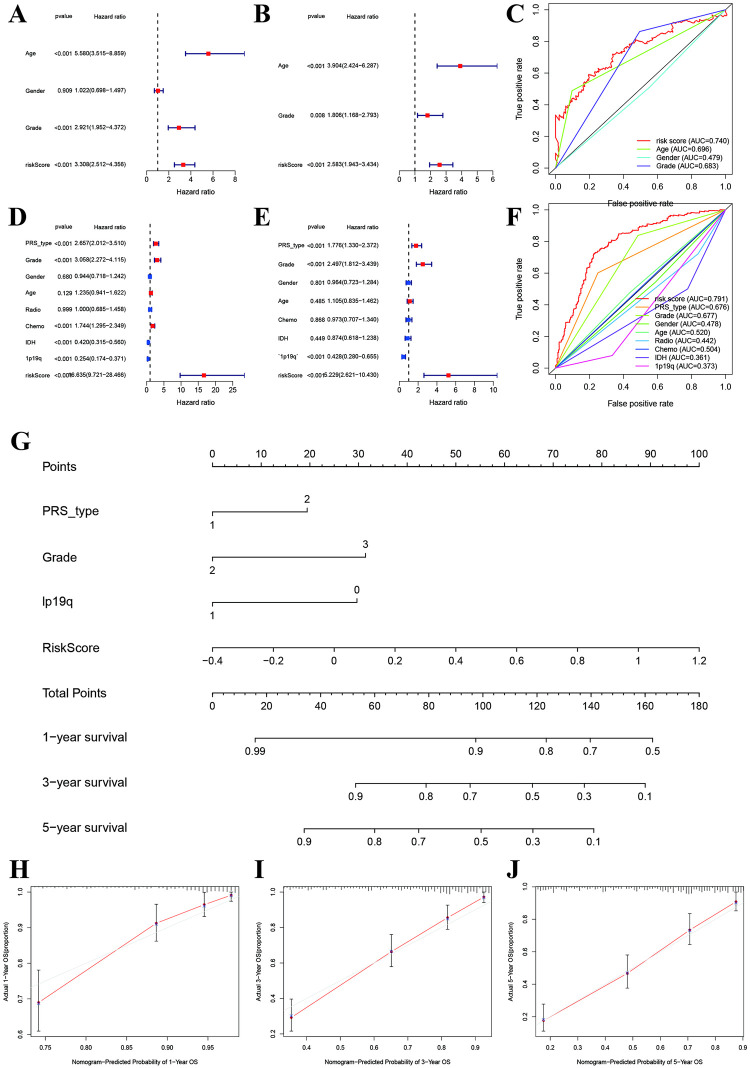
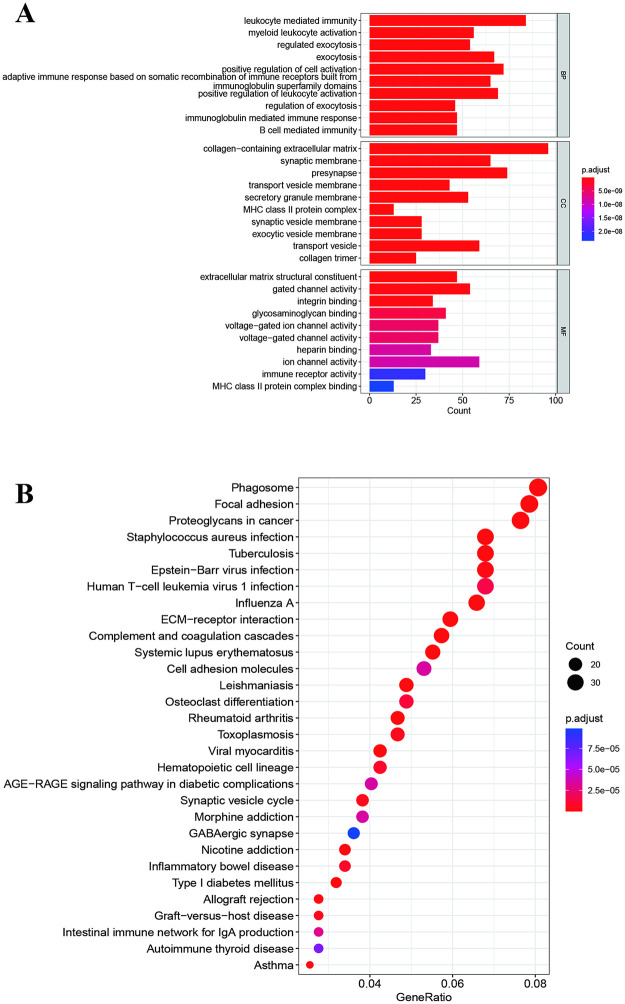
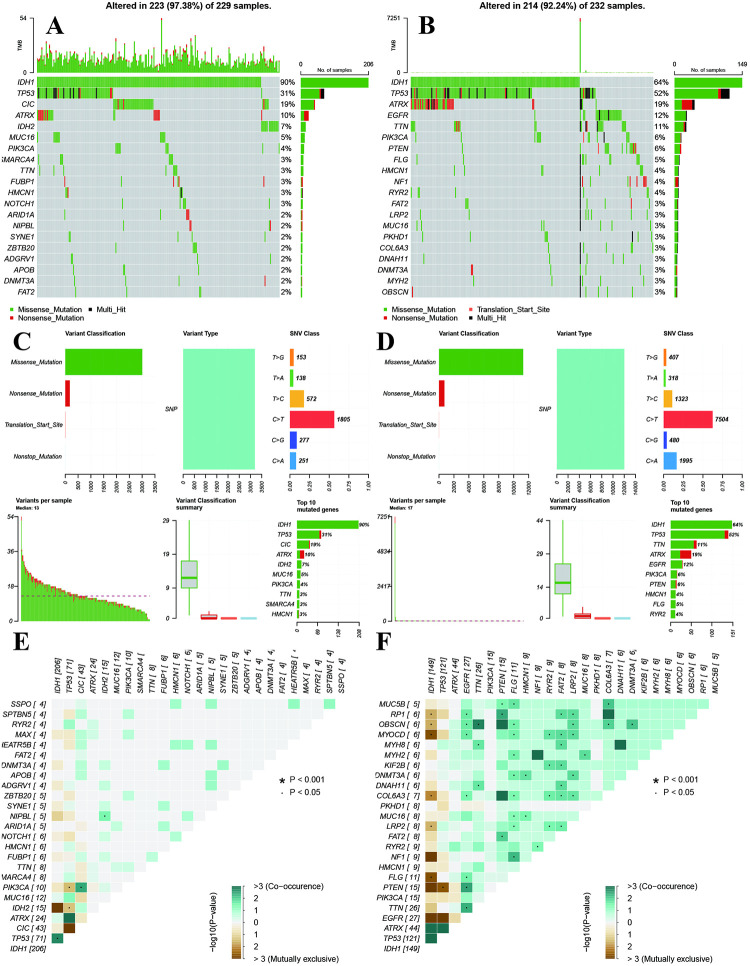
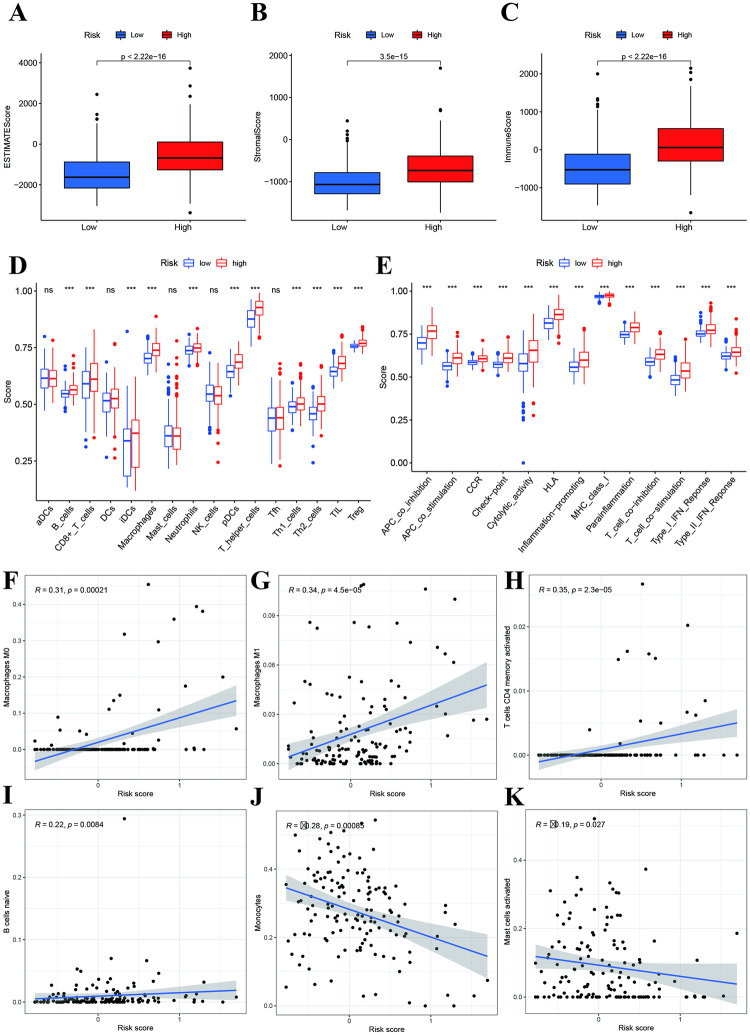
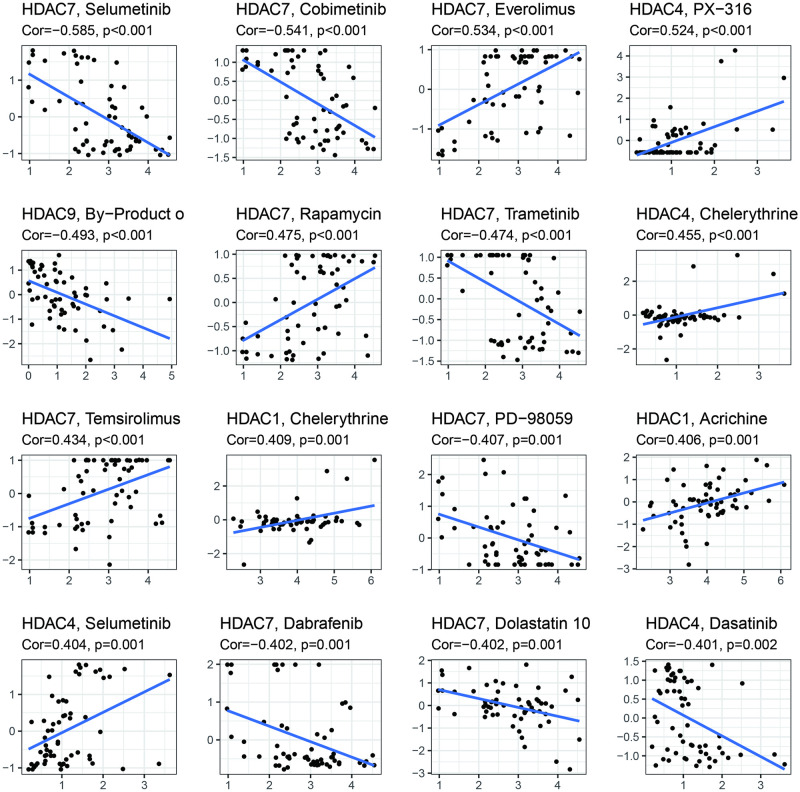
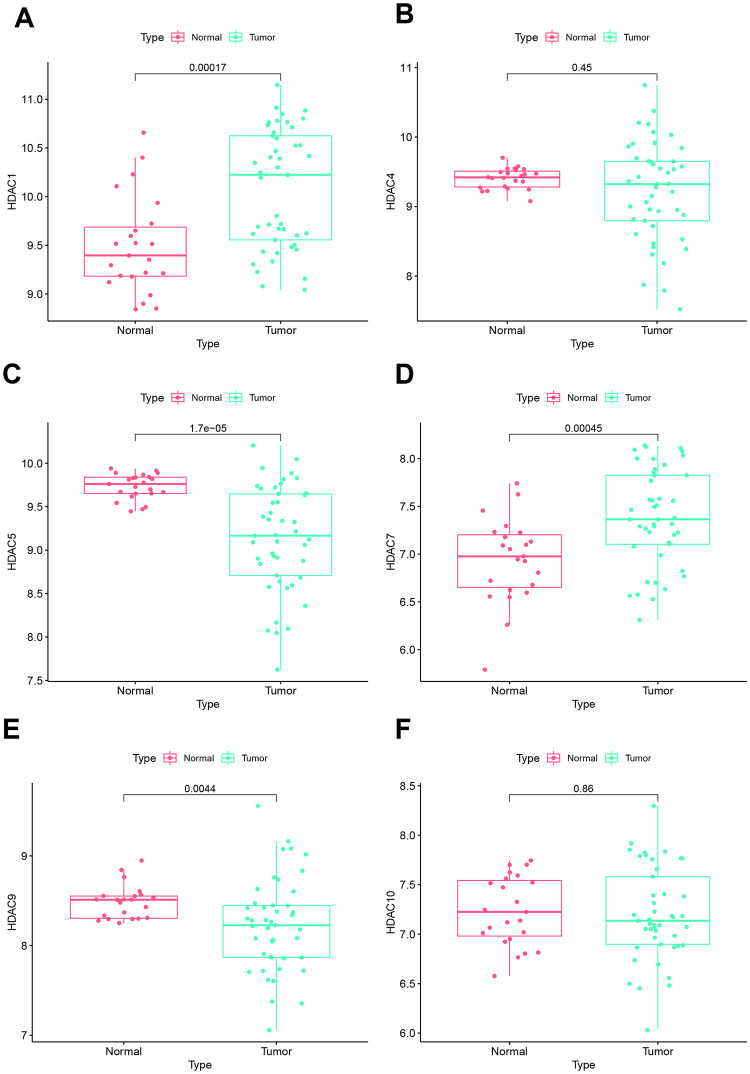
Many studies have shown that Histone deacetylases (HDAC) is involved in the occurrence of malignant tumors and regulates the occurrence, proliferation, invasion, and migration of malignant tumors through a variety of signaling pathways. In the present, we explored the role of Histone deacetylases genes in prognosis and immune response in low-grade glioma. Using consensus clustering, we built the new molecular clusters. Using HDAC genes, we constructed and validated the prognostic model in two independent cohort datasets. Patients were divided into high-risk and low-risk groups. Then, we explored the molecular characteristics, clinical characteristics, tumor microenvironment and immune infiltration levels of two clusters and risk groups. Receiver operating characteristic analyses were built for model assessment. We finally detected the expression levels of signature genes between tumor and normal tissues. Low-grade can be separated into two molecular clusters using 11 HDACs genes. Two clusters had different clinical characteristics and prognosis. Nex, we constructed a prognosis model using six HDAC genes (HDAC1, HDAC4, HDAC5, HDAC7, HDAC9, and HDAC10), which was also validated in an independent cohort dataset. Furthermore, multivariate cox regression indicated that the calculated risk score was independently associated with prognosis in low-grade glioma, and risk score can predict the five-year survival probability of low-grade glioma well. High-risk patients can be attributed to multiple complex function and molecular signaling pathways, and the genes alterations of high- and low-risk patients were significantly different. We also found that different survival outcomes of high- and low- risk patients could be involved in the differences of immune filtration level and tumor microenvironment. Subsequently, using signature genes, we identified several small molecular compounds that could be useful for low-grade glioma patients' treatment. Finally, we detected the expression levels of signature genes in tumor tissues. our study uncovers the biology function role of HDAC genes in low-grade glioma. We identified new molecular subtypes and established a prognostic model based on six HDAC genes, which was well applied in two independent cohort data. The regulation of HDAC genes in low-grade glioma involved in multiple molecular function and signaling pathways and immune infiltration levels. Further experiments in vivo and vitro were required to confirm the present findings.
Conflict of interest statement
The authors have declared that no competing interests exist.
Figures
Similar articles
-
Comprehensive analysis of histone deacetylases genes in the prognosis and immune infiltration of glioma patients.Aging (Albany NY). 2022 May 11;14(9):4050-4068. doi: 10.18632/aging.204071. Epub 2022 May 11. Aging (Albany NY). 2022. PMID: 35545840 Free PMC article.
-
Comprehensive Analysis of HDAC Family Identifies HDAC1 as a Prognostic and Immune Infiltration Indicator and HDAC1-Related Signature for Prognosis in Glioma.Front Mol Biosci. 2021 Sep 1;8:720020. doi: 10.3389/fmolb.2021.720020. eCollection 2021. Front Mol Biosci. 2021. PMID: 34540896 Free PMC article.
-
Pan-cancer analysis of the transcriptional expression of histone acetylation enzymes in solid tumors defines a new classification scheme for gliomas.Front Immunol. 2025 Jan 21;15:1523034. doi: 10.3389/fimmu.2024.1523034. eCollection 2024. Front Immunol. 2025. PMID: 39906742 Free PMC article.
-
Research Progress on the Mechanism of Histone Deacetylases in Ferroptosis of Glioma.Oncol Rev. 2024 Aug 12;18:1432131. doi: 10.3389/or.2024.1432131. eCollection 2024. Oncol Rev. 2024. PMID: 39193375 Free PMC article. Review.
-
Targeting the Complement Pathway in Malignant Glioma Microenvironments.Front Cell Dev Biol. 2021 Apr 1;9:657472. doi: 10.3389/fcell.2021.657472. eCollection 2021. Front Cell Dev Biol. 2021. PMID: 33869223 Free PMC article. Review.
Cited by
-
Machine learning-based identification of histone deacetylase-associated prognostic factors and prognostic modeling for low-grade glioma.Discov Oncol. 2024 Dec 23;15(1):824. doi: 10.1007/s12672-024-01713-7. Discov Oncol. 2024. PMID: 39714729 Free PMC article.
References
Publication types
MeSH terms
Substances
LinkOut - more resources
Full Text Sources
Miscellaneous
