. 2022 Oct 13;17(10):e0276177.
doi: 10.1371/journal.pone.0276177. eCollection 2022.

Risk perception and subsidy policy-based voluntary vaccination driven by multiple information sources

Affiliations

Risk perception and subsidy policy-based voluntary vaccination driven by multiple information sources

Bing Wang et al. PLoS One. .

Abstract

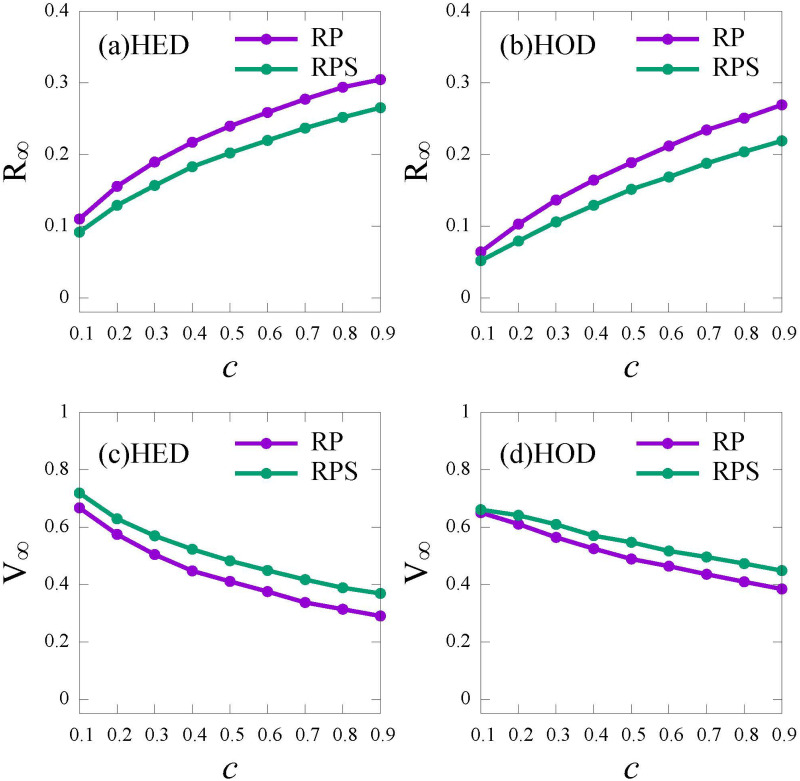
Exploring vaccination behavior is fundamental to understand the role of vaccine in suppressing the epidemic. Motivated by the efficient role of the risk perception and the subsidy policy in promoting vaccination, we propose the Risk Perception and the Risk Perception with Subsidy Policy voluntary vaccination strategies with imperfect vaccine. The risk perception is driven by multiple information sources based on global information (released by Public Health Bureau) and local information (from first-order neighbors). In time-varying networks, we use the mean-field approach and the Monte Carlo simulations to analyze the epidemic dynamics under vaccination behavior with imperfect vaccine. We find that vaccination with the incorporation of risk perception and subsidy policy can effectively control the epidemic. Moreover, information from different sources plays different roles. Global information is more helpful in promoting vaccination than local information. In addition, to further understand the influence of vaccination strategies, we calculate the social cost as the cost for the vaccine and treatment, and find that excess vaccination cost results in a higher social cost after the herd immunity. Thus, for balancing the epidemic control and social cost, providing individuals with more global information as well as local information would be helpful in vaccination. These results are expected to provide insightful guidance for designing the policy to promote vaccination.


Conflict of interest statement

The authors have declared that no competing interests exist.

Figures

Fig 1
Fig 1. Schematic representation of the SEVAIR model.
The arrows indicate the transition probabilities. Susceptible (S) individuals take vaccines with probability pa(t), and the susceptible (S) individuals who do not vaccinate will turn to exposed (E) state at transmission rate λ (ωλ), when contacting with symptomatic (I) (asymptomatic (A)) individuals. Vaccinated (V) individuals return to the susceptible individuals (S) at rate δ, and will be infected by contacting symptomatic (I) (asymptomatic (A)) individuals with an infection rate αλ (αωλ). After an incubation period 1η, exposed (E) individuals become infectious, while the ratio of asymptomatic individuals from exposed individuals is ρ with ρ ∈ [0, 1]. Both the asymptomatic (A) individuals and infected (I) individuals recover at rate μ.
Fig 2
Fig 2. Schematic representation of the Risk Perception (RP) vaccination strategy under different information sources.
Individuals decide to be vaccinated by calculating the payoffs with or without vaccination based on infection risk perception, where the infection risk is perceived by global information released by Public Health Bureau or local information from first-order neighbors. (a) The information sources obtained by individuals is used to perceive the infection risk; (b) Evaluation of payoffs for unvaccinated and that of vaccinated individuals at time t; (c) Individuals determine to take the vaccinate or not.
Fig 3
Fig 3. Schematic representation of the Risk Perception with Subsidy Policy (RPS) vaccination strategy under different information sources.
Individuals decide to be vaccinated by calculating the payoffs with or without vaccination based on both infection risk perception and subsidy policy. The infection risk is perceived by the epidemic severity formulated by the information, which is classified as global information released by Public Health Bureau and local information from first-order neighbors. (a) The information sources obtained by individuals is used to perceive the infection risk; (b) The subsidy policy from government; (c) Evaluation of payoffs for unvaccinated and that of vaccinated individuals at time t; (d) Individuals determine to take the vaccinate or not.
Fig 4
Fig 4. The final epidemic size (R) and the vaccine coverage (V) as functions of λ under different vaccination strategies.
No vaccination (NV, blue); the risk perception vaccination strategy (RP, purple); the risk perception with subsidy policy vaccination strategy (RPS, green). (a) and (c): HED network; (b) and (d): HOD network. Here the relative cost c = 0.5.
Fig 5
Fig 5. The final epidemic size (R) and the vaccine coverage (V) versus c under the RP and the RPS strategies.
Risk perception vaccination strategy (RP, purple); Risk perception with subsidy policy vaccination strategy (RPS, green). (a) and (c): HED network; (b) and (d): HOD network. Here, the infection rate λ = 0.5.
Fig 6
Fig 6. The final epidemic size (R) and vaccine coverage (V) versus the relative cost c under different information sources.
GlobalI (GI, purple, square), GlobalIA (GIA, purple, circle), GlobalI + LocalI (GI + LI, blue, square), GlobalIA + LocalI (GIA + LI, blue, circle), LocalI (LI, green, square). (a) and (c): RP strategy; (b) and (d): RPS strategy. Here, the infection rate λ = 0.5.
Fig 7
Fig 7. The social cost (SC) versus the relative cost c under different information sources for the RP strategy (a) and the RPS strategy (b).
GlobalI (GI, purple, square), GlobalIA (GIA, purple, circle), GlobalI + LocalI (GI + LI, blue, square), GlobalIA + LocalI (GIA + LI, blue, circle), LocalI (LI, green, square). Here, the infection rate λ = 0.5.
Fig 8
Fig 8. The epidemic scale R and the vaccinate coverage V versus cost (c) for different failure rate (α) under the RPS strategy.
(a) R; (b) V. Here, the infection rate λ = 0.5.
Fig 9
Fig 9. Effects of failure rate of vaccine (α) and cost (c) under different information sources.
(a)—(e): R, (f)—(j): V. (a) and (f): Global information about infected individuals (GI); (b) and (g): Global information about infected and asymptomatic individuals (GIA); (c) and (h): Global information about infected individuals and local information about infected individuals (GI + LI); (d) and (i): Global information about infected and asymptomatic individuals combined with local information about infected individuals (GIA + LI); (e) and (j): Local information about infected individuals (LI). Here, the infection rate λ = 0.5.
Fig 10
Fig 10. The epidemic scale R and the vaccinate coverage V versus cost (c) for different time-sensitivity of vaccine (δ) under the RPS strategy.
(a) R; (b) V. Here, the infection rate λ = 0.5.
Fig 11
Fig 11. Effects of time-sensitivity of vaccine (δ) and cost (c) under different information sources.
(a)—(e): R, (f)—(j): V. (a) and (f): Global information about infected individuals (GI); (b) and (g): Global information about infected and asymptomatic individuals (GIA); (c) and (h): Global information about infected individuals and local information about infected individuals (GI+ LI); (d) and (i): Global information about infected and asymptomatic individuals with local information about infected individuals (GIA + LI); (e) and (j): Local information about infected individuals (LI). Here, the infection rate λ = 0.5.

Similar articles

References

    1. Wang L, Zhang Y, Huang T, Li X. Estimating the value of containment strategies in delaying the arrival time of an influenza pandemic: A case study of travel restriction and patient isolation. Physical Review E. 2012;86(3):032901. doi: 10.1103/PhysRevE.86.032901 - DOI - PubMed
    1. Fraser C, Riley S, Anderson RM, Ferguson NM. Factors that make an infectious disease outbreak controllable. Proceedings of the National Academy of Sciences. 2004;101(16):6146–6151. doi: 10.1073/pnas.0307506101 - DOI - PMC - PubMed
    1. Arenas A, Cota W, Gómez-Gardeñes J, Gómez S, Granell C, Matamalas JT, et al.. Modeling the spatiotemporal epidemic spreading of COVID-19 and the impact of mobility and social distancing interventions. Physical Review X. 2020;10(4):041055. doi: 10.1103/PhysRevX.10.041055 - DOI
    1. Li W, Zhou J, Lu Ja. The effect of behavior of wearing masks on epidemic dynamics. Nonlinear Dynamics. 2020;101(3):1995–2001. doi: 10.1007/s11071-020-05759-4 - DOI - PMC - PubMed
    1. Bassolas A, Santoro A, Sousa S, Rognone S, Nicosia V. Optimising the mitigation of epidemic spreading through targeted adoption of contact tracing apps. Physical Review Research. 2022;4(2):023092. doi: 10.1103/PhysRevResearch.4.023092 - DOI

Publication types