. 2022 Oct 14;378(6616):192-201.
doi: 10.1126/science.abf3326. Epub 2022 Oct 13.

Sentinel p16INK4a+ cells in the basement membrane form a reparative niche in the lung

Affiliations

Sentinel p16INK4a+ cells in the basement membrane form a reparative niche in the lung

Nabora S Reyes et al. Science. .

Abstract

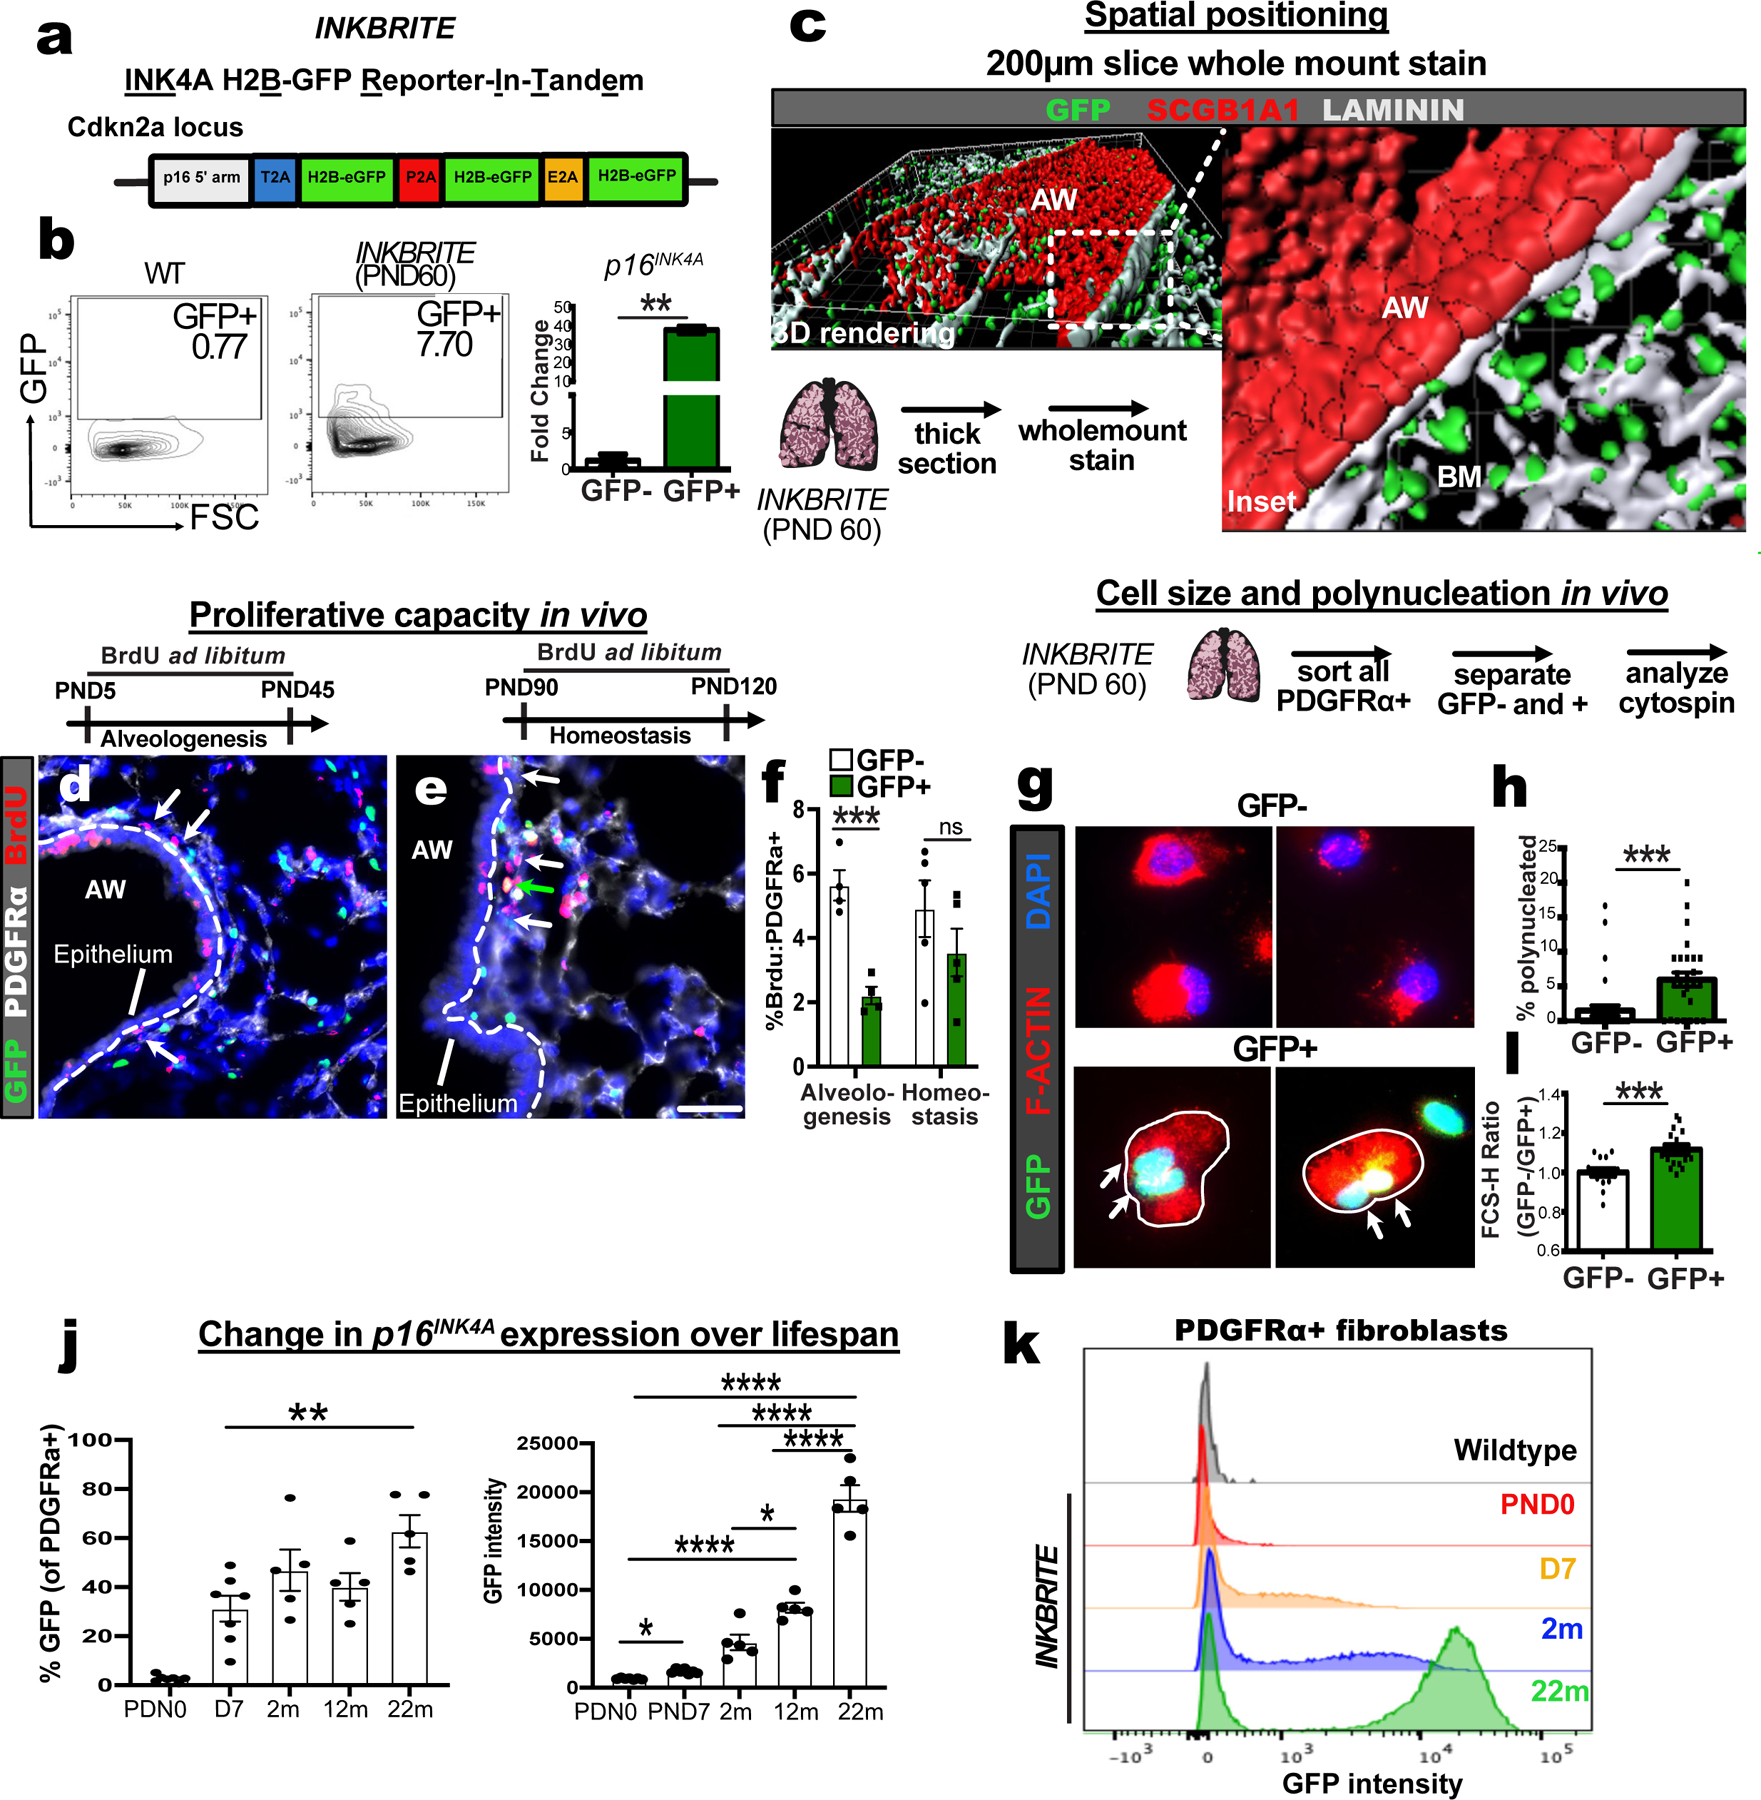
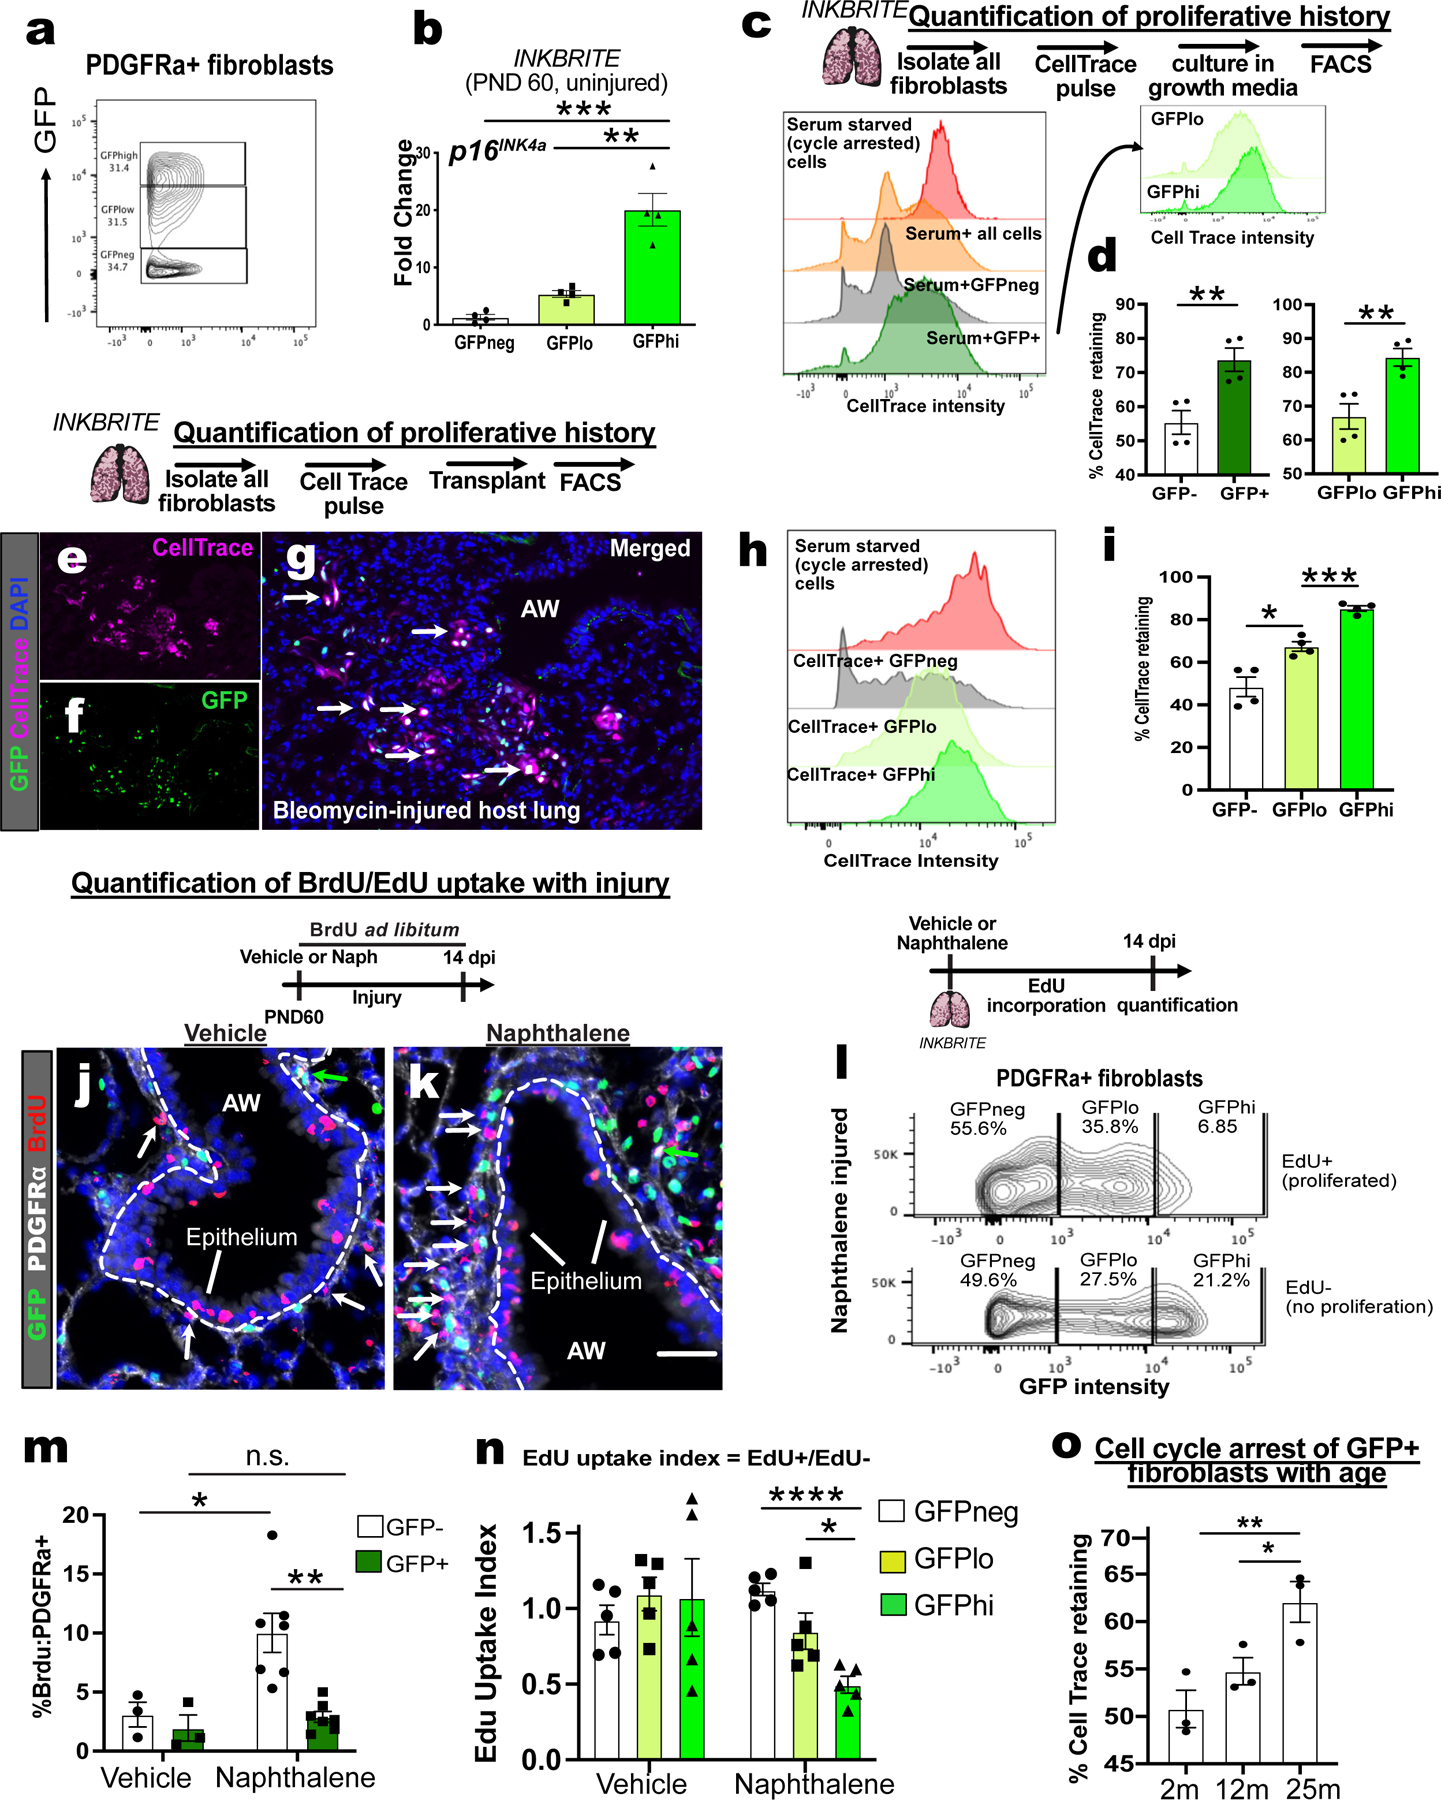
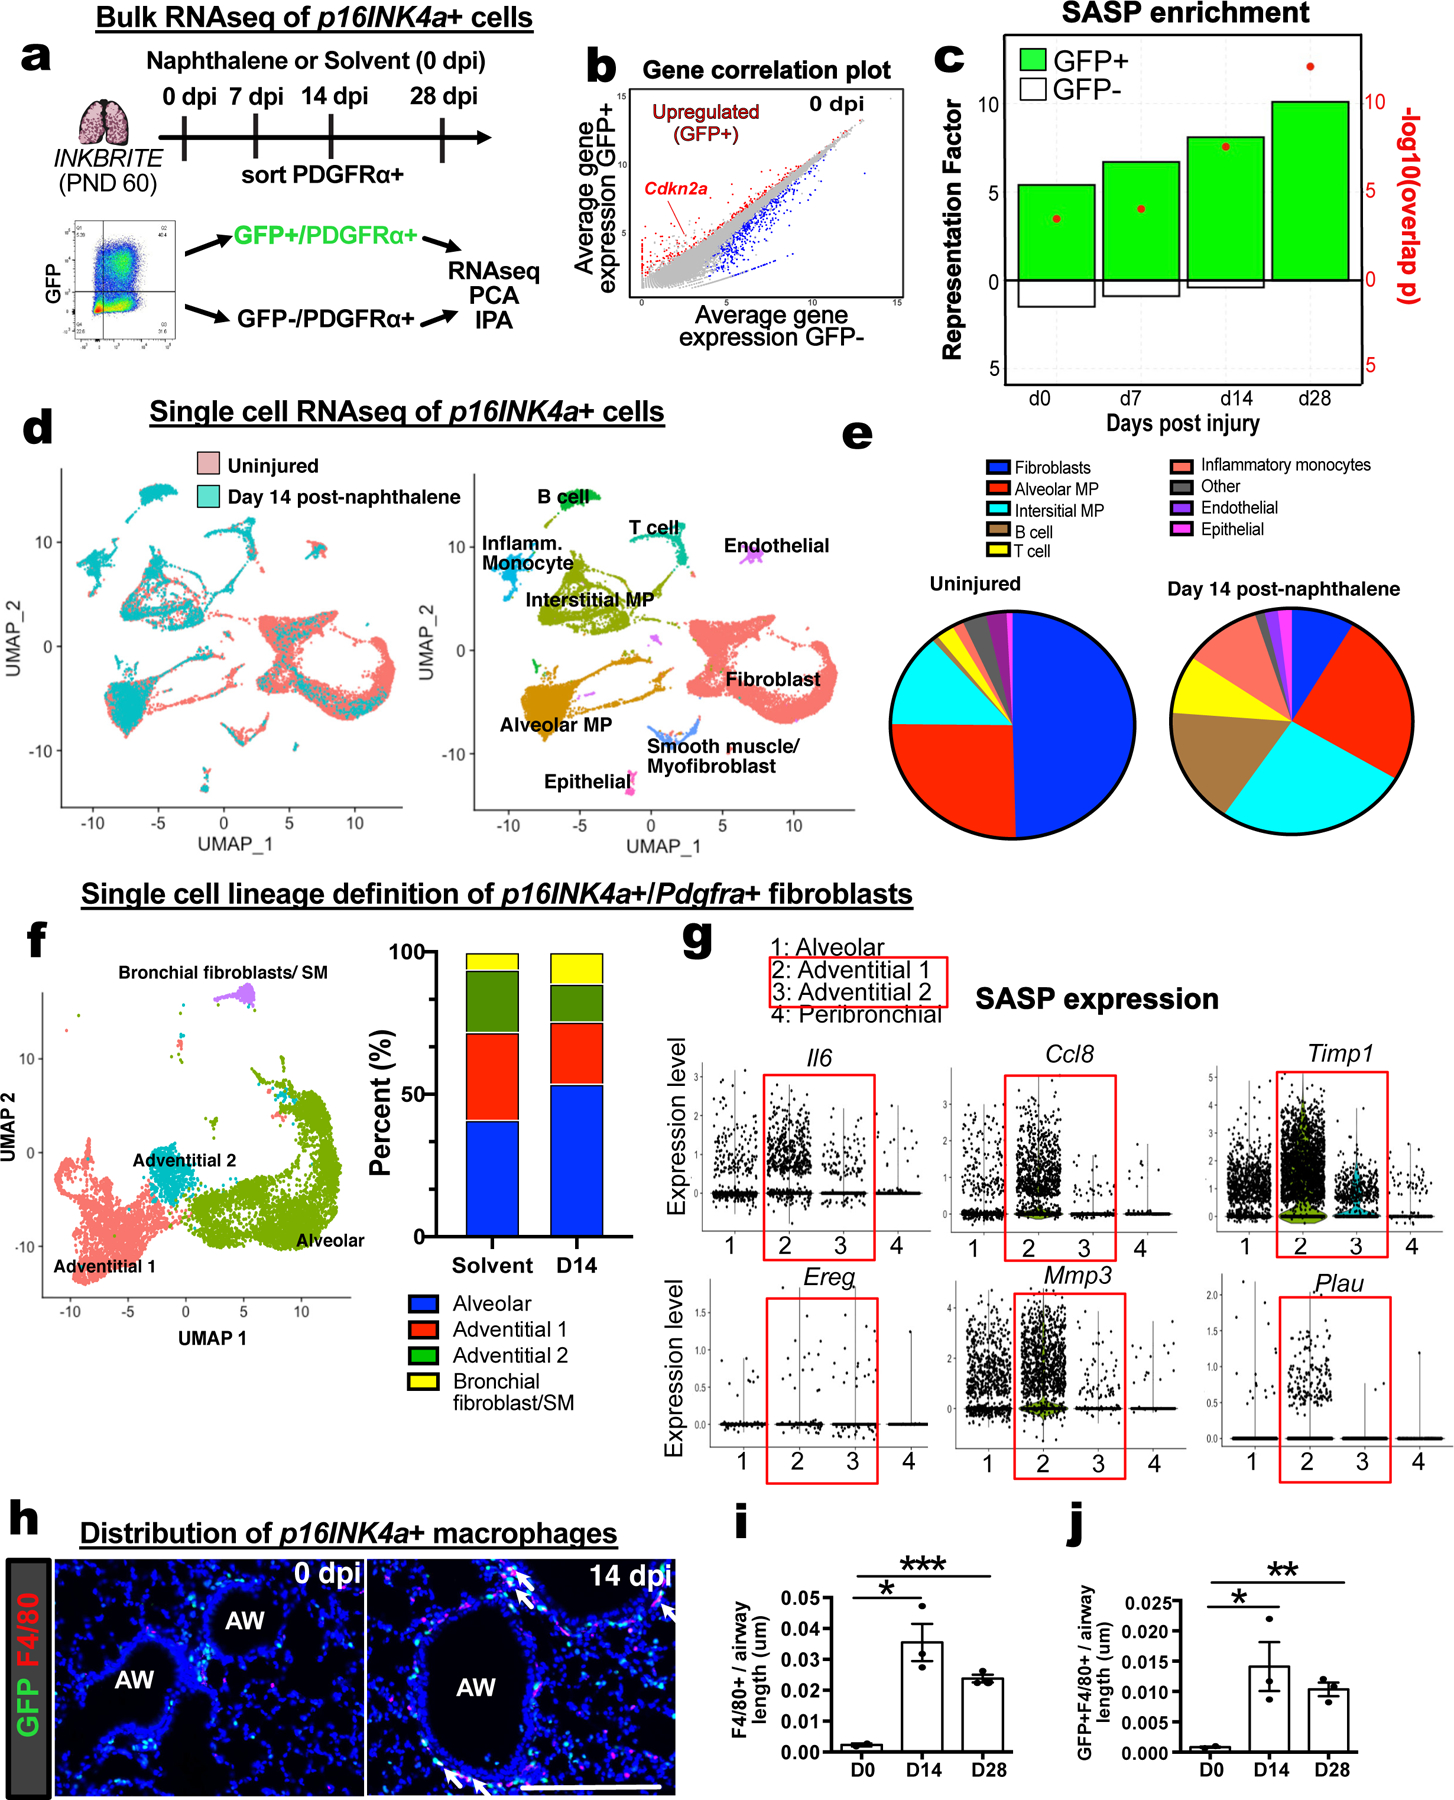
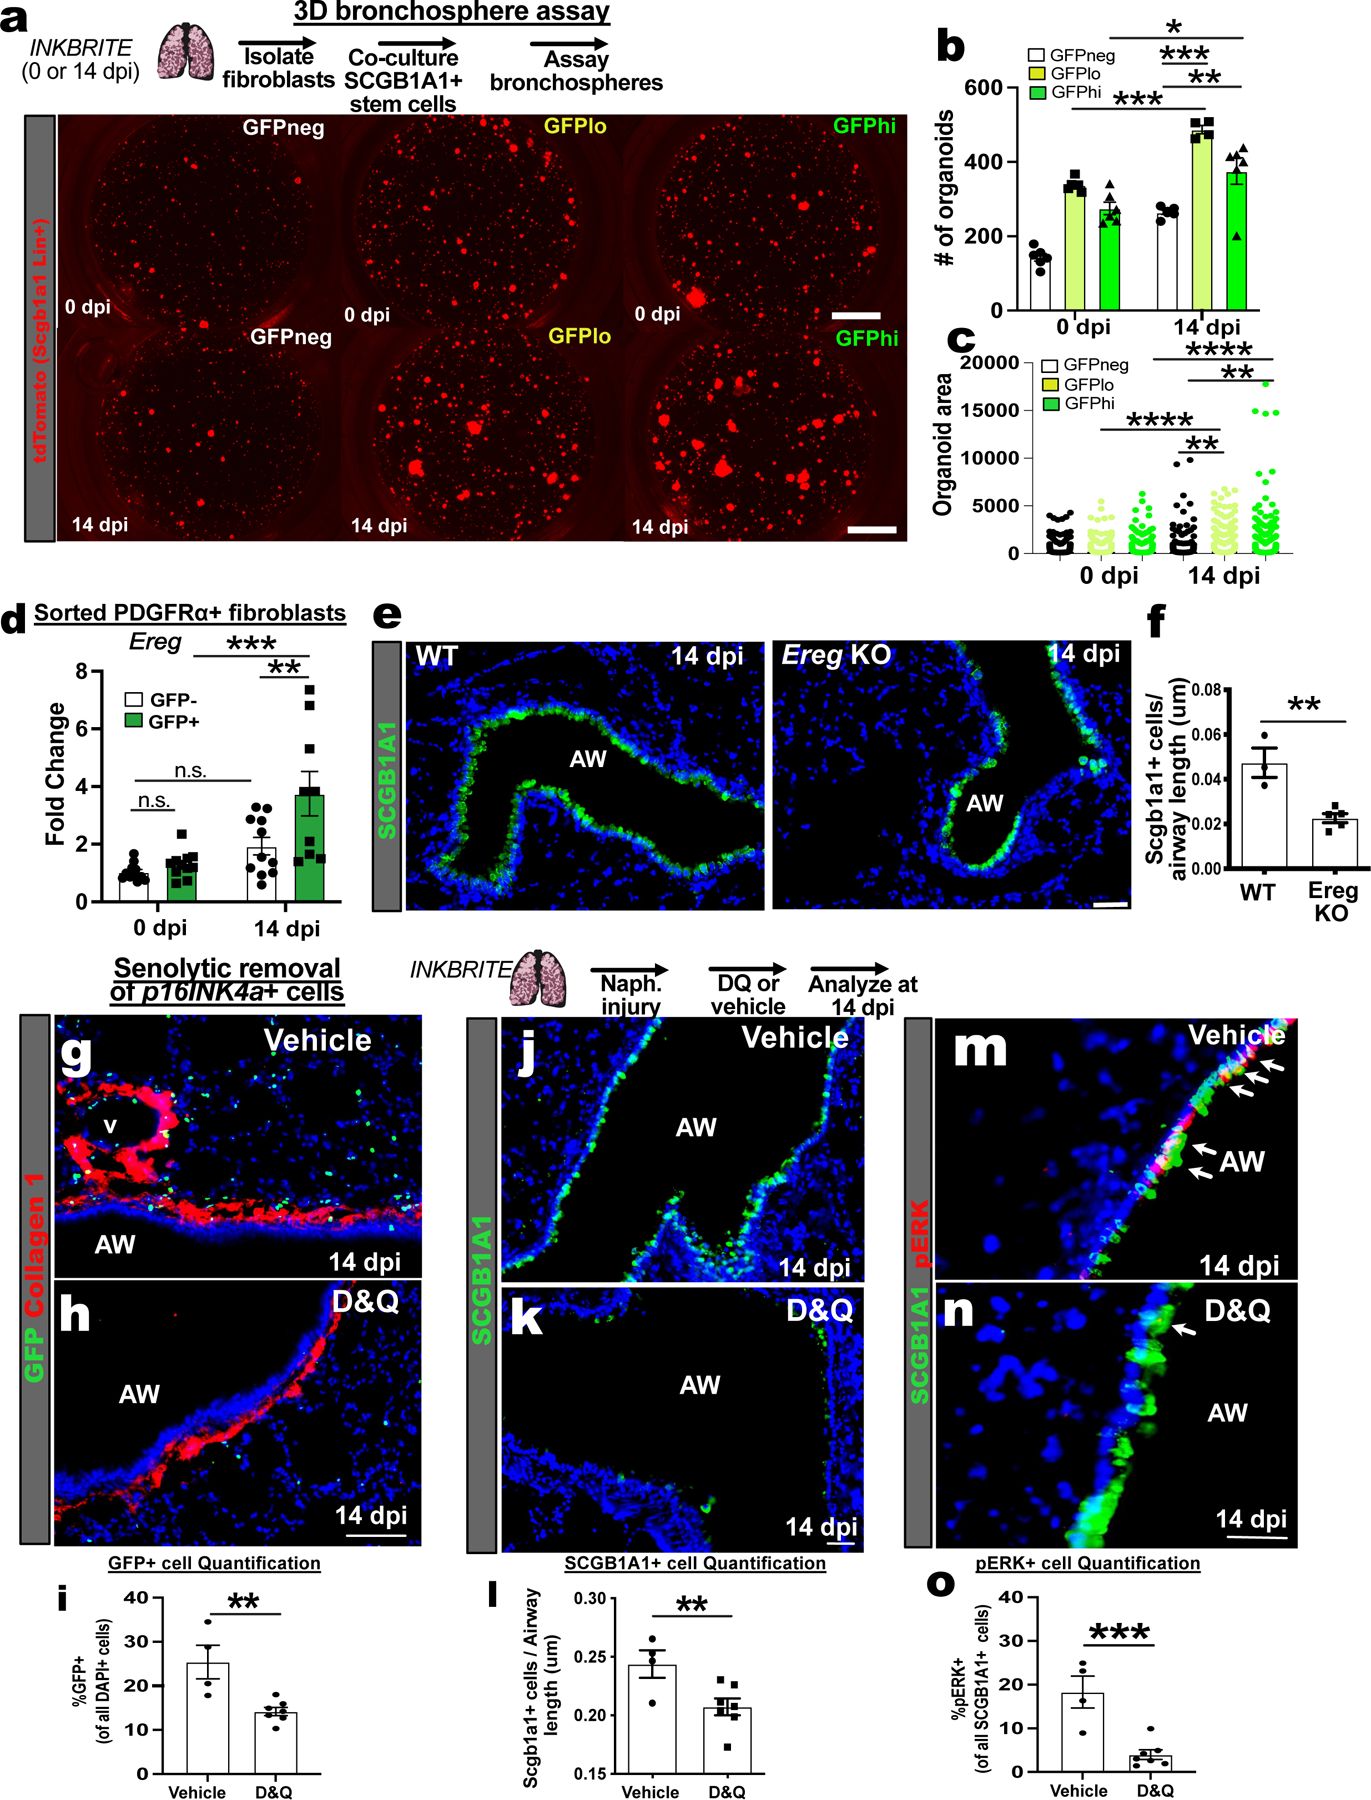
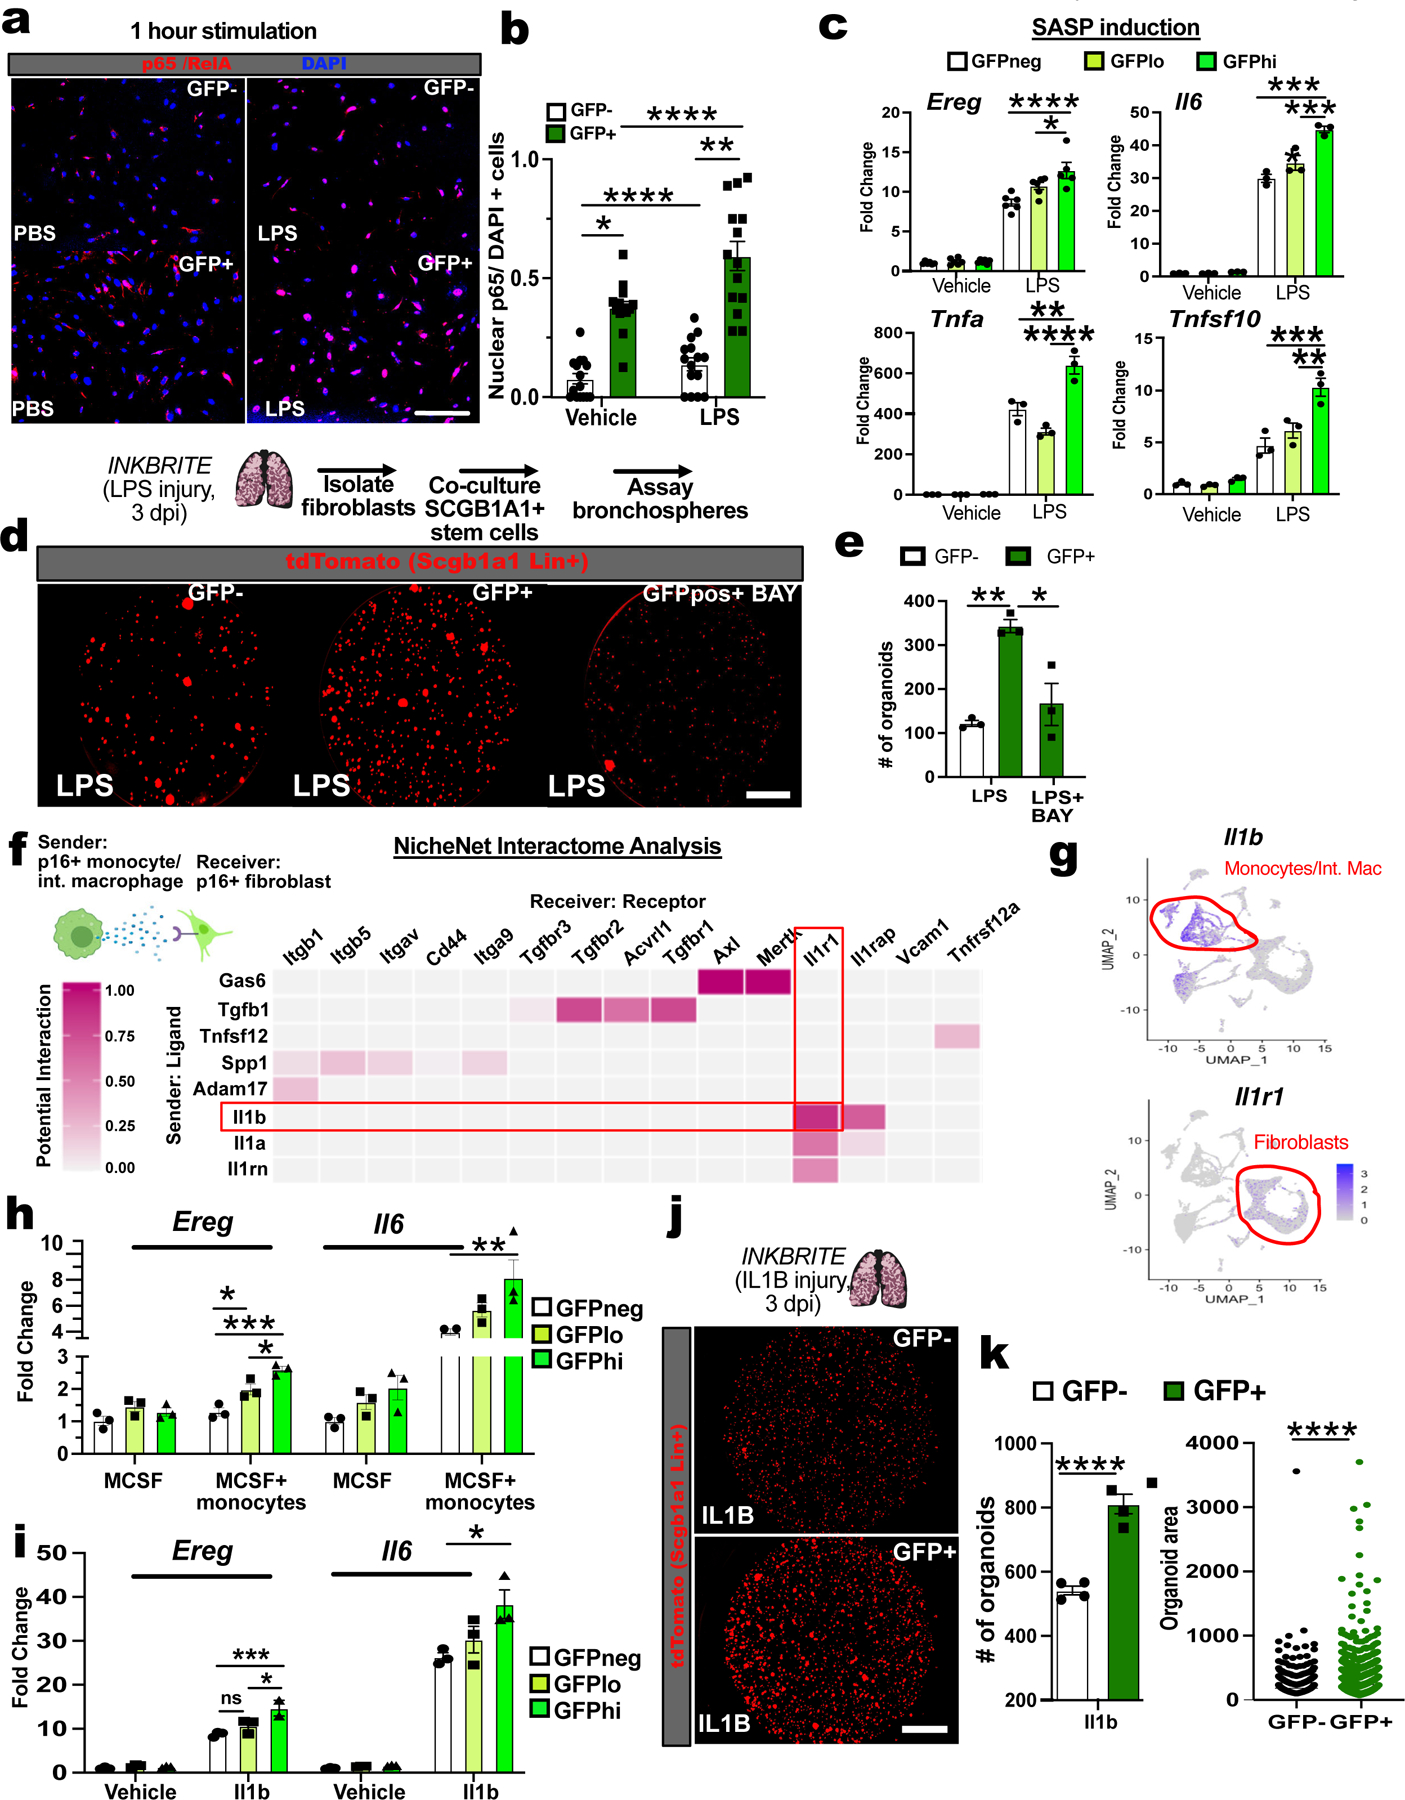
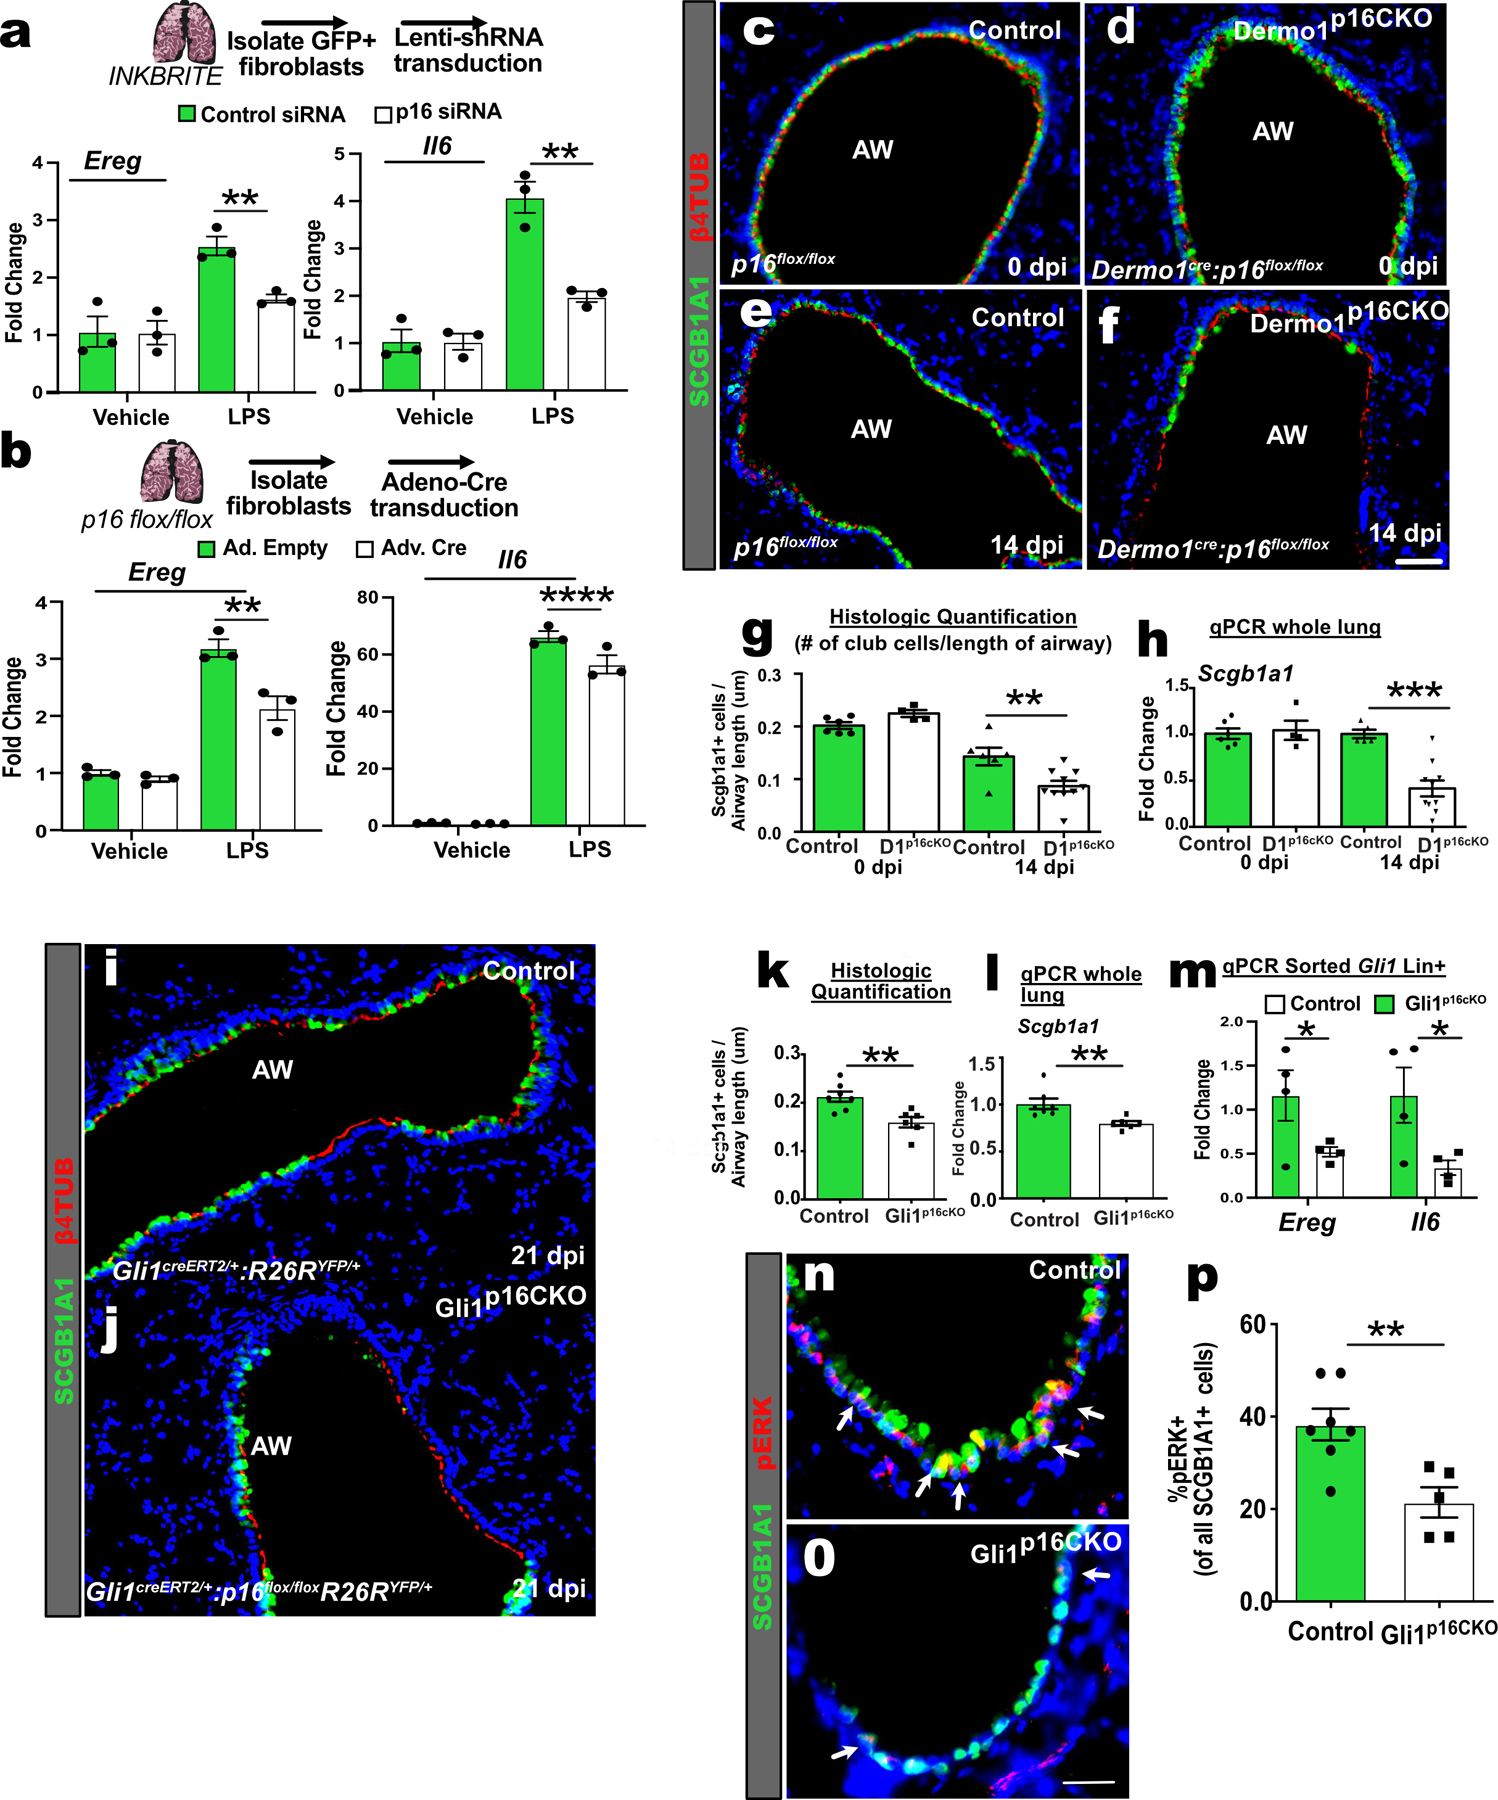
We engineered an ultrasensitive reporter of p16INK4a, a biomarker of cellular senescence. Our reporter detected p16INK4a-expressing fibroblasts with certain senescent characteristics that appeared shortly after birth in the basement membrane adjacent to epithelial stem cells in the lung. Furthermore, these p16INK4a+ fibroblasts had enhanced capacity to sense tissue inflammation and respond through their increased secretory capacity to promote epithelial regeneration. In addition, p16INK4a expression was required in fibroblasts to enhance epithelial regeneration. This study highlights a role for p16INK4a+ fibroblasts as tissue-resident sentinels in the stem cell niche that monitor barrier integrity and rapidly respond to inflammation to promote tissue regeneration.


Conflict of interest statement

Competing interests: authors do not have any competing interests.

Figures

Figure 1.
Figure 1.. INKBRITE identifies p16INK4A+ cells with senescent characteristics in vivo.
(A) Target construct design for INKBRITE. (B) FACS analysis of GFP+ cells from INKBRITE lungs and qPCR of sorted GFP+ and GFP−neg cells (n=2). (C) Wholemount image of the airway from thick-sectioned INKBRITE lung rendered on Imaris. (D to F) Immunohistochemistry (IHC) and quantification of BrdU incorporation into PDGFRα+ and GFP– (white arrows) or PDGFRα+ and GFP+ (green arrows) cells during alveologenesis or homeostasis (n=4 alveologenesis, n=5 homeostasis). (G and H) IHC and quantification of freshly sorted of GFP+ and GFP– fibroblasts for polynucleation (2 experiments, n=29–31 images per cell type). (I) FACS data with quantification of % GFP+ cells and mean GFP+ intensity of PDGFRα+ fibroblasts over the lifespan of INKBRITE animals (n; PND0=7, PND7=7, 2m=5, 22m=5). (J) Histogram display the of GFP intensity in PND0, PND7, 2m, and 22m PDGFRα+ lung fibroblasts (n= 5 per timepoint, 2 experiments). AW=airway, BM=basement membrane, PND=Postnatal day. Scale bars 100υm. Each point in graph represents one animal or one distinct image for in vitro studies with mean ± s.e.m. All p values determined by one-tailed t-test and two-way ANOVA when applicable. * p<0.05, ** p<0.01, *** p<0.001, **** p<0.0001.
Figure 2.
Figure 2.. Range of p16INK4a expression correlates with proliferative cell cycle arrest.
(A) Sorting strategy for GFP−high, low, and negative (hi/lo/neg) fibroblasts cells from uninjured INKBRITE lungs using GFP fluorescent intensity. (B) qPCR of p16INK4A transcript in GFPhi/lo/neg populations (n=4, >2 experiments). (C) Histogram of CellTrace Far Red (CTFR) intensity in INKBRITE lung fibroblasts. (D) quantification of % cell cycle arrest based on percentage of cells with CTFR intensity of serum-deprived cells (n=4, >2 experiments). (E to I) Histology, FACS and quantification of CTFR+ transplanted INKBRITE fibroblasts into Bleomycin injured NGS™ mice (2 experiments, n=4). (J to L) IHC and quantification of BrdU incorporation into PDGFRα+ and GFP–(white arrows) or PDGFRα+ and GFP+ (green arrows) cells in vehicle or naphthalene-injured (14 dpi) lungs (n = 3 for vehicle, 6 for naphthalene). (M) GFP intensity distribution of EdU+ and EdU− fibroblast isolated from naphthalene injured lungs (14 dpi). (N) EdU uptake Index (%EdU+/%EdU−) of GFPhi/lo/neg fibroblast populations in vehicle and naphthalene treated (14 dpi) fibroblasts (n = 5 per condition, 2 experiments). (O) CTFR retention in GFP+ fibroblasts of 2m, 12m, and 25m old INKBRITE lungs (n = 3 per timepoint, 2 experiments). AW = airway, dpi = days post injury. Each point in graph represents one animal with mean ± s.e.m. All p values determined by one-tailed t-test or two-way ANOVA when applicable. * p<0.05, ** p<0.01, *** p<0.001, **** p<0.0001.
Figure 3.
Figure 3.. Single cell and bulk RNA sequencing analysis of p16INK4A+ cells in the lung.
(A) Bulk RNAseq of p16INK4A+ and – fibroblasts during homeostasis (0 dpi) and injury (7,14,28 dpi) (n=3 animals per timepoint). (B) Gene correlation plot showing Cdkn2a expression. (C) Hypergeometric probability test for enrichment of differentially expressed genes (DEGs) between GFP+ and GFP−neg fibroblasts at each timepoint with SASP genes as quantified by Representation Factor and p-value. (D and E) Single cell analysis of all p16INK4A+ cells in 0 dpi and 14 dpi INKBRITE lungs. (F) Clustering of p16INK4A+ fibroblasts into distinct subsets in 0 dpi and 14 dpi INKBRITE lungs. (G) SASP gene expression at the single cell level in the 4 fibroblast subsets. (H to J) Histologic analysis of F4/80+ and GFP+ and F4/80+ macrophage/monocyte population in 0 dpi and 14 dpi INKBRITE lungs (0, 14, and 28 dpi; n=3). AW = airway, dpi = day post injury. Each point in graph represents one animal with mean ± s.e.m. All p values determined by one-tailed t-test. * p<0.05, ** p<0.01, *** p<0.001, **** p<0.0001.
Figure 4.
Figure 4.. Injured p16INK4A+ fibroblast enhances epithelial progenitor proliferation ex vivo.
(A) 3D organoid assay combining uninjured Scgb1a1+ airway stem cells (tdTomato+) with p16INK4Ahi/lo/neg fibroblasts isolated from INKBRITE lungs at 0 or 14 dpi. (B) Quantification of Scgb1a1+ organoid numbers and (C) size (n=3 triplicate wells per condition, >2 experiments). (D) qPCR of Ereg on sorted GFP+ or – fibroblasts from INKBRITE lungs at 0 or 14 dpi (n = 9 per timepoint, >2 experiments). (E and F) Histologic quantification of airway stem cell regeneration in Ereg knockout (KO) vs. WT lungs at 14 dpi (n = 4 per genotype, 2 experiments) (G to I) IHC quantification of GFP+ cells, (J to L) SCGB1A1+ cells, and (M to O) pERK+SCGB1A1+ cells in vehicle vs. D&Q treated INKBRITE lungs after naphthalene injury (14 dpi, vehicle n=4, D&Q n=7; 2 experiments). AW = airway, D&Q = dasatnib/quercetin. Each point in graph represents one technical replicate (bronchosphere) or one animal with mean ± s.e.m. All p values determined by one-tailed t-test and two-way ANOVA when applicable. * p<0.05, ** p<0.01, *** p<0.001, **** p<0.0001.
Figure 5.
Figure 5.. p16INK4A+ fibroblast senses inflammatory stimuli to augment epithelial regeneration.
(A and B) Quantification of nuclear p65/RelA in p16INK4A+ or – fibroblasts from uninjured INKBRITE lungs (PND60) after 1 hour of vehicle or LPS treatment (n=3 wells, 14–15 images per condition). (C) SASP gene expression in p16INK4Ahi/lo/neg fibroblasts from uninjured INKBRITE lungs after 6 hours of PBS or LPS incubation (n=3 wells per condition, 2 experiments). (D and E) Scgb1a1+ 3D organoid assay with p16INK4A+/- fibroblasts isolated from LPS injured INKBRITE lungs and treated with vehicle or BAY11-7082 (n=3 wells per conditions, 2 experiments). (F) NicheNet interactome analysis of p16INK4A+ fibroblasts and monocyte/interstitial monocytes from scRNAseq of injured INKBRITE lungs (14 dpi). (G) Expression of Il1b and Il1r1 in p16INK4A+ cells in the lung. (H and I) Quantification of Scgb1a1+ organoids co-cultured with p16INK4A+ or – fibroblasts from IL-1B-treated INKBRITE lungs (n=4 wells per conditions). Scale bars 100υm. Each point in graph represents one triplicate well or distinct image with mean ± s.e.m. All p values determined by one-tailed t-test or two-way ANOVA when applicable. * p<0.05, ** p<0.01, *** p<0.001, **** p<0.0001. Scale bars 100υm.
Figure 6.
Figure 6.. Mesenchymal p16INK4A expression is required for epithelial regeneration in vivo.
(A) qPCR of Ereg and Il6 in control or p16INK4A shRNA treated GFP+ fibroblasts after stimulation with vehicle or LPS for 6 hours (n=3 wells per conditions, 2 experiments). (B) qPCR of Ereg and Il6 in adeno-control or adeno-Cre treated p16flox/flox fibroblasts after stimulation with vehicle or LPS (n=3 wells per conditions, >2 experiments). (C to G) Images and quantification of the airways of control and Dermo1p16CKO lungs with and without naphthalene injury. (H) qPCR of Scgb1a1 of whole lung RNA (uninjured: n=6 Control, n=5 Dermo1p16CKO; injured: n=6 Control, n=10 Dermo1p16CKO,2 experiments ). (I to L) Images, histological quantification of SCGB1A1 club cells, and qPCR of Scgb1a1 on control and Gli1p16CKO lungs after naphthalene injury (n=7 Control, n=6 Gli1p16CKO). (M) qPCR of Ereg and Il6 of sorted Gli1 Lin+ cells after naphthalene (n=4 Control; n=4 Gli1p16CKO). (N to P) Images and quantification of pERK+ and SCGB1A1+ cells in control and Gli1p16CKO lungs after naphthalene injury (n=7 Control, n=6 Gli1p16CKO). AW=airway. Scale bars 100υm. Each point in graph represents one animal with mean ± s.e.m. All p values determined by one-tailed t-test and two-way ANOVA when applicable. * p<0.05, ** p<0.01, *** p<0.001, **** p<0.0001.

Comment in

References

    1. Zindy F, Quelle DE, Roussel MF, C. J. Oncogene 15, 203–211 (1997). - PubMed
    1. Gorgoulis V et al. Cell 179, 813–827 (2019). - PubMed
    1. Takeuchi S et al. Cancer Res 70, 9381–9390 (2010). - PubMed
    1. Burd CE et al. Cell 152, 340–351 (2013). - PMC - PubMed
    1. Demaria M et al. Dev Cell 31, 722–733 (2014). - PMC - PubMed

Publication types

MeSH terms

Substances