. 2022 Dec 7;110(23):3952-3969.e8.
doi: 10.1016/j.neuron.2022.09.001. Epub 2022 Oct 12.

In vitro neurons learn and exhibit sentience when embodied in a simulated game-world

Affiliations

In vitro neurons learn and exhibit sentience when embodied in a simulated game-world

Brett J Kagan et al. Neuron. .

Abstract

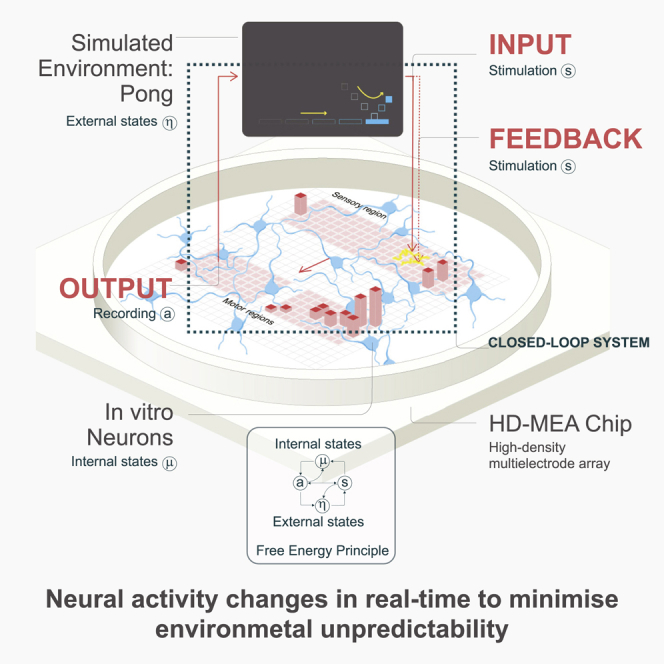
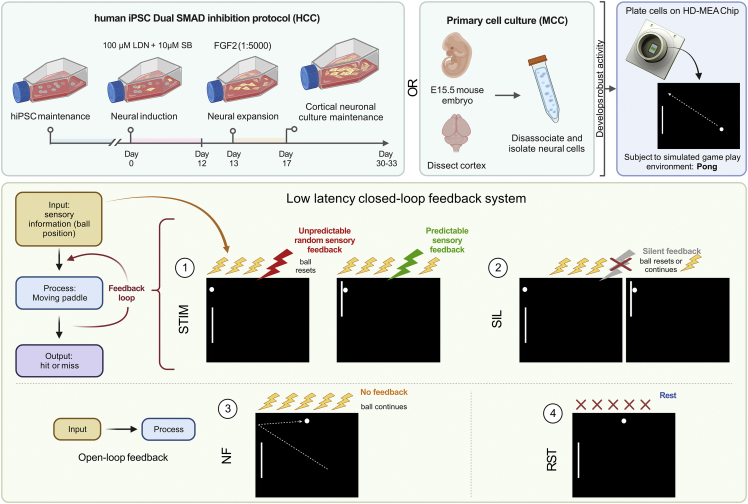
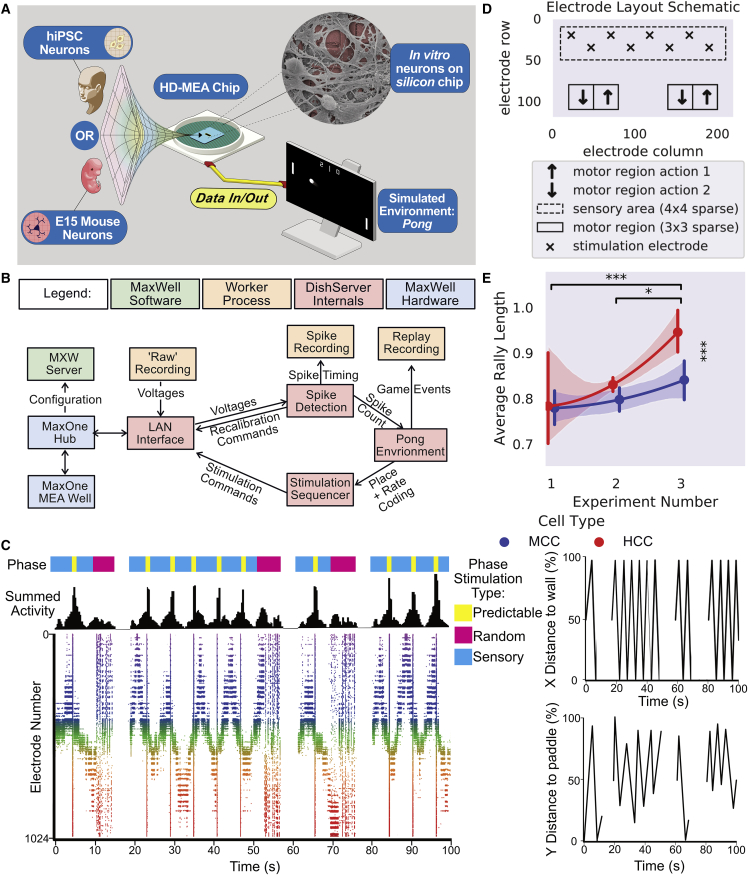
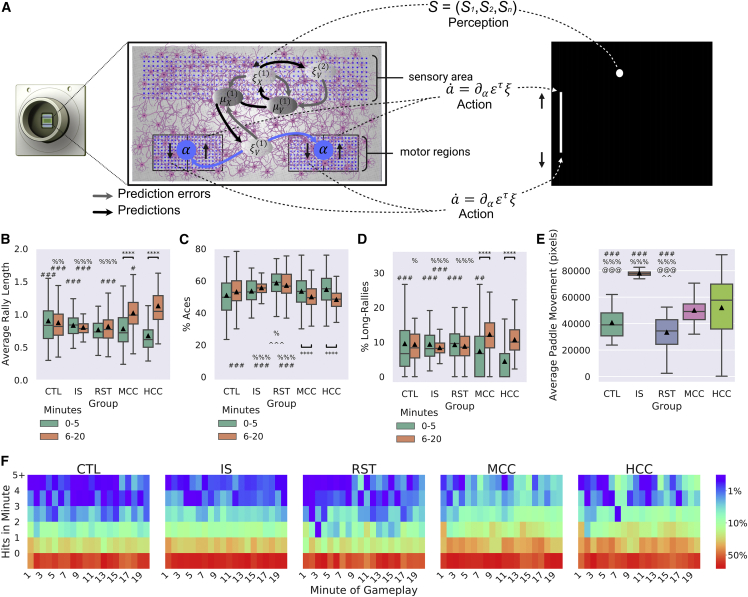
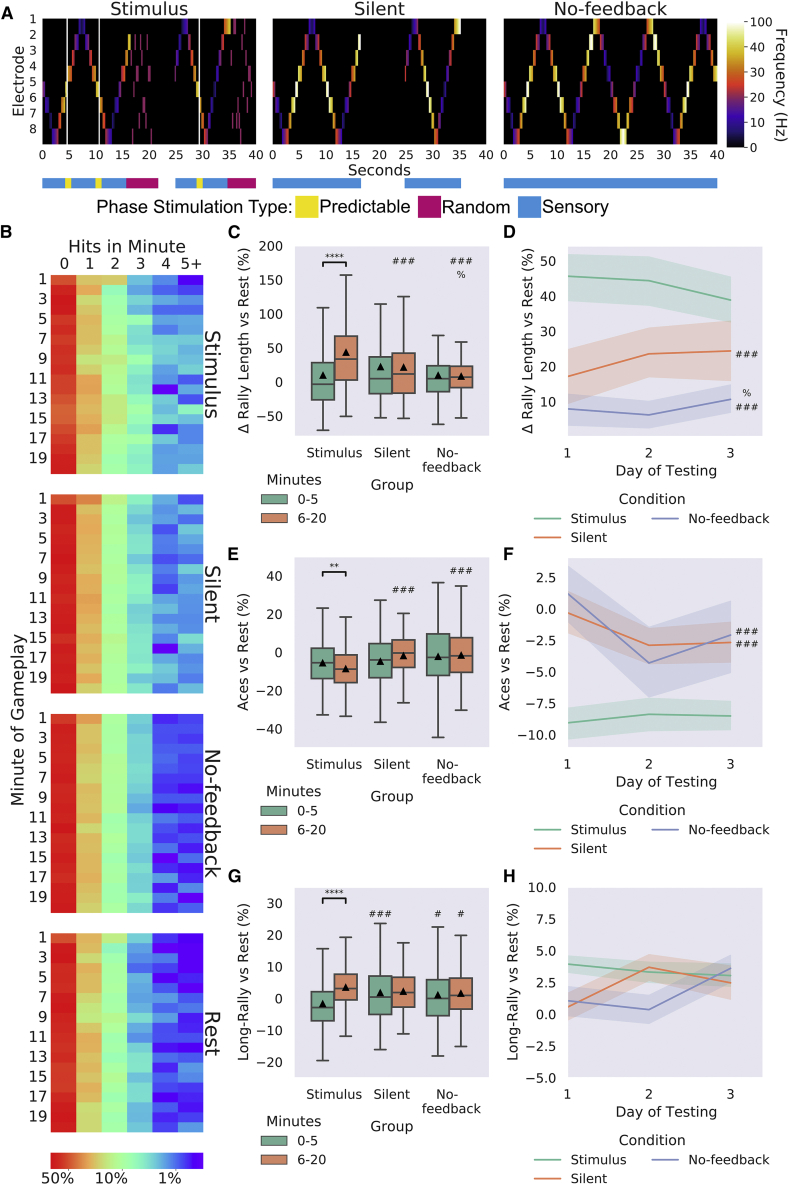
Integrating neurons into digital systems may enable performance infeasible with silicon alone. Here, we develop DishBrain, a system that harnesses the inherent adaptive computation of neurons in a structured environment. In vitro neural networks from human or rodent origins are integrated with in silico computing via a high-density multielectrode array. Through electrophysiological stimulation and recording, cultures are embedded in a simulated game-world, mimicking the arcade game "Pong." Applying implications from the theory of active inference via the free energy principle, we find apparent learning within five minutes of real-time gameplay not observed in control conditions. Further experiments demonstrate the importance of closed-loop structured feedback in eliciting learning over time. Cultures display the ability to self-organize activity in a goal-directed manner in response to sparse sensory information about the consequences of their actions, which we term synthetic biological intelligence. Future applications may provide further insights into the cellular correlates of intelligence.

Keywords: cell culture; electrophysiology; free energy principle; intelligence; in vitro; learning; microphysiological systems; neurocomputation; neurons; synthetic biological intelligence.


Conflict of interest statement

Declaration of interests B.J.K. is an employee of Cortical Labs. B.J.K. and A.C.K. are shareholders of Cortical Labs. B.J.K. and A.C.K. hold an interest in patents related to this publication. F.H. and M.K. received funding from Cortical Labs for work related to this publication.

Figures

None
Graphical abstract
Figure 1
Figure 1
DishBrain system and experimental protocol schematic Neuronal cultures derived from hiPSC via DSI protocol, NGN2 lentivirus-directed differentiation, or primary cortical cells from E15.5 mouse embryos were plated onto HD-MEA chips and embedded in a stimulated game-world of “Pong” via the DishBrain system. Different DishBrain environments were created by altering the pattern of sensory information (yellow bolts), feedback (colored bolts), or no stimulus (red crosses) to demonstrate (1 and 2) low-latency, closed-loop feedback system (stimulation (STIM) and silent (SIL) treatment); (3) no-feedback (NF) system to demonstrate an open-loop feedback configuration; and (4) rest (RST) configuration to demonstrate a system in which sensory information is absent. Interactive visualizer of activity and gameplay: https://bit.ly/3DSi4Eg.
Figure 2
Figure 2
Cortical cells form dense interconnected networks (A and B) Cortical cells from E15 mouse brains and differentiated from hiPSCs, respectively. DAPI in blue stains all cells, NeuN in green shows neurons, beta III tubulin (BIII) marks axons, while MAP2 marks dendrites. Scale bar = 50μm. (C) GFAP shows supporting astrocytes, critical for long-term functioning; TBR1 marks cortex-specific cells. No Ki67, a marker of dividing cells, was observed with these cultures. Scale bar = 50μm. (D) Gene expression studies over 28 days demonstrated increased expression of the glutamatergic neural marker, vesicular glutamate transporter 1 (vGLUT1). (E–G) Neurons differentiated from hiPSCs using the DSI protocol, maintained on MEA for >3 months. White arrows show regions of shrinkage within the cultures, red arrows show bundles of axons, and blue arrows show single neurite extensions. Note the dense coverage over the HD-MEA and overlapping connections extended from neuronal soma present in all cultures across multiple electrodes. Scale bars: E = 200μm, F = 100μm, G = 50μm (H) Has false coloring to highlight the HD-MEA electrodes beneath the cells. Scale bar = 20μm.
Figure 3
Figure 3
Cortical cells display spontaneous electrophysiological activity Shaded error = 95% confidence intervals. (A) Firing rate for E15.5 primary rodent cortical cells, hiPSC cells differentiated to cortical neurons via DSI, and hiPSC cells differentiated via NGN2 direct differentiation. Note different time points for each cell type. Scale bar displays firing frequency (Hz) from 0.0 to 1.0. (B) Max firing was consistently different between cortical cells from a primary source and cortical cells differentiated from hiPSCs. (C and D) Mean activity between hiPSCs differentiated using DSI and primary cortical cultures was generally similar, while hiPSCs differentiated using the NGN2 method continued to increase. This is reflected in (D), where the former two cell types displayed minimal changes in the variance in firing within a culture, while the latter increased variance over time. (E, F, and G) Showcases raster plots over 50 s, where each dot is a neuron firing an action potential colored to help distinguish channel firing and stars indicate time points with observed bursting activity. Note the differences between mid-stage cortical cells from a DIV14 primary rodent culture (E) compared with more mature DIV73 human cortical cells (F) differentiated from iPSCs using the DSI and NGN2 direct differentiated neurons (G) approach described in text, in terms of synchronized activity and stable firing patterns. While all display synchronized activity, there is a difference in the overall levels of activity represented in (B–D).
Figure 4
Figure 4
Schematics and pilot testing with increasing informational density (A) Diagrammatic overview of DishBrain setup. (B) Software components and data flow in the DishBrain closed-loop system. Voltage samples flow from the MEA to the “Pong” environment, and sensory information flows back to the MEA, forming a closed loop. Full caption in Figure S2. (C) Schematic showing the different phases of stimulation to the culture. In line with this is the corresponding summed activity on the raster plot over 100 seconds. The appearance of random stimulation after a ball missing versus system-wide predictable stimulation upon a successful hit is apparent across all three representations. Corresponding images on the right show the position of the ball on both x and y axis relative to the paddle and back wall in percentage of total distance shown on the same timescale. (D) Final electrode layout schematic for DishBrain Pong-world gameplay. (E)  = p < 0.05, ∗∗∗ = p < 0.001; error bars = 95% CI. Shows average rally length over three distinct experiment rounds during design of DishBrain Pong-world where each subsequent experiment provided higher density information on ball position than the previous. MCC tested over 272 sessions, n = 50 biological replicates; HCC tested over 579 sessions, n = 18 biological replicates.
Figure 5
Figure 5
Embodied cortical neurons show significantly improved performance in “Pong” when embodied in a virtual game-world 399 test-sessions were analyzed with biological replicates: 80-CTL (n = 6), 42-RST (n = 20), 38-IS (n = 3), 101-MCCs (n = 9), 138-HCCs (n = 11). Significance bars show within-group differences denoted with . Symbols show between-group differences at the given timepoint: # = versus HCC; % = versus MCC; ˆˆ = versus CTL; @ = versus IS. The number of symbols denotes the p value cutoff, where 1 = p < 0.05, 2 = p < 0.01, 3 = p < 0.001, and 4 = p < 0.0001. Boxplots show interquartile range, with bars demonstrating 1.5× interquartile range, the line marks the median, and ▲ marks the mean. (A) Schematic of how neurons may engage in the game-world under active inference denoting a gradient flow on variational free energy, expressed in terms of neural activity minimizing prediction errors. ε is prediction error, ξ represents a precision-weighted prediction error. Precision can be regarded as a Kalman gain in Kalman filtering; ‘a’ corresponds to action. (B–D) Experimental groups according to time point 1 (T1; 0–5 min) and time point 2 (T2; 6–20 min). (B) Average performance between groups over time, where only experimental (MCC: t = 6.15, p = 5.27−08 and HCC: t = 10.44, p = 3.92−19) showed significant improvement and higher average rally length against all control groups at T2. (C) Average number of aces between groups and over time, only MCC (t = 2.67, p = 0.008) and HCC (t = 5.95, p = 2.13−08) differed significantly over time. The RST group had significantly more aces compared with the CTL, IS, MCC, and HCC groups at T1 and compared with the CTL, MCC, and HCC at T2. Only MCCs and HCCs showed significant decreases in the number of aces over time, indicating learning. At T2 they also showed fewer aces compared with the IS group, but only the HCC group was significantly less than CTL. (D) Average number of long rallies (>3) performed in a session. At T1, the HCC group had significantly fewer long rallies compared with all control groups (CTL, IS, and RST). However, both the MCC (t = 5.55, p = 2.36−07) and HCC (t = 10.38, p = 5.27−19) groups showed significantly more long rallies over time. By T2, the HCC group displayed significantly more long rallies compared with the IS group. The HCC group also displayed significantly more long rallies compared with all CTL, IS, and RST control groups. (E) The average distance that the paddle moved during a session was found to have no obvious relationship with average rally length as the IS control groups showed a higher movement than the experimental groups, while CTL and RST were lower. As such, the observed learning effects are not likely due to stimulation, leading to increased activity of paddle movement. (F) Distribution of frequency of mean summed hits per minute among groups shows obvious differences; scale bar shows the probability the number of hits in the given minute under that condition.
Figure 6
Figure 6
The importance of feedback in learning 486 sessions were analyzed. Significance bars show within-group differences denoted with . Symbols show between-group differences at the given timepoint: # = versus Stimulus; % = versus Silent. The number of symbols denotes the p value cutoff, where 1 = p < 0.05, 2 = p < 0.01, 3 = p < 0.001, and 4 = p < 0.0001. Box plots show interquartile range, with bars demonstrating 1.5× interquartile range, the line marks the median, and ▲ marks the mean. Errors bands = 1 SE. (A) Schematic showing the stimulation from the 8 sensory electrodes across 40 s of the same gameplay for each of the three conditions. The bar below color codes what phase of stimulation is being delivered, where random stimulation follows a miss and predictable stimulation follows a hit in the Stimulus condition. Note the corresponding absence of any stimulation in the Silent condition and the lack of any change in sensory stimulation in the No-feedback condition. (B) Displays the probability of a certain number of hits occurring in a group at a specific minute. (C) Using different feedback schedules, the Stimulus feedback condition showed significant learning (as in Figure 5A; t = 7.48, p = 1.58−12) and outperformed Silent and No-feedback average rally length. Silent feedback also showed higher performance compared with these groups at T2. (D) Displays difference seen in (C) across day. (E) Shows similar differences versus rest performance for aces across conditions, where the Stimulus group showed significantly fewer aces across time (t = 3.21, p = 0.002). (F) Displays data from (E) across day. (G and H) Shows that the Stimulus condition showed significant increase (t = 3.21, p = 0.002) across timepoints; however, as in (H), no differences were found across time for long rallies.
Figure 7
Figure 7
Electrophysiological activity during Gameplay and Rest 579 sessions (358 Gameplay, 221 Rest) were analyzed with n = 43 biological replicates. Significance bars show within-group differences denoted with ∗. Symbols show between-group differences at the given timepoint: # = versus Gameplay or Stimulus; % = versus Silent. The number of symbols denotes the p-value cutoff, where 1 = p < 0.05, 2 = p <0.01, 3 = p < 0.001, and 4 = p <0.0001. Box plots show interquartile range, with bars demonstrating 1.5× interquartile range, the line marks the median, and ▲marks the mean. Error bands = 1 SE. (A–D) A significant positive correlation between mean firing and performance was found between motor region 1 and 2 with the Sensory area both during Rest (A and B) and Gameplay (C and D). (E) The average cross-sensory motor correlation was significantly less during Rest, both for motor region 1 (t = 30.40, p = 6.61−194) and motor region 2 (t = 29.76, p = 2.76−186) than during Gameplay. (F) The percentage of mutually exclusive activity events per second across motor regions was calculated and found to increase significantly during Gameplay versus Rest (t = 14.64, p = 5.68−48). (G) The correlation between the two motor regions showed substantial changes over time (blue). Linear regression conducted on the first 5 min of Gameplay (orange) showed a significant negative relationship between variables that was absent in the final 15 min (teal). (H) Activity over time showed no significant changes while engaged in Gameplay (r = −0.01, p = 0.563), supporting that any observed learning effects over time were not related to merely gross changes in activity levels across the cultures over time. (I) Functional plasticity was assessed across cultures when engaged in Gameplay versus Rest, with a significant increase in functional plasticity found during gameplay. (J) Following random stimulation feedback, there was a significant increase in the mean information entropy during Gameplay (t = 4.890, p = 2.024−6), yet the corresponding time during Rest showed no change (t = 0.016, p = 0.987). Mean information entropy was lower at both pre- (t = 9.781, p = 3.882−19) and post- (t = 5.915, p = 1.178−8) feedback during Gameplay than at Rest. (K) For normalized mean information entropy, the difference relative to feedback period was increased during Gameplay (t = 19.337, p = 3.476−48), yet still no difference was observed during Rest where no feedback was delivered (t = 1.022, p = 0.316). Normalized mean information entropy was lower at pre- (t = 10.192, p = 2.139−20), but not post- (t = 0.671, p = 0.503) feedback, during Gameplay compared with Rest. (L) Feedback-related changes in normalized mean information entropy were assessed for the investigation of different feedback mechanisms. Increases following random feedback for the Stimulus condition were replicated (t = 9.623, p = 7.887−19); it was also found that the system displayed increased activity-related scores under the Silent condition feedback (t = 21.538, p = 7.019−47). The No-feedback condition showed no change in normalized mean information entropy at matched times after Bonferroni corrections (t = 10.192, p = 0.030). Post-hoc follow-up tests found no differences between Stimulus and Silent conditions during gameplay; both were significantly lower than for the No-feedback condition. After feedback, the Stimulus and Silent conditions were significantly higher than the No-feedback condition, with the Silent condition significantly higher than the Stimulus condition.
Figure 8
Figure 8
Relationship between electrophysiological activity and average rally length 302 gameplay sessions were analyzed after filtering outliers (Z score > ±3.29) from rallies with n = 30 biological replicates. (A) The mean spontaneous activity (Hz) over all electrodes showed a significant positive correlation with average rally length. (B–D) Similarly, the max spontaneous firing (Hz) also showed a significant positive correlation with average rally length. In line with this, the average cross correlation between the sensory region and both motor region 1 (C) and motor region 2 (D) had a significant positive correlation with average rally length. (E) The DCT scores of four different basis functions were calculated to quantify asymmetry in spontaneous activity. DCT scores were normalized to mean activity. The scale bar shows the value assigned to activity in the given area, where each DCT basis function quantifies a different type of asymmetry per pixel from −0.010 to 0.010. (F–H) Displays the significant negative correlation between DCT 0,1 and average rally length, showing that asymmetry on the horizontal axis is related to poorer performance. There was no significant relationship between DCT 0,2 (G), which measured asymmetry on the horizontal extremes compared with the center, or DCT 1,0 (H), which measured asymmetry on the vertical axis. (I–M) DCT 2,0 function displayed a significant negative correlation with average rally length, suggesting that asymmetry on the vertical edges compared with the middle was linked to poorer gameplay performance. In line with this, (J) displays the calculated deviation from symmetry in activity between motor regions during gameplay and finds a significant negative association, where greater asymmetry was linked to lower average rally lengths. Similarly, during gameplay the activity in the sensory (K), motor region 1 (L), and motor region 2 (M) all showed significant positive correlations with average rally length.

Comment in

References

    1. Attinger A., Wang B., Keller G.B. Visuomotor Coupling Shapes the Functional Development of Mouse Visual Cortex. Cell. 2017;169:1291–1302.e14. doi: 10.1016/j.cell.2017.05.023. - DOI - PubMed
    1. Bakkum D.J., Chao Z.C., Potter S.M. Spatio-temporal electrical stimuli shape behavior of an embodied cortical network in a goal-directed learning task. J. Neural. Eng. 2008;5:310–323. doi: 10.1088/1741-2560/5/3/004. - DOI - PMC - PubMed
    1. Bakkum D.J., Chao Z.C., Potter S.M. Long-Term Activity-Dependent Plasticity of Action Potential Propagation Delay and Amplitude in Cortical Networks. PLoS One. 2008;3:e2088. doi: 10.1371/journal.pone.0002088. - DOI - PMC - PubMed
    1. Baranes K., Chejanovsky N., Alon N., Sharoni A., Shefi O. Topographic cues of nano-scale height direct neuronal growth pattern. Biotechnol. Bioeng. 2012;109:1791–1797. doi: 10.1002/bit.24444. - DOI - PubMed
    1. Barber R.D., Harmer D.W., Coleman R.A., Clark B.J. GAPDH as a housekeeping gene: analysis of GAPDH mRNA expression in a panel of 72 human tissues. Physiol. Genomics. 2005;21:389–395. doi: 10.1152/physiolgenomics.00025.2005. - DOI - PubMed

LinkOut - more resources