. 2022 Oct 24;57(20):2381-2396.e13.
doi: 10.1016/j.devcel.2022.09.011. Epub 2022 Oct 12.

Loss of non-motor kinesin KIF26A causes congenital brain malformations via dysregulated neuronal migration and axonal growth as well as apoptosis

Affiliations

Loss of non-motor kinesin KIF26A causes congenital brain malformations via dysregulated neuronal migration and axonal growth as well as apoptosis

Xuyu Qian et al. Dev Cell. .

Abstract

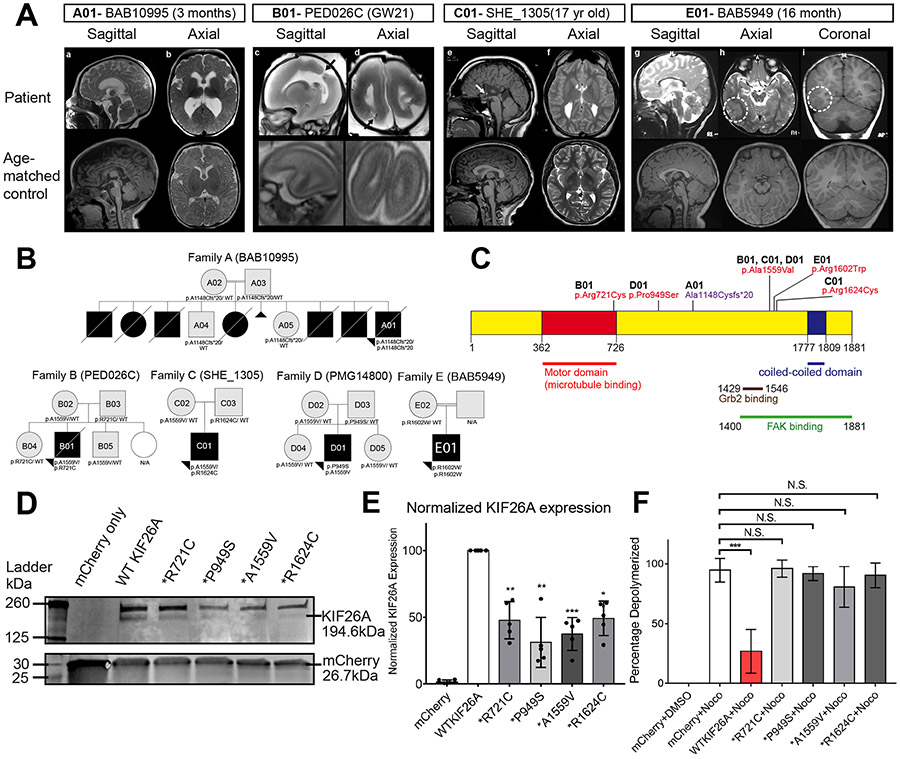
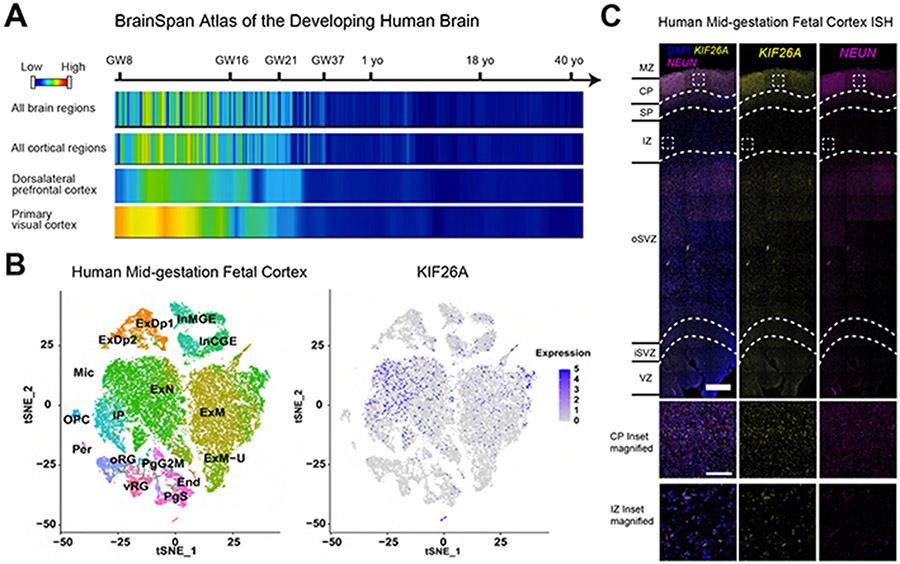
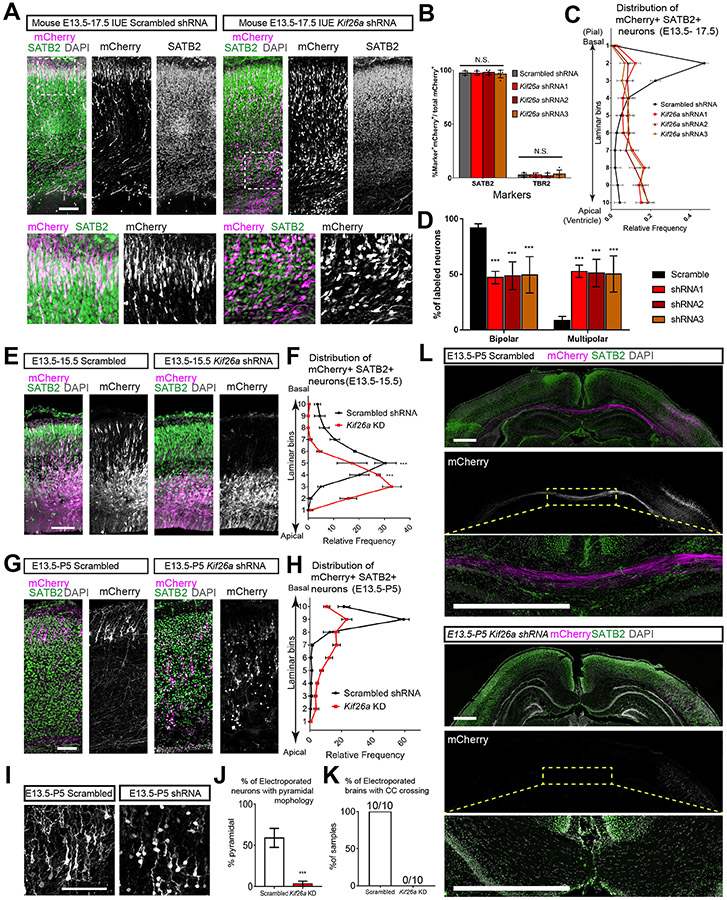
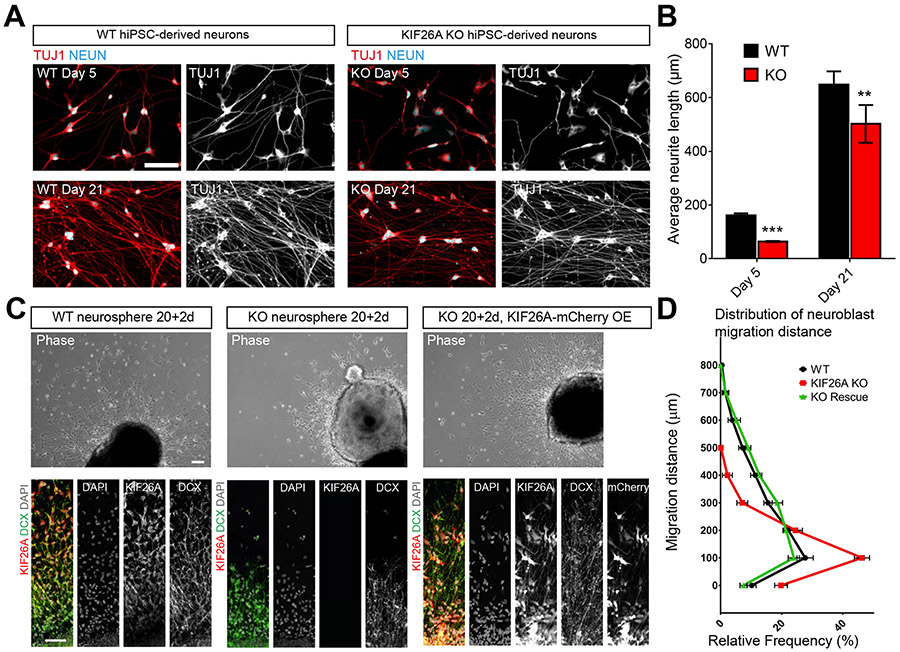
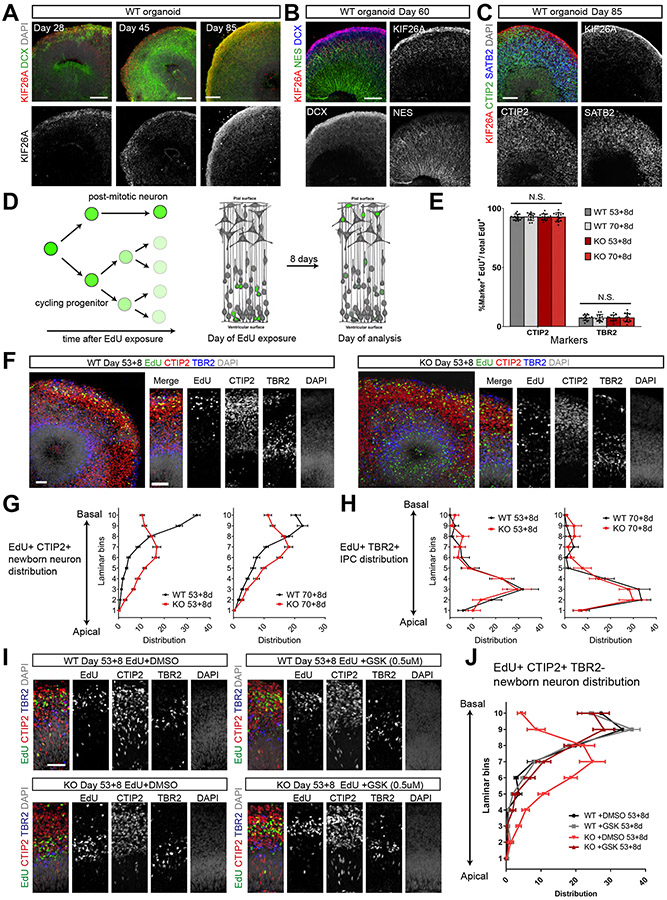
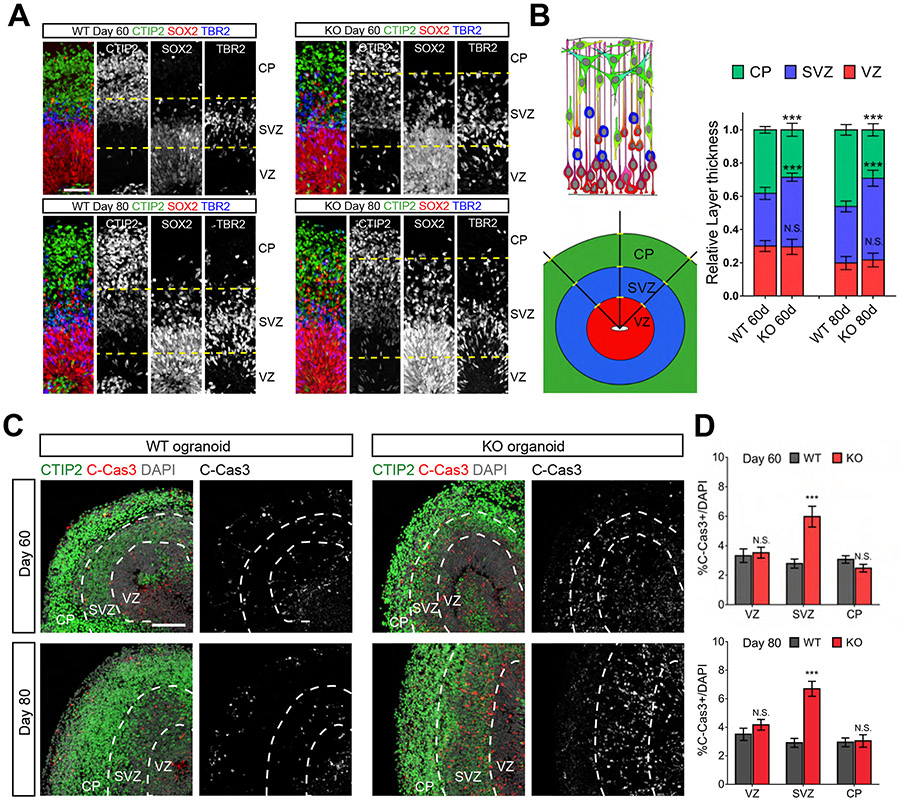
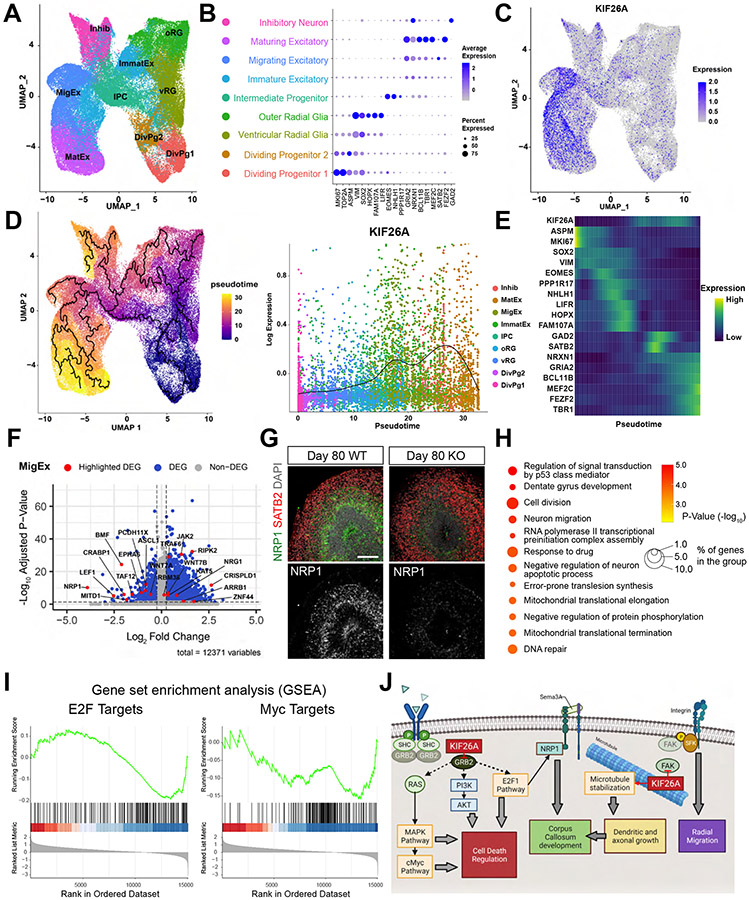
Kinesins are canonical molecular motors but can also function as modulators of intracellular signaling. KIF26A, an unconventional kinesin that lacks motor activity, inhibits growth-factor-receptor-bound protein 2 (GRB2)- and focal adhesion kinase (FAK)-dependent signal transduction, but its functions in the brain have not been characterized. We report a patient cohort with biallelic loss-of-function variants in KIF26A, exhibiting a spectrum of congenital brain malformations. In the developing brain, KIF26A is preferentially expressed during early- and mid-gestation in excitatory neurons. Combining mice and human iPSC-derived organoid models, we discovered that loss of KIF26A causes excitatory neuron-specific defects in radial migration, localization, dendritic and axonal growth, and apoptosis, offering a convincing explanation of the disease etiology in patients. Single-cell RNA sequencing in KIF26A knockout organoids revealed transcriptional changes in MAPK, MYC, and E2F pathways. Our findings illustrate the pathogenesis of KIF26A loss-of-function variants and identify the surprising versatility of this non-motor kinesin.

Keywords: apoptosis; cerebral cortex; congenital brain malformation; corpus callosum; development; genetics; kinesin; migration; organoid.


Conflict of interest statement

Declaration of interests J.R.L. has stock ownership in 23andMe, is a paid consultant for the Regeneron Genetics Center, and is a co-inventor on multiple United States and European patents related to molecular diagnostics for inherited neuropathies, eye diseases, and bacterial genomic fingerprinting. The Department of Molecular and Human Genetics at Baylor College of Medicine receives revenue from clinical genetic testing conducted at Baylor Genetics (BG) Laboratories, and J.R.L. is a member of the Scientific Advisory Board of BG. C.A.W. has stock ownership in Maze Therapeutics and is a paid consultant for Third Rock Ventures and Flagship Pioneering.

Figures

Figure 1.
Figure 1.. Biallelic Variants in KIF26A Associated with Congenital Brain Malformations Disrupt Protein Expression and Function.
(A) MRI images showing brain abnormalities in human subjects with biallelic KIF26A variants (top) and plane-matched images from age-matched control brains(bottom). Sagittal (a) and axial (b) T2-weighted images of subject A01 at 3 months of age demonstrate reduced cerebral white matter volume (notably the corpus callosum (CC)) with supratentorial ventriculomegaly and cerebral atrophy. Sagittal (c) and axial (d) T2 weighted postmortem brain MRI of B01 (pregnancy ended at gestational week (GW) 21) demonstrate full thickness defects affecting the parietal lobes (black arrows). Note that tissue decomposition/swelling distorts brain morphology. Sagittal T1 (e) and axial T2 (f) images of subject C01 at 17 years of age demonstrate complete agenesis of the CC with preservation of the anterior commissure (white arrow) and colpocephaly. Mid-sagittal T2 weighted (g), axial T2 weighted (h), and coronal T1 weighted images (i) of subject E01 demonstrate increased thickness, gyral frequency, and haziness of the inferior right temporal cortex (circled in h and i) consistent with cortical dysplasia and polymicrogyria, with thinning of the CC (g). (B) Family pedigrees of affected individuals. Square, male; circle, female; black shading, affected (or presumably affected, not genotyped) individual. Those individuals who were genotyped are labeled. Double horizontal lines indicate consanguineous parents. “NA” indicates genotype information was not available. See also, Table S1. (C) Protein domains of KIF26A. Variants from affected individuals are annotated on the corresponding amino acid positions. (D) Western blot of transfected HEK293T lysate showing expression of KIF26A and mCherry tag upon transfection of WT and patient variant KIF26A expression plasmids. Note that the lower molecular weight band of KIF26A is of the correct molecular size of KIF26A protein (194.6kDa) and is therefore considered the authentic band used in quantification. (E) Quantification of relative expression levels of WT and variant KIF26A from Western blots on HEK293T cells transfected with expression plasmids. mCherry expressed from the same plasmids is used to normalize the differences in transfection efficiency. Dots represent independent biological replicates, bars represent Mean ± S.D. (n = 5 independent experiments. Student’s t-test: **, p < 0.005, ***, p < 0.0005). (F) Microtubule depolymerization assay on SHSY5H cells transfected with WT and variant KIF26A. Shown is the quantification for the percentage of transfected cells exhibiting Nocodazole (Noco)-induced microtubule depolymerization acutely after 15 minutes of 10μM Noco treatment. Values represent Mean ± S.D. (n = 10 areas of view for each condition. Student’s t-test: ***, p < 0.0005, N.S., not significant). See also Figures S1, S2 and Table S1.
Figure 2.
Figure 2.. KIF26A is Preferentially Expressed by Migrating Excitatory Neurons in the Developing Cerebral Cortex.
(A) Relative expression of KIF26A throughout human embryonic and postnatal brain development. Development progresses temporally from left to right, with key developmental times annotated on the axis. GW, gestational week; yo, year old (after birth). Data obtained from BrainSpan Atlas of the Developing Human Brain (Miller et al., 2014). (B) Cell-type clusters (left) and feature plot showing KIF26A expression (right) in human GW17-18 fetal cortex single-cell RNA-seq. Dataset and cluster annotations obtained from Polioudakis et al., 2019. The clustering and annotation from the original publication are kept unchanged. End, endothelial cells; PgS, progenitors in S phase; PgG2M, progenitors in G2M phase; vRG, ventricular radial glia; oRG, outer radial glia; Per, pericytes; OPC, oligodendrocyte precursor cells; IP, intermediate progenitor; ExN, migrating excitatory neurons; ExM, maturing excitatory neurons; ExM-U, maturing upper layer excitatory neurons; ExDp, deep layer excitatory neurons; InMGE, medial ganglionic eminence interneurons; InCGE, caudal ganglionic eminence interneurons. (C) In situ hybridization for KIF26A and RBFOX3(NeuN) on GW22 medial cortex. Bottom shows magnified view of the CP and the IZ indicated by the squares. Hybridization the CP and IZ is consistent with scRNAseq data suggesting expression in migrating and maturing excitatory neurons. Scale bars = 500μm (top), = 100 μm (bottom). MZ, marginal zone; CP, cortical plate; SP, subplate; IZ, intermediate zone; oSVZ, outer subventricular zone; iSVZ, inner subventricular zone; VZ, ventricular zone.
Figure 3.
Figure 3.. Kif26a Regulates Neuronal Radial Migration, Terminal Localization, Morphology and Corpus Callosum Development.
(A) Representative images of in utero electroporation (IUE) of control scrambled shRNA (left) and Kif26a shRNA (right) in mouse cortex at E13.5 and analyzed at E17.5 (E13.5-17.5, 4 days post electroporation). Bottom magnified view show electroporated cells are SATB2+ neurons. Scale bars = 100μm. (B) Quantification of the percentage of mCherry-labeled cells expressing neuronal marker SATB2 or IPC marker TBR2. Values represent Mean ± S.D. (n = 5 brains for scrambled, n = 4 for shRNA1, n=6 for shRNA2, n = 5 for shRNA3. Student’s t-test: N.S., not significant). (C) Quantification of the laminar distributions of electroporated neurons in the cortex for E13.5-17.5. The cortex was evenly divided into 10 bins from basal (bin 1) to apical (bin 10) surfaces and the cell distribution was normalized by the total number of electroporated cells in the analyzed area. Only mCherry+, SATB2+ neurons are quantified. Values represent Mean ± S.D. (n = 7 brains for scrambled, n = 6 for shRNA1 and shRNA2, n = 5 for shRNA3). (D) Quantification of the percentage of labeled neurons displaying bipolar or multipolar morphology, showing loss of bipolar morphology with Kif26a deficient neurons. Values represent Mean ± S.D. (Same samples as (C). Student’s t-test: **, p < 0.005; ***, p < 0.0005). (E) Representative images of IUE in mouse cortex at E13.5 and analyzed at E15.5 (E13.5-15.5, 2 days post electroporation). Scale bar = 100μm. (F) Quantification of the laminar distributions of electroporated neurons in the cortex for E13.5-15.5. Similar to (C). Only mCherry+, SATB2+ neurons are quantified. Values represent Mean ± S.D. (n = 7 brains for scrambled, n = 4 for shRNA KD. Student’s t-test: ***, p < 0.0005). (G) Representative images of IUE in mouse cortex at E13.5 and analyzed at P5 (E13.5-P5, 10 days post electroporation). Scale bar = 100μm. (H) Quantification of the laminar distributions of electroporated neurons in the cortex for E13.5-P5. Similar to (C). Only mCherry+, SATB2+ neurons are quantified. Values represent Mean ± S.D. (n = 10 brains). (I) Representative magnified images showing morphology of electroporated neurons at P5. Scale bar = 100μm. (J) Quantification of the percentage of electroporated neurons exhibiting pyramidal morphology at P5. Pyramidal morphology is defined as neurons having 1 basal dendrite and at least 2 apical dendrites from the soma. Values represent Mean ± S.D. (n = 10 brains. Student’s t-test: ***, p < 0.0005). (K) Quantification of the percentage of P5 brains with electroporated axons crossing the corpus callosum (CC). All (10 out of 10) scrambled shRNA brains showed CC crossing, while none (0 out of 10) of Kif26a KD brains showed CC crossing. (L) Representative images showing electroporated neurons send axons across the corpus callosum to the contralateral hemisphere only in scrambled control (top), but not in Kif26a KD (bottom). Insets show magnified view of selected areas. Scale bar = 500μm. See also Figures S3 and S4.
Figure 4.
Figure 4.. KIF26A KO Disrupts Neurite Outgrowth and Motility in Human iPSC-derived Neurons
(A) Representative images of neurons differentiated from control (WT) and KIF26A KO (KO) hiPSCs at Day 5 and Day 21 showing shorter neurites of KIF26A KO neurons. Scale bar = 100μm. (B) Quantification of the average neurite length of WT and KO neurons shows reduced neurite outgrowth in KIF26A KO neurons. Average neurite length is calculated by dividing the total neurite length within a field of view to the number of NeuN+ neurons measured by an automated module. Values represent Mean± S.D. (n = 4 plates for WT, n = 8 plates for KO from two iPSC lines. Student’s t-test: **, p < 0.005; ***, p < 0.0005). (C) Phase contrast (top) and immunostaining (bottom) images of hiPSC-derived neurospheres 2 days after plating show reduced migration in KIF26A deficient neurons. Also shown on the right is KO neurosphere infected with lentivirus to express KIF26A-mCherry exogenously (rescue). Scale bars = 100μm (top), = 50μm (bottom). (D) Quantification of the distances migrating neuroblasts traveled away from the border of the neurosphere 2 days after plating. Values represent Mean± S.D. (n = 20 neurospheres from two pairs of WT and KO iPSC lines). See also Figure S5.
Figure 5.
Figure 5.. KIF26A KO Forebrain Organoids Exhibit Radial Migration Defects that Can Be Rescued by FAK Inhibition.
(A-C) Representative images showing KIF26A is expressed by neurons but not progenitors in control forebrain organoids at various developmental stages. Scale bars = 100μm. (D) Schematic of the EdU pulse-chase strategy to track neuronal migration in forebrain organoids. After initial EdU exposure (1μM for 1hr), the EdU bond to DNA in dividing progenitors got diluted with each cell division. As a result, the cells displaying strong EdU detection intensity 8 days later were post-mitotic neurons born at the first cell division at the time of EdU exposure. Also see STAR Methods. (E) Quantification of the percentage of EdU-labeled cells expressing neuronal marker CTIP2 or IPC marker TBR2. Values represent Mean ± S.D. (n = 20 organoids, Student’s t-test: N.S., not significant). (F) Representative images showing the laminar distribution of EdU labeled cells in WT (left) and KO (right) forebrain organoids. Scale bars = 50μm. (G) Quantification of the laminar distribution of EdU-labeled CTIP2+ TBR2 neurons in WT and KO forebrain organoids shows defective migration in KIF26A KO organoids. The cortical structure of organoids is divided evenly into 10 bins from basal (bin 10) to apical (bin 1) surfaces. Only Edu+, CTIP2+ and TBR2 cells are counted to ensure counted cells are migrating neurons exclusively. Values represent Mean ± S.D. (n = 20 organoids from two pairs of isogenic lines). (H) Quantification of the laminar distribution of EdU-labeled TBR2+ CTIP2 IPCs in WT and KO forebrain organoids shows normal IPC localization. Values represent Mean ± S.D., same samples as in (G). (I) Representative images showing 8 days of 0.5μM FAK inhibitor GSK2256098(GSK) treatment rescued the laminar distribution of EdU-labeled neurons in KO organoids to resemble the localization in WT organoids. WT and KO forebrain organoids were treated with either DMSO or GSK during the 8-day chase period after EdU labeling at Day 53. Scale bar = 50μm. (J) Quantification of the laminar distribution of EdU-labeled CTIP2+ TBR2 neurons in WT and KO forebrain organoids with and without GSK treatment. Values represent Mean ± S.D. (n = 10 organoids). See also Figures S6 and S7.
Figure 6.
Figure 6.. KIF26A KO Forebrain Organoids Exhibit Altered Lamination and Elevated Apoptotic Cell Death.
(A) Representative images showing the defective laminar organization in KIF26A KO forebrain organoids compared to WT. Dashed lines help to illustrate the borders between CP, SVZ and VZ. Scale bars = 50μm. (B) Quantitation of relative layer thickness in WT and KO organoids shows enlarged SVZ and reduced CP in KIF26A KO organoids. Left, schematics showing the measurement of layer thickness. For each cortical structure, three measurements were taken at 45° angle pointing towards the basal surface and taken average for the quantification. Values represent Mean ± S.D. (n=20 organoids from two pair of isogenic lines. Student’s t-test: N.S., not significant; ***, p < 0.0005). (C) KO organoids show elevated apoptosis at Day 60 and 80. Dashed lines delineate the borders between the CP, SVZ and VZ. Scale bar = 100μm. (D) Quantification of the density of apoptotic cells in the VZ, SVZ and CP layers of WT and KO organoids. Values represent Mean ± S.D. (n = 20 organoids from two pairs of isogenic lines. Student’s t-test, ***, p < 0.0005; N.S., no significant difference). See also Figure S7.
Figure 7.
Figure 7.. Loss of KIF26A Leads to Transcriptional Changes in Forebrain Organoids.
(A) Graph-based clustering of single cells from WT and KO brain organoids at Day 60 and Day 90 (n=46,776 cells for WT, n= 36,645 cells for KO). DivPg, dividing progenitors; vRG and oRG, ventricular and outer radial glia; IPC, intermediate progenitor cells; Inhib, inhibitory neurons; ImmatEx, immature excitatory neurons; MigEx, migrating excitatory neurons; MatEx, maturing excitatory neurons. (B) The expression of selected well-known marker genes used for cell type classification. (C) UMAP feature plot showing KIF26A expression is enriched in MigEx and MatEx clusters. (D) Pseudotime analysis showing the developmental trajectory (left) calculated using Monocle 3. Right, KIF26A expression ordered by pseudotime. Dots represent individual cells colored based on cluster. Trend-line shows KIF26A expression as function of pseudotime, calculated by fitting a quasipoisson model to the data. (E) Expression of well-known marker genes across the pseudotime trajectory. (F) Volcano plot showing differentially expressed genes (DEGs) between WT and KO cells in migrating excitatory neurons. Significant DEGs with adjusted p-value < 0.05, and Log2 fold change > 0.25 or < −0.25, are shown in blue. Selected DEGs involved in neuronal survival and apoptosis are highlighed in red. (G) Immunostaining validating decreased NRP1 expression in KO organoid. Scale bar = 100μm. (H) Gene ontology (GO) analysis (FDR<0.05) of 348 significantly downregulated (adjusted p-value< 0.05, Log2 fold change < −1) genes in KO migrating excitatory neurons compared to WT. Size and color of the bubbles represent the proportion of commonly dysregulated genes enriched in each pathway and the significance of enrichment, respectively. (I) Gene set enrichment analysis (GSEA) enrichment score curves showing downregulation of E2F and Myc pathways in KO migrating and maturing excitatory neurons compared to WT. Hallmark Gene Sets from MSigDB Collections were included for the analysis. (J) Schematic illustration of proposed molecular mechanisms, by which KIF26A modulates radial migration, dendritic and axonal development and apoptosis in excitatory neurons. See also Figure S8.

References

    1. An L, Li W, Hu X, Zhang W, and Zhao S (2018). Abundant Focal Adhesion Kinase Causes Aberrant Neuronal Migration Via Its Phosphorylation at Tyr925. J Mol Neurosci 64, 102–110 DOI: 10.1007/s12031-017-1010-1. - DOI - PubMed
    1. Asselin L, Rivera Alvarez J, Heide S, Bonnet CS, Tilly P, Vitet H, Weber C, Bacino CA, Baranano K, Chassevent A, et al. (2020). Mutations in the KIF21B kinesin gene cause neurodevelopmental disorders through imbalanced canonical motor activity. Nat Commun 11, 2441 DOI: 10.1038/s41467-020-16294-6. - DOI - PMC - PubMed
    1. Bahi-Buisson N, Poirier K, Fourniol F, Saillour Y, Valence S, Lebrun N, Hully M, Bianco CF, Boddaert N, Elie C, et al. (2014). The wide spectrum of tubulinopathies: what are the key features for the diagnosis? Brain 137, 1676–1700 DOI: 10.1093/brain/awu082. - DOI - PubMed
    1. Bershteyn M, Nowakowski TJ, Pollen AA, Di Lullo E, Nene A, Wynshaw-Boris A, and Kriegstein AR (2017). Human iPSC-Derived Cerebral Organoids Model Cellular Features of Lissencephaly and Reveal Prolonged Mitosis of Outer Radial Glia. Cell Stem Cell 20, 435–449 e434 DOI: 10.1016/j.stem.2016.12.007. - DOI - PMC - PubMed
    1. Besset V, Scott RP, and Ibanez CF (2000). Signaling complexes and protein-protein interactions involved in the activation of the Ras and phosphatidylinositol 3-kinase pathways by the c-Ret receptor tyrosine kinase. J Biol Chem 275, 39159–39166 DOI: 10.1074/jbc.M006908200. - DOI - PubMed

Publication types

Substances