. 2022 Dec;612(7938):156-161.
doi: 10.1038/s41586-022-05412-7. Epub 2022 Oct 13.

Structural principles of B cell antigen receptor assembly

Affiliations

Structural principles of B cell antigen receptor assembly

Ying Dong et al. Nature. 2022 Dec.

Abstract

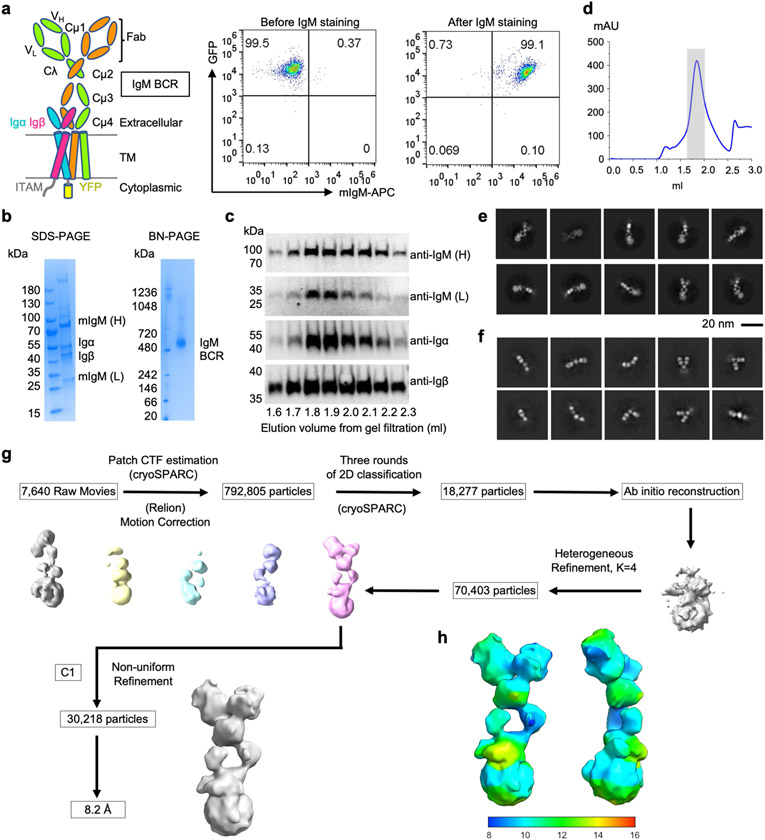
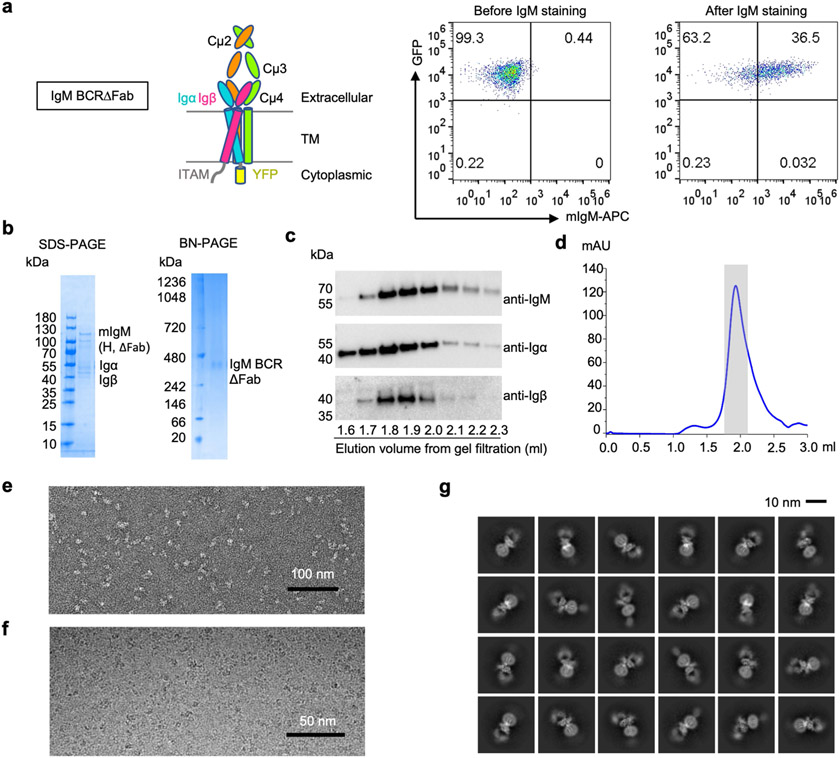
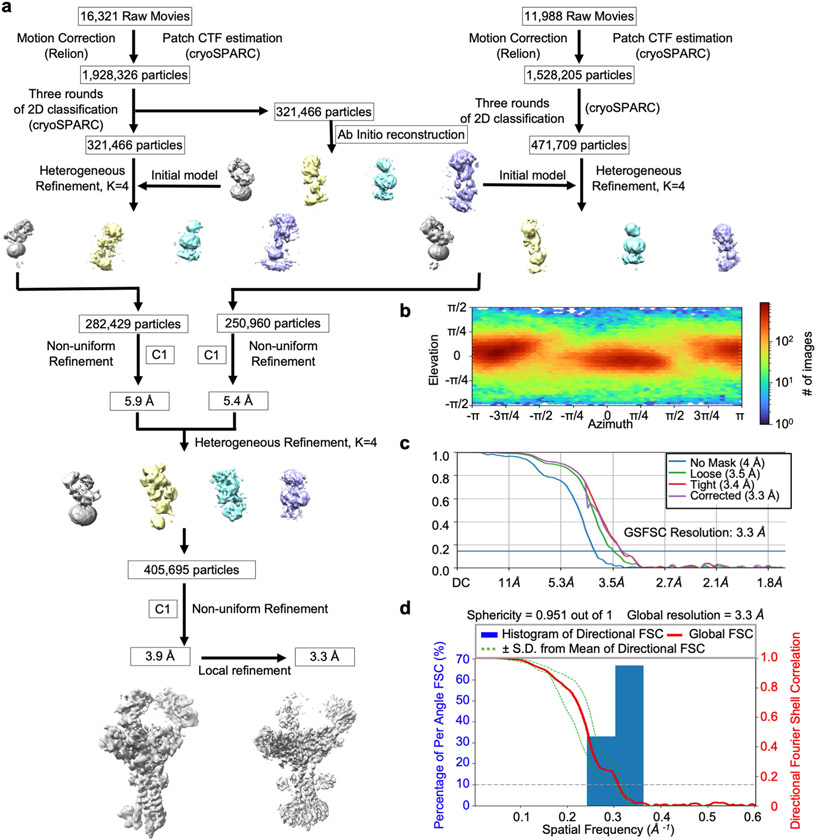
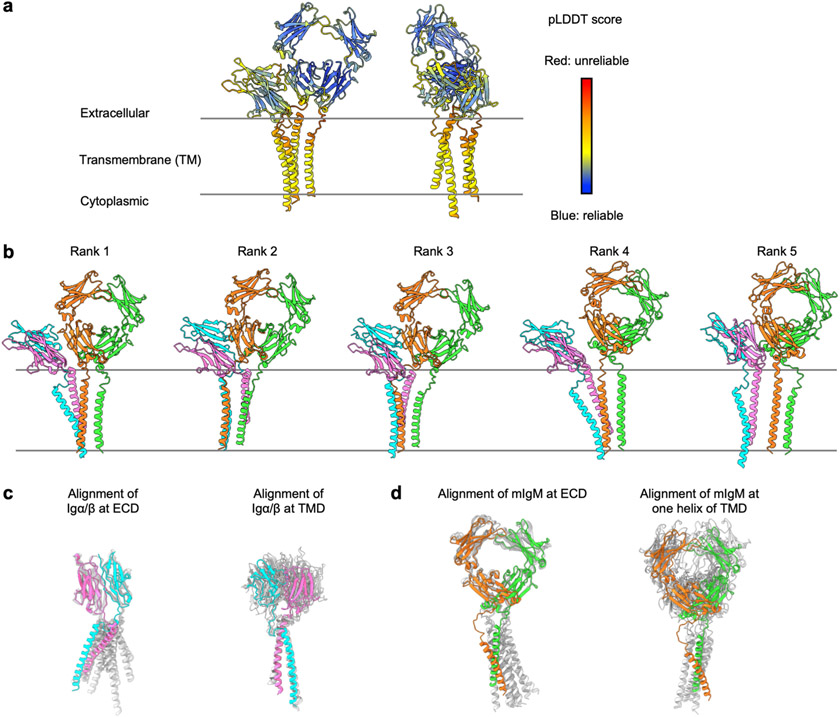
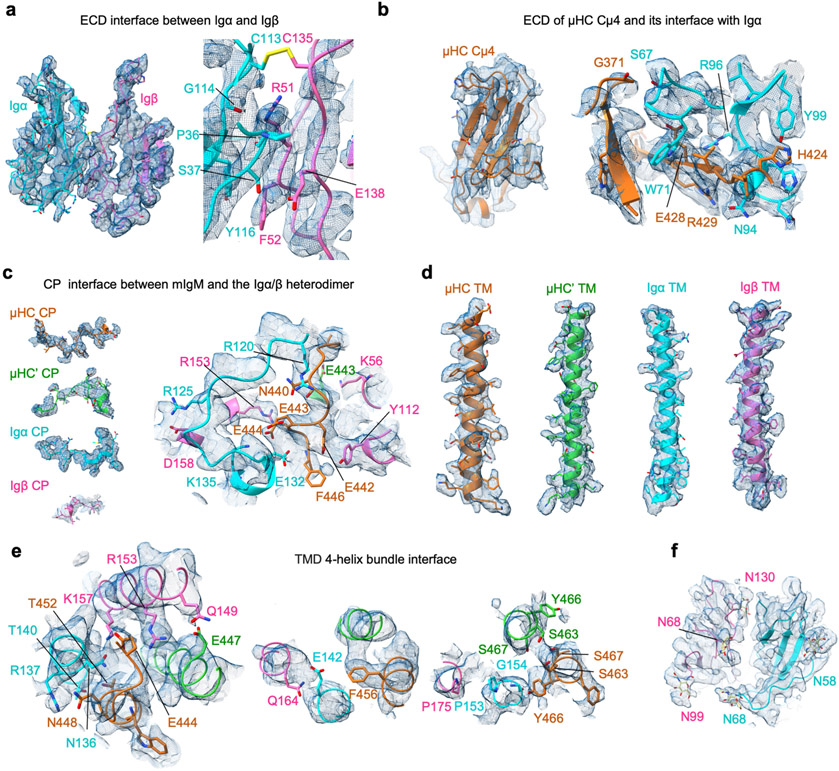
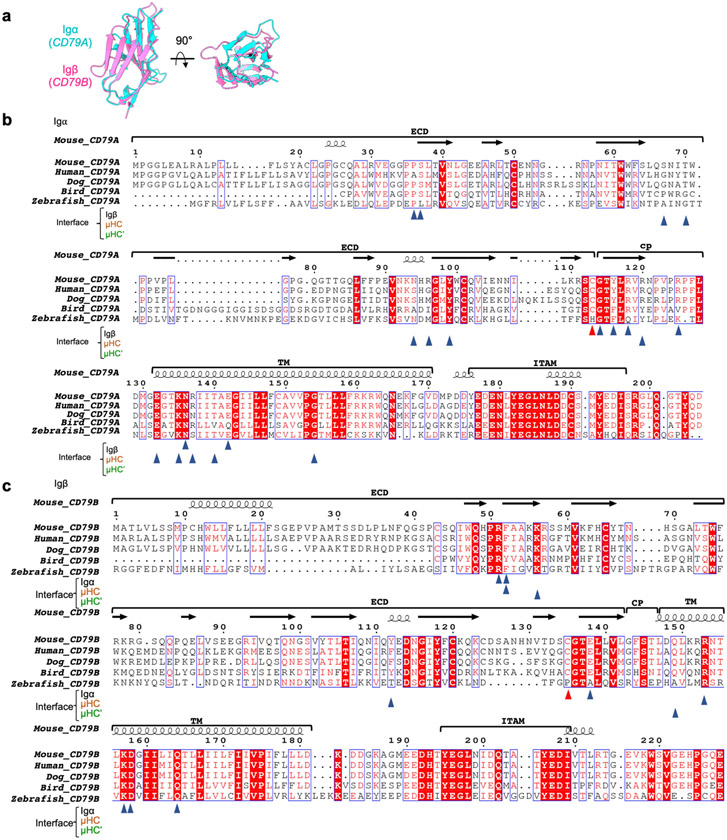
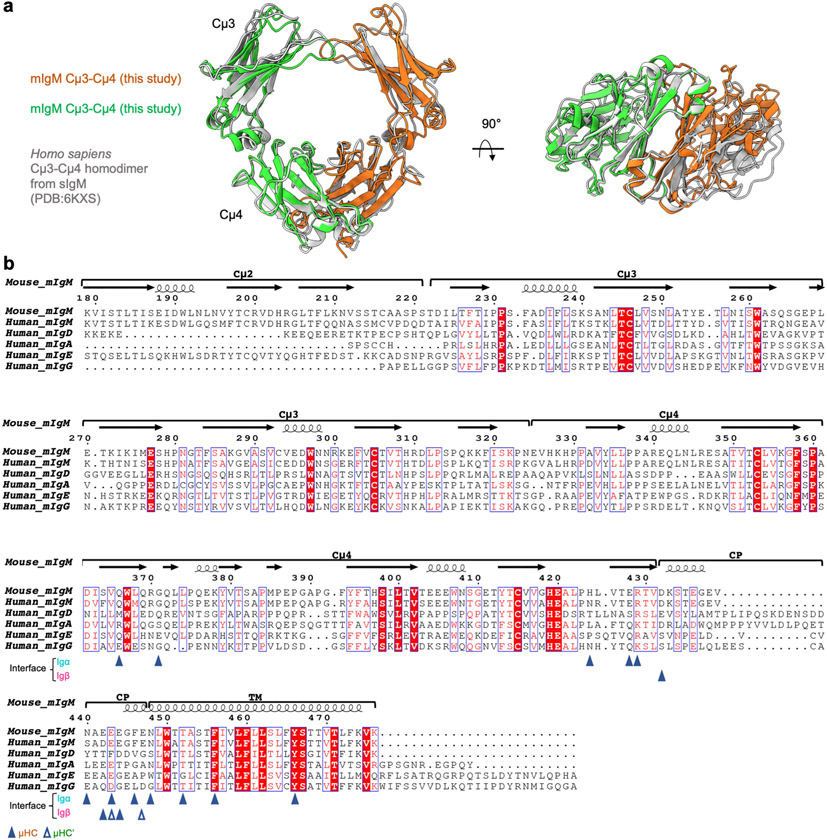
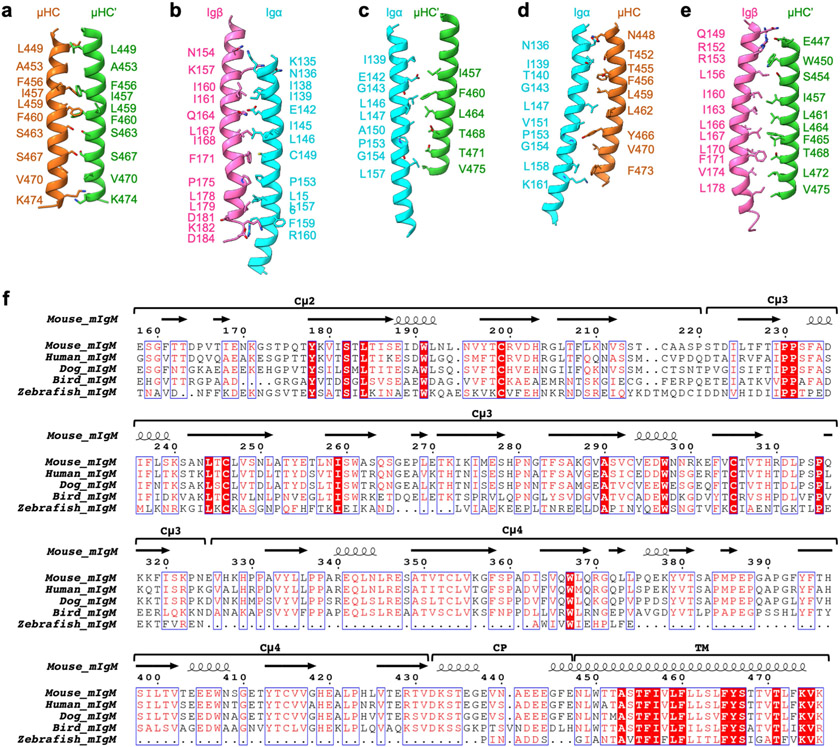
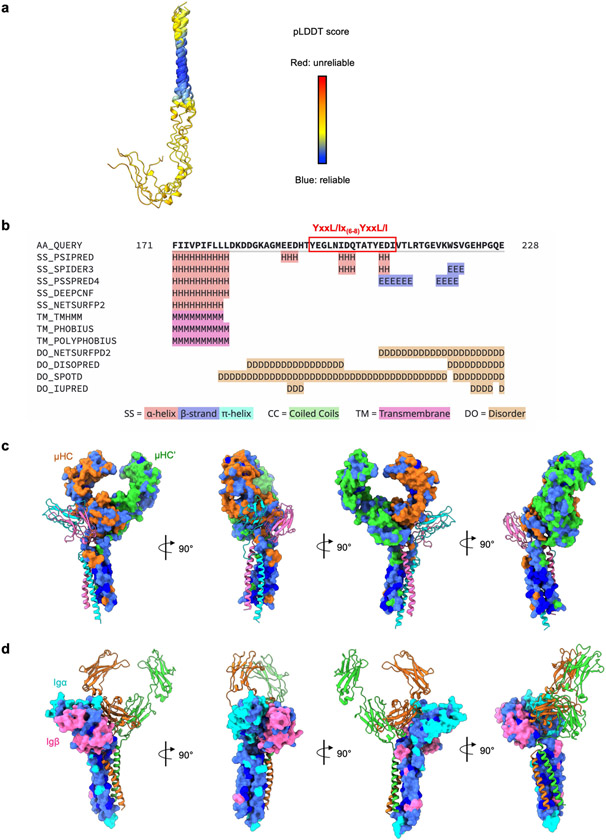
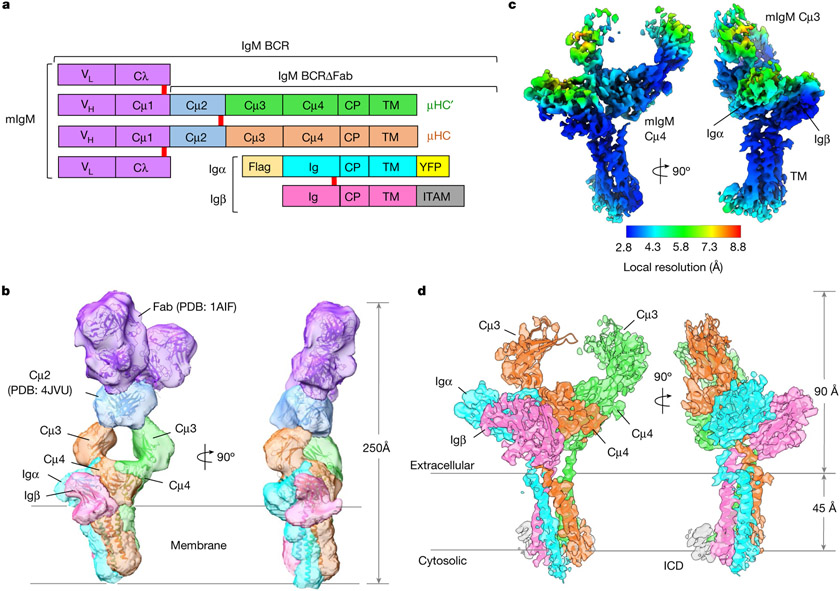
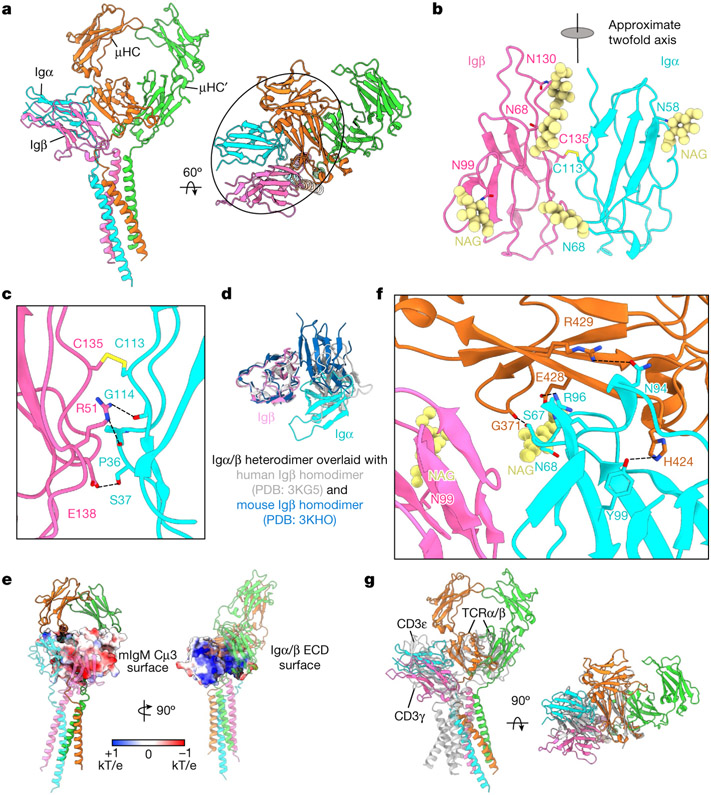
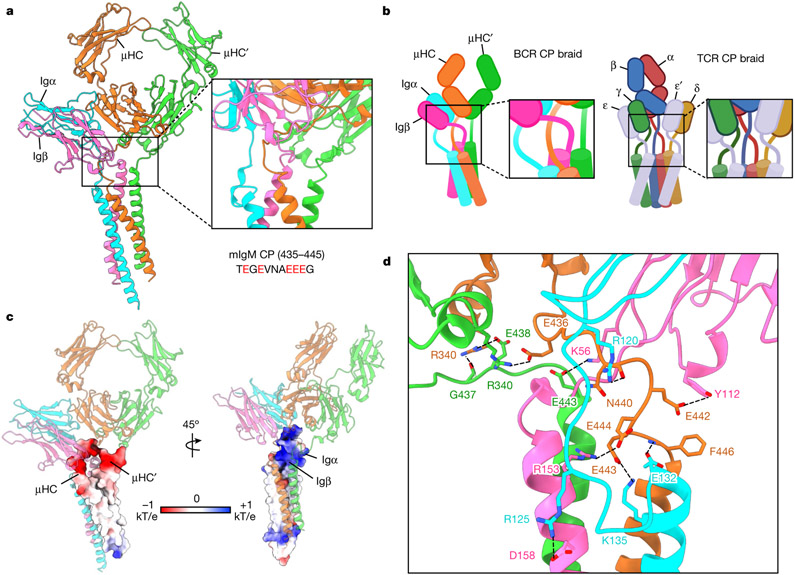
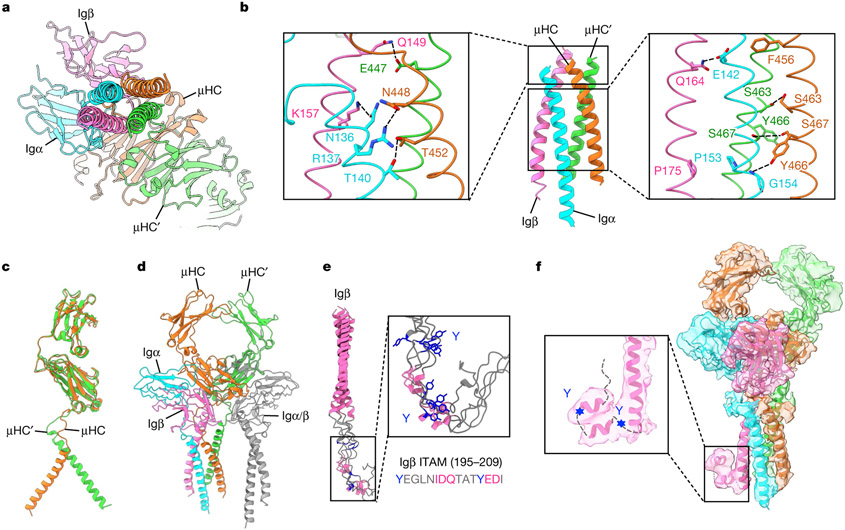
The B cell antigen receptor (BCR) is composed of a membrane-bound class M, D, G, E or A immunoglobulin for antigen recognition1-3 and a disulfide-linked Igα (also known as CD79A) and Igβ (also known as CD79B) heterodimer (Igα/β) that functions as the signalling entity through intracellular immunoreceptor tyrosine-based activation motifs (ITAMs)4,5. The organizing principle of the BCR remains unknown. Here we report cryo-electron microscopy structures of mouse full-length IgM BCR and its Fab-deleted form. At the ectodomain (ECD), the Igα/β heterodimer mainly uses Igα to associate with Cµ3 and Cµ4 domains of one heavy chain (µHC) while leaving the other heavy chain (µHC') unbound. The transmembrane domain (TMD) helices of µHC and µHC' interact with those of the Igα/β heterodimer to form a tight four-helix bundle. The asymmetry at the TMD prevents the recruitment of two Igα/β heterodimers. Notably, the connecting peptide between the ECD and TMD of µHC intervenes in between those of Igα and Igβ to guide TMD assembly through charge complementarity. Weaker but distinct density for the Igβ ITAM nestles next to the TMD, suggesting potential autoinhibition of ITAM phosphorylation. Interfacial analyses suggest that all BCR classes utilize a general organizational architecture. Our studies provide a structural platform for understanding B cell signalling and designing rational therapies against BCR-mediated diseases.


Figures

Extended Data Fig. 1 ∣
Extended Data Fig. 1 ∣. Protein purification and cryo-EM data processing of full-length IgM BCR.
a, Selection of J558L B cells that expressed IgM BCR. Domain organization of IgM BCR and surface expression of IgM (APC) and Igα (GFP) by flow cytometry are shown. b-c, Purification of IgM BCR shown by SDS-PAGE, Blue-native (BN) PAGE and western blotting using antibodies against the individual subunits. H: heavy chain; L: light chain. d, Gel filtration profiles of IgM BCR. The peak of IgM BCR is shaded in grey. e-f, Representative 2D classes of IgM BCR (e) and specifically at its Fab region (f). g-h, Data processing flow chart (g) and local resolution distribution of IgM BCR (h).
Extended Data Fig. 2 ∣
Extended Data Fig. 2 ∣. Protein purification, raw images and 2D classifications of IgM BCRΔFab.
a, Selection of J558L B cells that expressed IgM BCRΔFab. Domain organization of IgM BCRΔFab and surface expression of IgM (APC) and Igα (GFP) by flow cytometry are shown. b-c, Purification of IgM BCRΔFab shown by SDS-PAGE, Blue-native (BN) PAGE and western blotting using antibodies against the individual subunits. H: heavy chain. d, Gel filtration profiles of IgM BCRΔFab. The peak of IgM BCRΔFab is shaded in grey e-f, Representative negative staining EM image (e) and cryo-EM image of IgM BCRΔFab (f). g, Representative 2D classes of IgM BCRΔFab.
Extended Data Fig. 3 ∣
Extended Data Fig. 3 ∣. Cryo-EM data processing of IgM BCRΔFab.
a, Cryo-EM data processing flow chart of the 3.9 Å intermediate cryo-EM map and the 3.3 Å final cryo-EM map of IgM BCRΔFab. b, Angular distribution of the particles used for the final reconstruction shown as a heat map. c, Fourier shell correlation (FSC) plots. d, 3D FSC plot.
Extended Data Fig. 4 ∣
Extended Data Fig. 4 ∣. AlphaFold predicted models of IgM BCR.
a, The top ranked model of IgM BCR (without Fab and Cμ2) predicted by AlphaFold, coloured by per-residue pLDDT score. b, Five predicted models of IgM BCR. c, Alignment of the five models of the Igα/β heterodimer at ECD (left) and TMD (right), showing consistent prediction of the ECD interaction (left) and the TMD interaction (right) separately. The CPs of the Igα/β heterodimer were not predicted correctly. d, Alignment of the five models of mIgM at ECD (left) and TMD (right) superimposed with IgM BCRΔFab model, showing consistent prediction of the ECD interaction (left) but incorrect prediction of the TMD interaction (right). The CPs of the mIgM dimer were not predicted correctly. In (c) and (d), the experimentally determined subunits of the IgM BCRΔFab model are shown in their model colours and AlphaFold predicted models are shown in grey.
Extended Data Fig. 5 ∣
Extended Data Fig. 5 ∣. Model fitting of IgM BCRΔFab in the 3.3 Å cryo-EM map (contour level: 4.0 σ).
a, Ig regions of Igα and Igβ for the Igα/β interaction superimposed with the cryo-EM map. b, Interface between μHC Cμ4 and Igα superimposed with the cryo-EM map. c, Four connecting peptide regions from μHC, μHC’, Igα and Igβ superimposed with the cryo-EM map. Acidic and basic residues are shown and labelled. d-e, TMD helices of μHC, μHC′, Igα and Igβ superimposed with the cryo-EM map (d). Key residues mediating the TMD interaction are shown (e). f, The fitting of five glycosylation sites on the Igα/Igβ heterodimer.
Extended Data Fig. 6 ∣
Extended Data Fig. 6 ∣. Structural and sequence alignment of Igα and Igβ.
a, Structural alignment between the Ig domains of Igα and Igβ (3.2 Å RMSD). b-c, Sequence alignment of Igα (b) and Igβ (c) among different species. Residues at the interface of Igα/β with μHC and μHC’ are indicated by triangle symbols. Igα C113 and Igβ C135 are marked by red triangle symbols.
Extended Data Fig. 7 ∣
Extended Data Fig. 7 ∣. Structural and sequence alignment of mIg.
a, Structural alignment of the Cμ3-Cμ4 homodimer of IgM BCR with that from the crystal structure of secreted IgM or sIgM (3.1 Å RMSD, PDB: 6KXS). b, Sequence alignment of mIg among different isotypes. Residues at the interface of μHC and μHC’ with Igα/β are indicated by solid and hollow triangle symbols respectively.
Extended Data Fig. 8 ∣
Extended Data Fig. 8 ∣. Interaction at TMD and sequence alignment of mIgM.
a–e, The interactions between pairs of helices of TMD. f, Sequence alignment of mIgM among different species.
Extended Data Fig. 9 ∣
Extended Data Fig. 9 ∣. AlphaFold prediction and secondary structure prediction of Igβ, and sequence conservation mapping on the IgM-BCR surface.
a, AlphaFold prediction of Igβ. The TMD and ICD of Igβ were predicted, showing the pLDDT scores. b, Secondary structure prediction of Igβ (residue 171–228). The ITAM consensus motif is highlighted by red rectangle. c-d, Conserved residue distribution on the Cμ3-Cμ4 homodimer surface (c) and the Igα/Igβ heterodimer surface (d) according to sequence alignment among species. The most conserved residues are shown in dark blue, less conserved residues in light blue, and the remaining residues in their chain colours are defined in Fig. 1d.
Fig. 1 ∣
Fig. 1 ∣. Cryo-EM maps of the IgM BCR.
a, Domain organization of the IgM BCR. Disulfide bonds are shown as red rectangles. mIgM heavy chains μHC and μHC′ are proximal and distal to the Igα/β heterodimer, respectively. CP: connecting peptide. b, Cryo-EM map of full-length IgM BCR at 8.2 Å resolution (contour level: 0.5σ) superimposed with the model. c, Local resolution distribution of the IgM BCRΔFab map at 3.3 Å resolution (contour level: 4.0σ). d, Cryo-EM map of IgM BCRΔFab (contour level: 4.0σ) superimposed with the model. The Igβ ICD density is shown in grey.
Fig. 2 ∣
Fig. 2 ∣. ECD Interactions between the Igα/β heterodimer and mIgM.
a, Ribbon diagrams of the IgM BCRΔFab model in different views, with the ECD interactions circled. b, Ribbon diagram of the immunglobulin domains of the Igα/β heterodimer. The intersubunit disulfide bond between Igα C113 and Igβ C135 and the observed N-linked glycans are shown. The immunglobulin domains of Igα and Igβ are related by an approximate twofold axis. c, Detailed interfacial interactions between Igα and Igβ. d, Alignment of the immunglobulin domains of the Igα/β heterodimer with two different crystal structures of the Igβ homodimer, showing marked differences. e, Electrostatic surfaces (−1 to +1 kT/e) of the interacting Cμ4 (left) and the immunglobulin domains of the Igα/β heterodimer (right). f, Detailed interactions between ECD residues of the Igα/β heterodimer and the mIgM molecule. g, Alignment of the Cμ4 domain of IgM BCR with the TCRβ constant domain (grey), showing that the immunglobulin domains of the Igα/β and CD3ε–CD3γ (grey, PDB: 6JXR) heterodimers occupy the similar location relative to mIgM and TCRαβ, respectively.
Fig. 3 ∣
Fig. 3 ∣. CP interactions between the Igα/β heterodimer and mIgM.
a, Global view (left) and enlarged view (right) of the CP region of IgM BCR, showing the intertwining in this region. The sequence of mouse mIgM CP (435–445) is shown with acidic residues in red. b, Schematic diagrams for the CP assembly of BCR (left) and TCR (right). c, Electrostatic surfaces (−1 to +1 kT/e) at the CPs of mIgM (left) and the CPs of Igα and Igβ (right). d, Detailed interactions between the charged CP residues of the Igα/β heterodimer and mIgM.
Fig. 4 ∣
Fig. 4 ∣. TMD assembly of the IgM BCR.
a, Bottom view of the TMD assembly shown in ribbon. b, Key polar interactions at the TMD, including those at the membrane-proximal region (left) and within the membrane including the [E/Q] X10P motif on Igα and Igβ and the YS motif on mIgM (right). c, Structural alignment of μHC and μHC′ in an mIgM dimer, showing the different asymmetric conformation at the TMD. d, Structural alignment of a second Igα/β heterodimer to the empty side of the mIgM Cμ4 dimer showed the lack of interaction with the four-helix bundle of TMD, which may explain why the second Igα/β heterodimer is not recruited to the BCR. e, Ribbon diagrams of five top-ranked models of Igβ TMD and ICD predicted by AlphaFold, shown with a detailed view of the ITAM region. The two tyrosine (Y) residues at the Igβ ITAM (YxxL/lx(6–8)YxxL/I motif) and the two predicted short α-helices are shown in blue and pink, respectively. The short α-helices were also identified by secondary structure prediction. f, Fitting of an ITAM polyalanine model as an α-helical hairpin into the 3.9 Å intermediate cryo-EM map (contour level, 8.0σ). The hairpin and the foldback onto the Igβ TMD may keep the ITAM in an auto-inhibited form.

References

    1. Venkitaraman AR, Williams GT, Dariavach P & Neuberger MS The B-cell antigen receptor of the five immunoglobulin classes. Nature 352, 777–781 (1991). - PubMed
    1. Alber G, Flaswinkel H, Kim K-M, Weiser P & Reth M in Progress in Immunology Vol. VIII (eds Gergely J et al. ) 27–33 (Springer, 1993).
    1. Hombach J, Tsubata T, Leclercq L, Stappert H & Reth M Molecular components of the B-cell antigen receptor complex of the lgM class. Nature 343, 760–762 (1990). - PubMed
    1. Campbell KS & Cambier JC B lymphocyte antigen receptors (mIg) are non-covalently associated with a disulfide linked, inducibly phosphorylated glycoprotein complex. EMBO J. 9, 441–448 (1990). - PMC - PubMed
    1. Schamel WWA & Reth M Monomeric and oligomeric complexes of the B cell antigen receptor. Immunity 13, 5–14 (2000). - PubMed

Publication types

Substances