. 2023 Jan;29(1):147-157.
doi: 10.1038/s41591-022-02078-6. Epub 2022 Oct 13.

Human leukocyte antigen alleles associate with COVID-19 vaccine immunogenicity and risk of breakthrough infection

Collaborators, Affiliations

Human leukocyte antigen alleles associate with COVID-19 vaccine immunogenicity and risk of breakthrough infection

Alexander J Mentzer et al. Nat Med. 2023 Jan.

Abstract

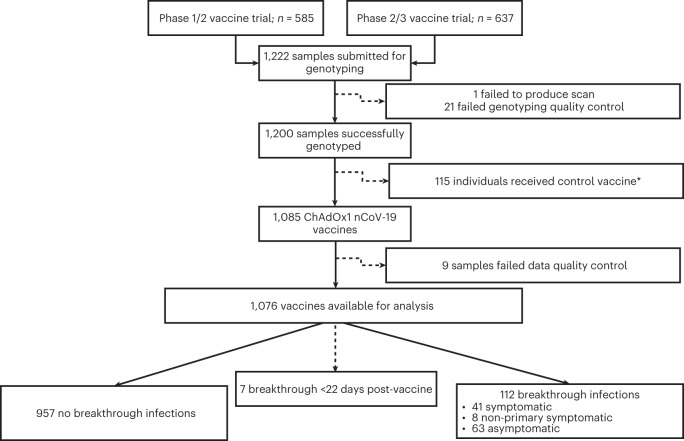
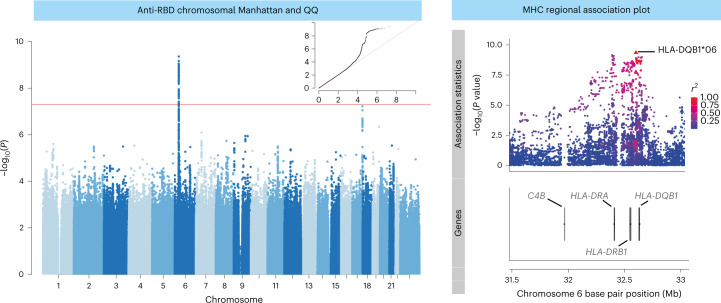
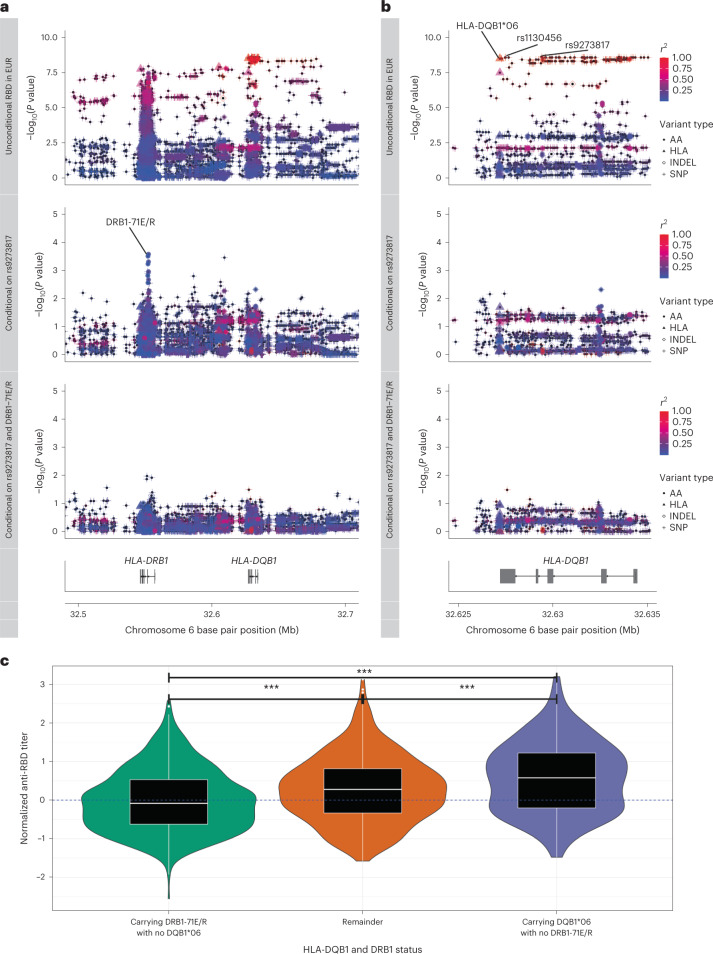
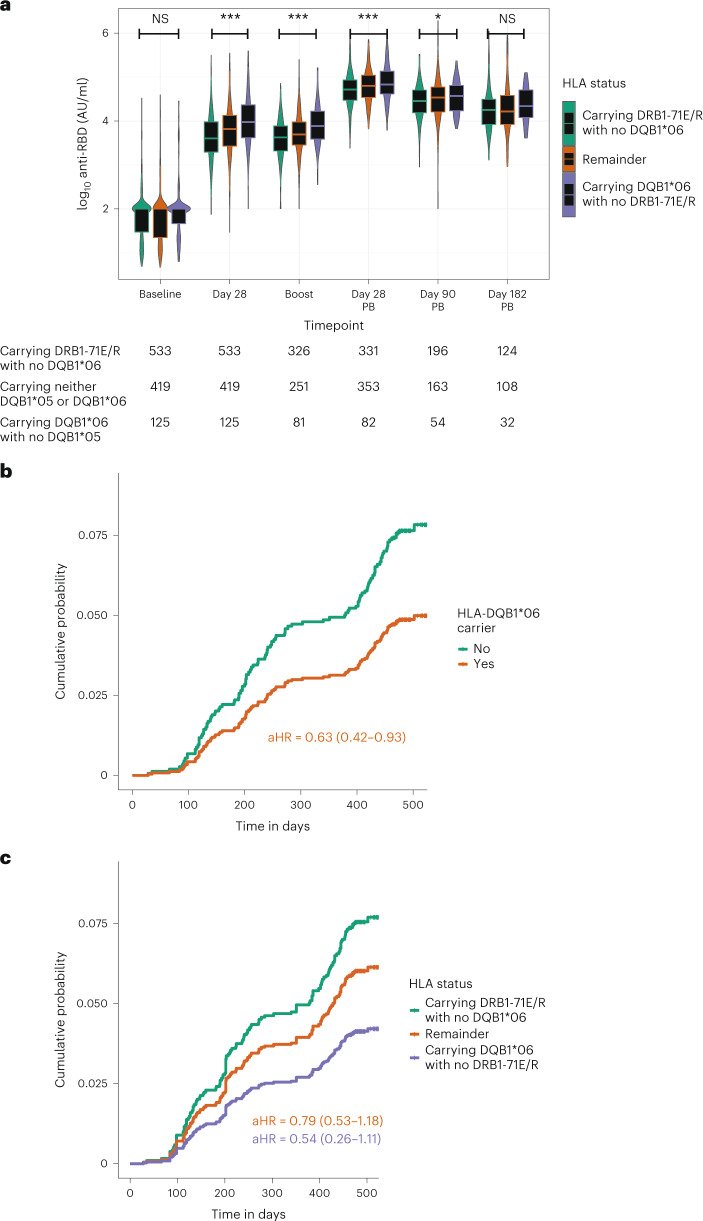
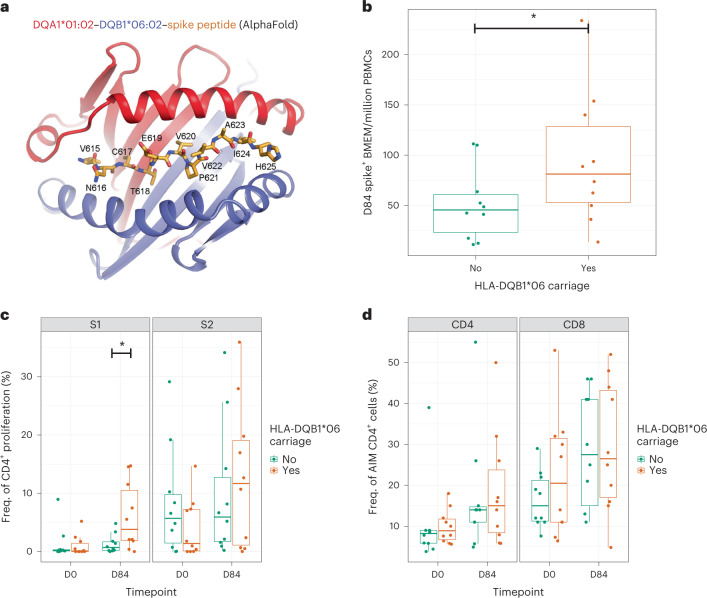
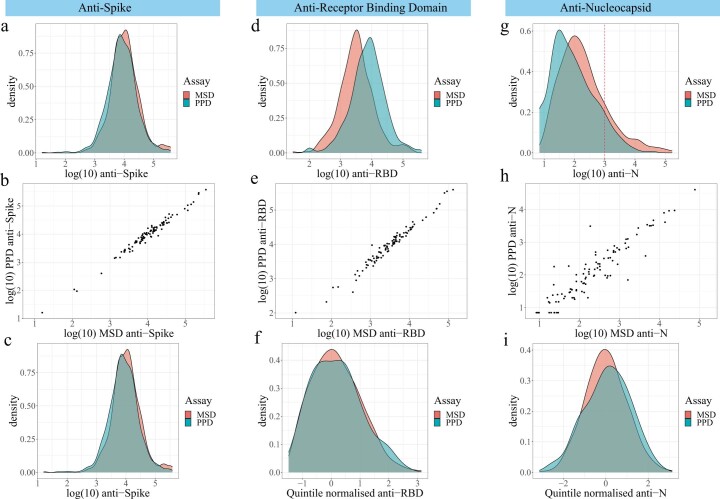
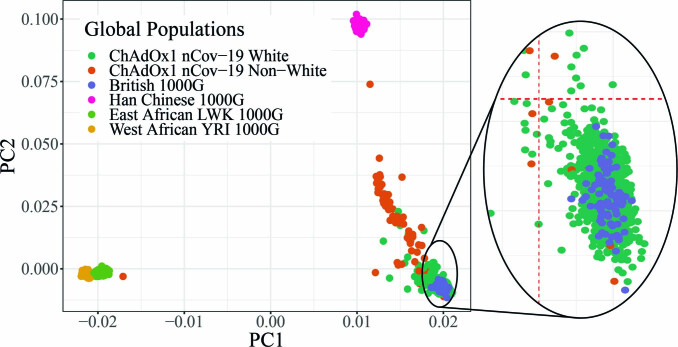
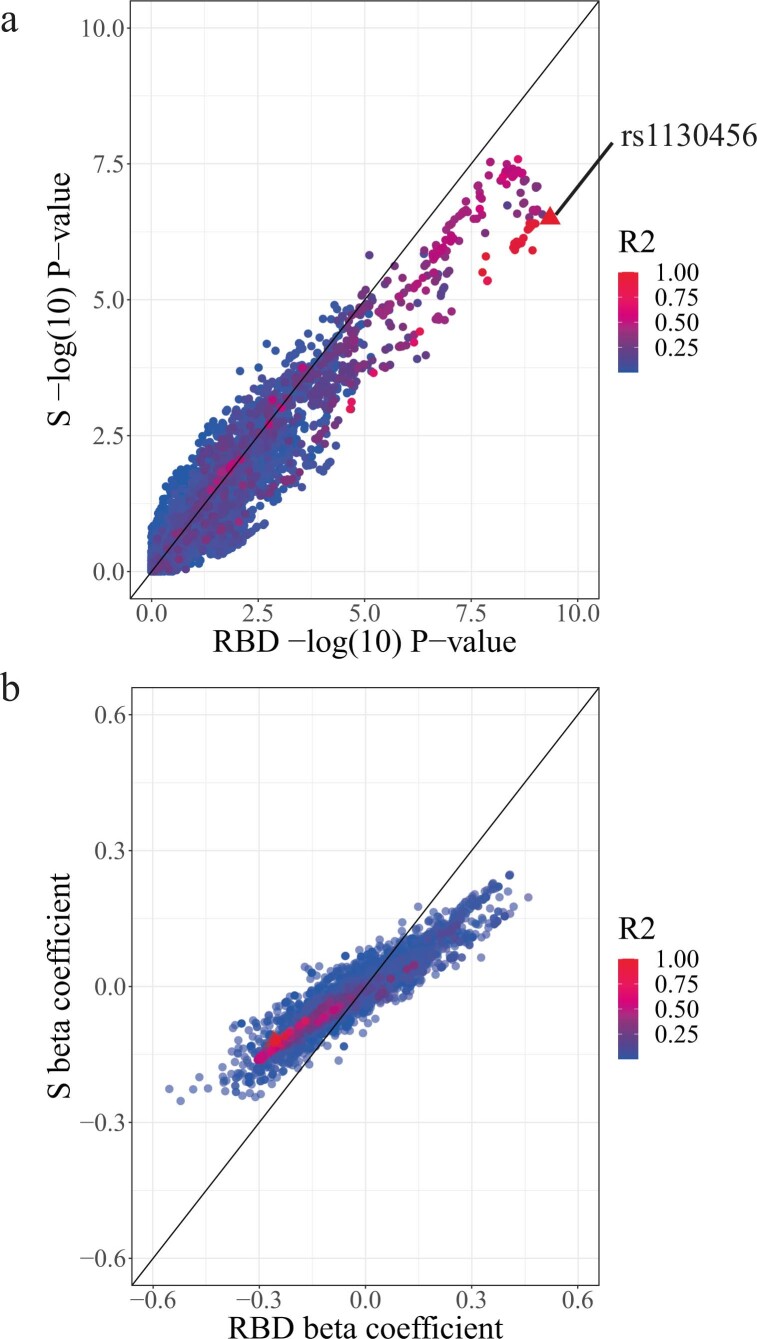
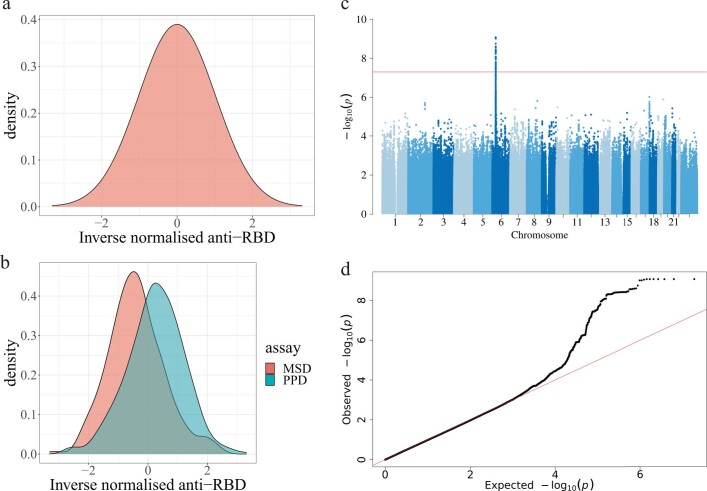
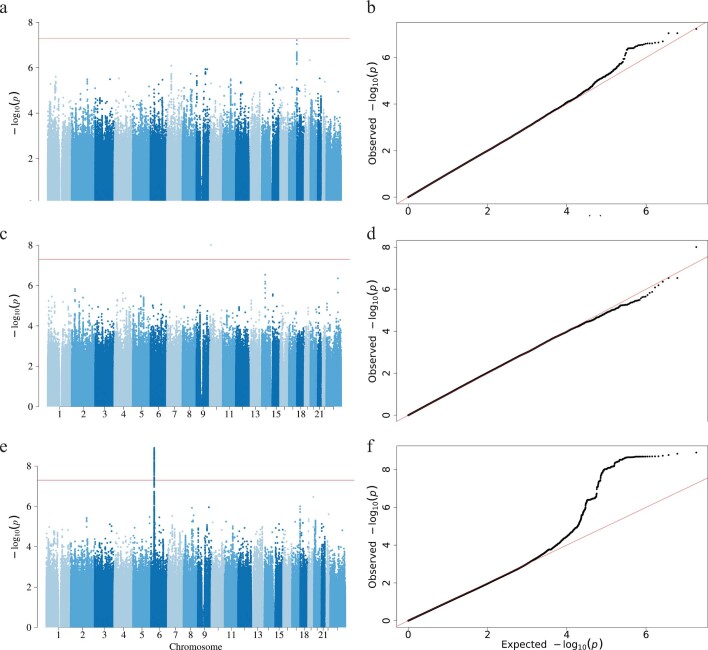
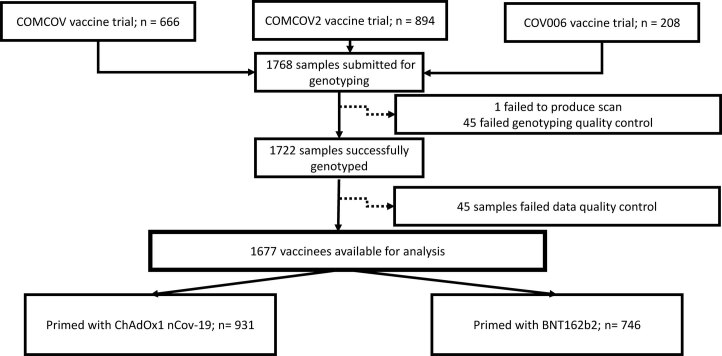
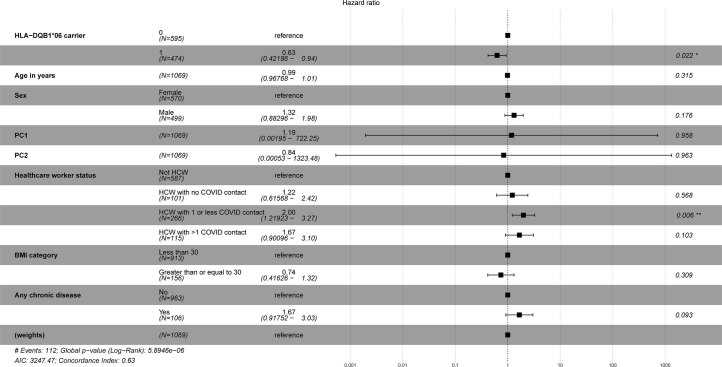
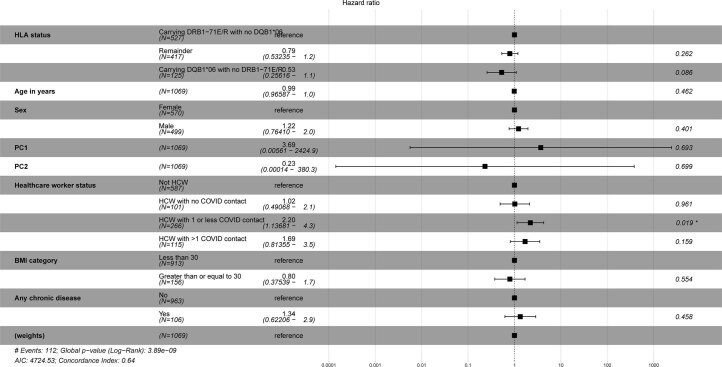
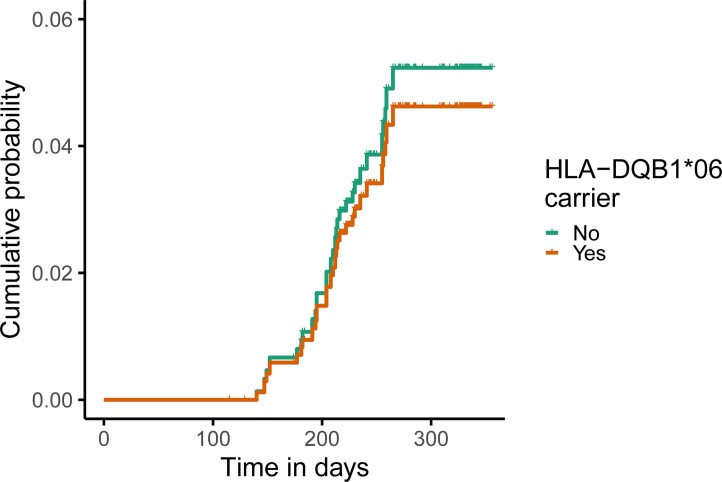
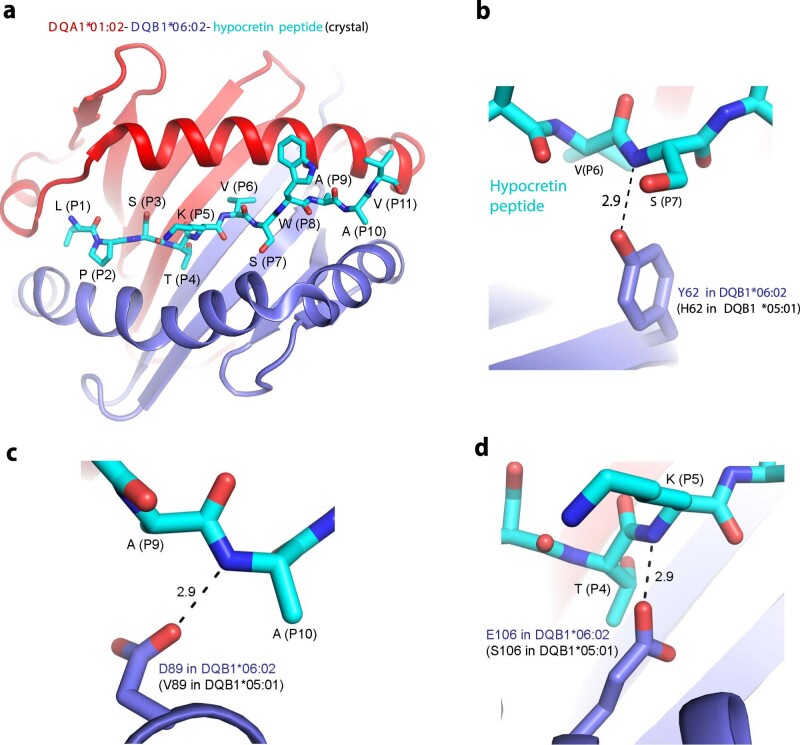
Severe acute respiratory syndrome coronavirus 2 (SARS-CoV-2) vaccine immunogenicity varies between individuals, and immune responses correlate with vaccine efficacy. Using data from 1,076 participants enrolled in ChAdOx1 nCov-19 vaccine efficacy trials in the United Kingdom, we found that inter-individual variation in normalized antibody responses against SARS-CoV-2 spike and its receptor-binding domain (RBD) at 28 days after first vaccination shows genome-wide significant association with major histocompatibility complex (MHC) class II alleles. The most statistically significant association with higher levels of anti-RBD antibody was HLA-DQB1*06 (P = 3.2 × 10⁻⁹), which we replicated in 1,677 additional vaccinees. Individuals carrying HLA-DQB1*06 alleles were less likely to experience PCR-confirmed breakthrough infection during the ancestral SARS-CoV-2 virus and subsequent Alpha variant waves compared to non-carriers (hazard ratio = 0.63, 0.42-0.93, P = 0.02). We identified a distinct spike-derived peptide that is predicted to bind differentially to HLA-DQB1*06 compared to other similar alleles, and we found evidence of increased spike-specific memory B cell responses in HLA-DQB1*06 carriers at 84 days after first vaccination. Our results demonstrate association of HLA type with Coronavirus Disease 2019 (COVID-19) vaccine antibody response and risk of breakthrough infection, with implications for future vaccine design and implementation.


Conflict of interest statement

The University of Oxford has entered into a partnership with AstraZeneca for further development of ChAdOx1 nCoV-19. T.L. is named as an inventor on a patent application covering this SARS-CoV-2 vaccine and was a consultant to Vaccitech for an unrelated project. A.J.P. is Chair of the UK Department of Health and Social Care (DHSC) Joint Committee on Vaccination & Immunisation (JCVI) but does not participate in discussions on COVID-19 vaccines and is a member of the Strategic Advisory Group of Experts on Immunization to the World Health Organization (WHO). A.J.P. is an NIHR senior investigator. The remaining authors declare no competing interests. The views expressed in this article do not necessarily represent the views of the DHSC, JCVI, NIHR or WHO.

Figures

Fig. 1
Fig. 1. Flow diagram of participants selected for analysis from the phase 1/2 (COV001) and phase 2/3 (COV002) vaccine trials.
For breakthrough infections, symptomatic individuals had primary symptoms of COVID-19 (cough, shortness of breath, fever, anosmia or ageusia); if they presented with symptoms other than the five primary COVID-19 symptoms, they were categorized as non-primary symptomatic cases. *Samples selected to maintain investigator blinding during sample selection.
Fig. 2
Fig. 2. Genome-wide and MHC SNP associations with RBD antibody level in 1,076 ChAdOx1 nCoV-19 vaccine recipients from the COV001 and COV002 vaccine trials.
The association results for all tested autosomal and X chromosome variants with linear regression in a mixed-model framework are shown on the left in a Manhattan plot, with the red horizontal line representing the nominal threshold for GWAS significance (P = 5 × 10−8) to account for the multiple tests performed. The QQ plot in the inset of the Manhattan plot on the left of the figure with expected P values shown on the x axis and observed on the y axis. A magnified view of a portion of the MHC locus is shown on the right of the figure. All points represent SNPs or HLA alleles positioned by build 37 of the human genome coordinates and colored on the right by linkage disequilibrium (r2), with relevant gene coordinates provided in the lower panel.
Fig. 3
Fig. 3. Fine-mapping the likely causal variants associated with day 28 post-prime anti-RBD antibody levels (normalized within immunoassay performed at MSD and PPD laboratories) in COV001 and COV002.
a,b, Stepwise conditional analyses using linear regression were performed in 1,023 individuals restricted by self-reported White ethnicity and PCA axes and with IBD values less than or equal to 0.185. The primary unconditional association analysis across the class II MHC region (a) and HLA-DQB1 locus (b) is shown in the top rows, with points shaped by variant type (AA, HLA allele (HLA), insertion–deletion (INDEL) or SNP) and colored by linkage disequilibrium (r2) with the index variant (rs9273817). The key variants of interest (rs9273817, rs1130456 and HLA-DQB1*06) are highlighted. The middle and bottom rows of a and b represent the same points after adjustment for rs9273817 (middle row) and also DRB1-71E/R (bottom row) using the same shape and color definitions as the first row. c, 1,076 individuals from COV001/COV002 grouped by carriage of either DQB1*06 or DRB1-71E/R in absence of the other demonstrate the most significant differences between groups tested using the two-sided Student’s t-test as shown by violin plots overlain by box plots. The box plot center line represents the median; the box limits represent the upper and lower quartiles; and the whiskers are the 1.5× IQR. ***P < 0.001. EUR, European.
Fig. 4
Fig. 4. The effect of HLA-DQB1*06 on anti-RBD antibody accounting for DRB1-71E/R persists over time and influences risk of breakthrough infection in COV001 and COV002 in genotyped vaccine recipients.
a, Where PPD-measured anti-RBD antibody levels were available in COV001 and COV002, the differences in vaccine responses by HLA type persisted over time. Differences were tested between the categories ‘Carrying DRB1-71E/R with no DQB1*06’ and ‘Carrying DQB1*06 with no DRB1-71E/R’ using the two-tailed Student’s t-test. Times of sampling are after either first or second (post-boost (PB)) vaccine doses. b,c, Adjusted Cox regression curves with risk of breakthrough infection over time in 1,069 individuals stratified by carriage of HLA-DQB1*06 (b) and HLA-DQB1*06 (c) alleles, accounting for DRB1-71E/R status in COV001 and COV002 vaccine recipients adjusted for age, sex, reported ethnicity, healthcare worker status, BMI and chronic disease status and including sample weighting for dose and interval between prime and boost vaccination. Included individuals had breakthrough infection at least 22 days after first vaccination. Box plot center line indicates median; box limits indicate upper and lower quartiles; and whiskers indicate 1.5× IQR. **P < 0.01 and *P < 0.05. aHR, adjusted hazard ratio; AU, arbitrary units; NS, not significant.
Fig. 5
Fig. 5. The clinical implications and mechanisms of the HLA associations with differential spike/RBD antibody levels.
a, AlphaFold-based model of HLA-DQA1:01:02–HLA-DQB1:06:02–spike peptide. The peptide is shown in orange. Residue numbering corresponds to UniProt ID P0DTC2. Memory B cell (b), CD4+ T cell proliferation (c) and AIM CD4+ T cell (d) responses using biologically independent samples from 20 individuals from COV001 and COV002 stratified by carriage of HLA-DQB1*06 allele carriage sampled at days 0 and 84 after first vaccine, with significant differences tested for using a one-sided Wilcoxon rank test. Statistical differences were seen between HLA carriage groups for the memory B cell responses (b, P = 0.05) and S1 proliferation response (c, P = 0.01) at day 84. Box plot center line indicates median; box limits indicate upper and lower quartiles; and whiskers indicate 1.5× IQR. *P < 0.05.
Extended Data Fig. 1
Extended Data Fig. 1. Immunoassay distributions.
IgG antibody responses against SARS-CoV-2 spike (S, panels a-c), receptor binding domain (RBD, panels d-f) and nucleocapsid (N, panels g-i)) were measured for COV001 and COV002 participants in two laboratories: MSD and PPD. For 97 individuals, measures were available from both laboratories. The density distributions of measures from each laboratory for each antigen (panels a, d and g) and the correlation between intra-individual measures (panels b rho 0.98, e rho 0.98, and h rho 0.90) were inspected. If the density distributions overlapped and the intra-individual correlation (r2) was greater than 0.7, the original distributions were taken forward for analysis (as for S, panel c). However if r2 was less than 0.7, the quintile normalised intra-laboratory measures were taken forwards for analysis (panels f and i).
Extended Data Fig. 2
Extended Data Fig. 2. Principal components of genotyped individuals from COV001 and COV002 alongside individuals from 1000 Genomes (1000 G) European, Asian and African populations.
The European cluster is magnified in the inset to demonstrate effective overlap between the majority of self-reported White ChAdOx1 nCoV-19 individuals and the British (from England and Scotland) 1000 G individuals. Red dashed lines represent PC1 and PC2 thresholds to define a specific European cluster.
Extended Data Fig. 3
Extended Data Fig. 3. Correlation in genetic architecture between association statistics for anti-Spike and anti-RBD in individuals vaccinated with ChAdOx nCov-19 in COV001 and COV002.
Comparison of –log(10) P-values (a) and beta coefficients (b) for genotyped and imputed variants tested using linear regression within 4 Mb window of top associated variant associated with RBD (rs1130456). Points are coloured by linkage disequilibrium (r2) with rs1130456 and the index variant is shaped as a triangle compared to all other variants as circles.
Extended Data Fig. 4
Extended Data Fig. 4. Testing effect of non-normality of antibody distributions on HLA association signals in COV001 and COV002 participants.
The final RBD antibody levels were inverse normalised across all individuals with genotype data available to produce a normal phenotype distribution (a), with preserved distributions when considered stratified by assay (b). The association signal across the MHC when tested for using linear mixed-model regression was still observed with the genome-wide association statistics presented in Manhattan (with the GWAS level of significance represented by the horizontal red line) (c) and QQ plots (d).
Extended Data Fig. 5
Extended Data Fig. 5. Testing effect of population stratification on HLA association signal in COV001 and COV002 participants.
The Manhattan (a) and QQ plot (b) of the association tested using a linear-mixed model with RBD in ChAdOx1 nCoV-19 vaccinated individuals from COV001 and COV002 excluding the extended MHC region to determine whether the MHC signal may be contributing significantly to the increased genomic inflation factor in the complete association analysis. The Manhattan (c) and QQ plot (d) for the association analysis with quantitative N levels to test for spurious statistical inflation in the multi-ethnic cohort. The Manhattan (e) and QQ plot (f) for RBD including the first ten principal components of genetic variance as fixed effect covariates in the mixed model association analysis. The horizontal red lines in a, c and e represent the threshold of GWAS significance (P < 5 × 10−8) to account for the multiple tests performed.
Extended Data Fig. 6
Flow diagram of participants from COMCOV, COMCOV2 and COV006 selected for replication analysis.
Extended Data Fig. 7
Effect estimates with 95% confidence intervals of covariates and HLA-DQB1*06 carriage in an adjusted Cox proportional hazards regression model predicting breakthrough infection in genotyped vaccine recipients from COV001 and COV002.
Extended Data Fig. 8
Effect estimates with 95% confidence intervals of covariates and carriage HLA-DQB1*06 accounting for DRB1-71E/R in an adjusted Cox proportional hazards regression model predicting breakthrough infection in genotyped vaccine recipients from COV001 and COV002.
Extended Data Fig. 9
Extended Data Fig. 9. Risk of breakthrough by HLA-DQB1*06 carriage in the replication cohort individuals.
Adjusted Cox regression curves with risk of breakthrough infection in 401 individuals less than 55 years of age and self-reporting White ethnicity over time stratified by carriage of HLA-DQB1*06 alleles in merged COMCOV/COMCOV2/COV006 vaccine recipients. Curves are adjusted for age, sex, first vaccine type (BNT162b2 or ChAdOx1 nCoV-19) and second vaccine (viral vector (ChAdOx1 nCoV-19), mRNA (BNT162b2 or mRNA-1273) or nanoparticle (NVXCoV2373)) received as covariates with reweighting performed using interval between first and second vaccines in days.
Extended Data Fig. 10
Extended Data Fig. 10. Crystal structure and HLA-DQA1:01:02–HLA-DQB1:06:02–peptide interactions.
a) the crystal structure of HLA-DQA1:01:02–HLA-DQB1:06:02–hypocretin peptide (Protein Data Bank ID 1UVQ) coloured in red, blue, and cyan, respectively. Side chains of the peptide are shown as sticks and numbered. Carbon atoms of the peptide are coloured in cyan (oxygen, red; nitrogen, blue). b)–d), hydrogen bonds between the hypocretin peptide and HLA-DQB1:06:02 are indicated with dashed lines with distances between selected atoms shown in Å. Numbering of HLA-DQB1:05:01 and HLA-DQB1:06:02 correspond to UniProt IDs Q5Y7F1 and Q5Y7D6, respectively.

References

    1. COVID-19 Map. Johns Hopkins Coronavirus Resource Center. https://coronavirus.jhu.edu/map.html
    1. Taylor L. Covid-19: true global death toll from pandemic is almost 15 million, says WHO. BMJ. 2022;377:o1144. doi: 10.1136/bmj.o1144. - DOI - PubMed
    1. Polack F. Safety and efficacy of the BNT162b2 mRNA COVID-19 vaccine. N. Engl. J. Med. 2020;383:2603–2615. doi: 10.1056/NEJMoa2034577. - DOI - PMC - PubMed
    1. Voysey M, et al. Safety and efficacy of the ChAdOx1 nCoV-19 vaccine (AZD1222) against SARS-CoV-2: an interim analysis of four randomised controlled trials in Brazil, South Africa, and the UK. Lancet. 2021;397:99–111. doi: 10.1016/S0140-6736(20)32661-1. - DOI - PMC - PubMed
    1. Pritchard E, et al. Impact of vaccination on new SARS-CoV-2 infections in the United Kingdom. Nat. Med. 2021;27:1370–1378. doi: 10.1038/s41591-021-01410-w. - DOI - PMC - PubMed

Publication types

Supplementary concepts