. 2022 Dec 20:853:158931.
doi: 10.1016/j.scitotenv.2022.158931. Epub 2022 Oct 10.

SARS-CoV-2 infection dynamics revealed by wastewater sequencing analysis and deconvolution

Affiliations

SARS-CoV-2 infection dynamics revealed by wastewater sequencing analysis and deconvolution

Vic-Fabienne Schumann et al. Sci Total Environ. .

Abstract

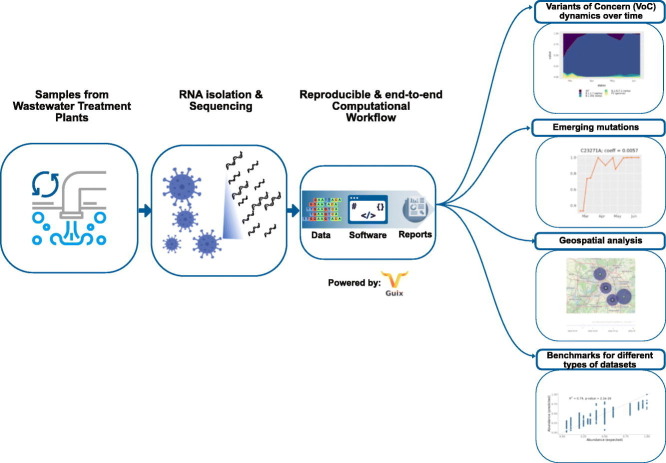
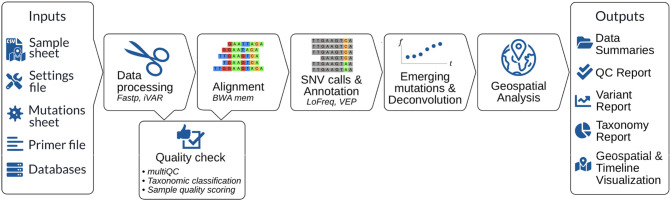
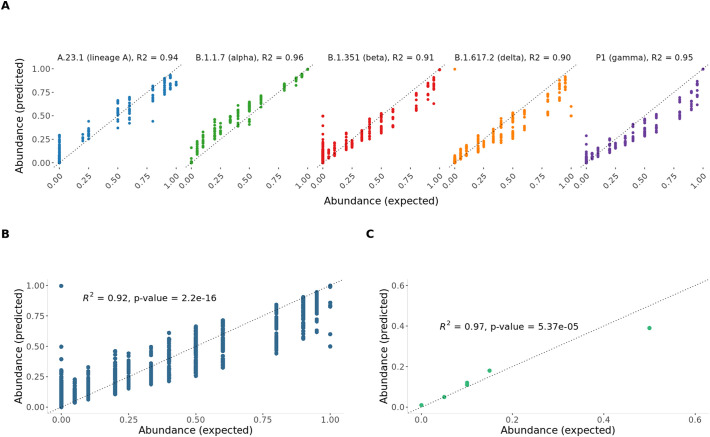
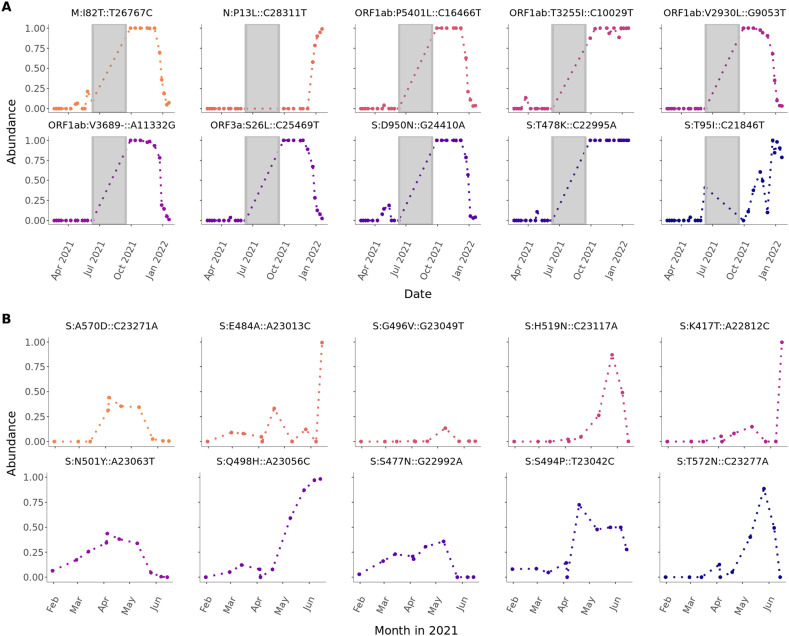
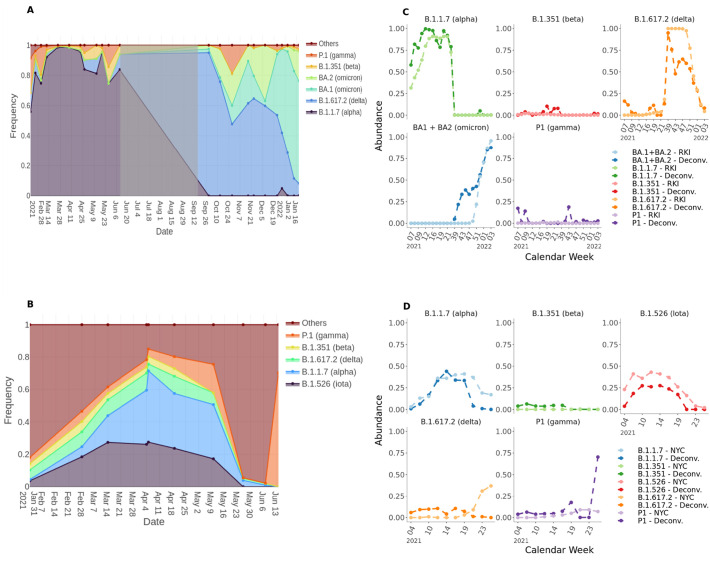
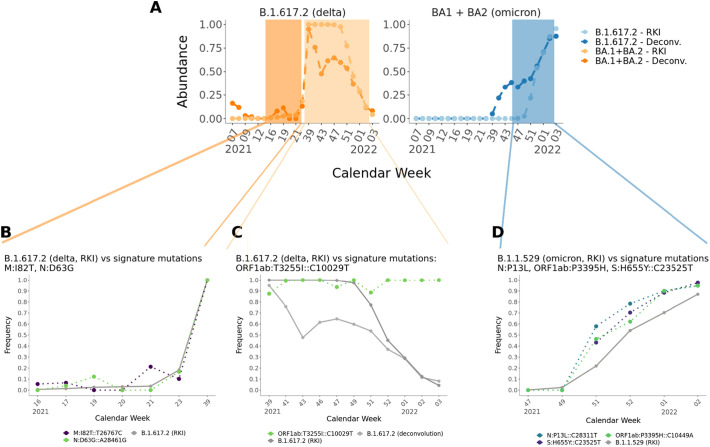
The use of RNA sequencing from wastewater samples is a valuable way for estimating infection dynamics and circulating lineages of SARS-CoV-2. This approach is independent from testing individuals and can therefore become the key tool to monitor this and potentially other viruses. However, it is equally important to develop easily accessible and scalable tools which can highlight critical changes in infection rates and dynamics over time across different locations given sequencing data from wastewater. Here, we provide an analysis of lineage dynamics in Berlin and New York City using wastewater sequencing and present PiGx SARS-CoV-2, a highly reproducible computational analysis pipeline with comprehensive reports. This end-to-end pipeline includes all steps from raw data to shareable reports, additional taxonomic analysis, deconvolution and geospatial time series analyses. Using simulated datasets (in silico generated and spiked-in samples) we could demonstrate the accuracy of our pipeline calculating proportions of Variants of Concern (VOC) from environmental as well as pre-mixed samples (spiked-in). By applying our pipeline on a dataset of wastewater samples from Berlin between February 2021 and January 2022, we could reconstruct the emergence of B.1.1.7(alpha) in February/March 2021 and the replacement dynamics from B.1.617.2 (delta) to BA.1 and BA.2 (omicron) during the winter of 2021/2022. Using data from very-short-reads generated in an industrial scale setting, we could see even higher accuracy in our deconvolution. Lastly, using a targeted sequencing dataset from New York City (receptor-binding-domain (RBD) only), we could reproduce the results recovering the proportions of the so-called cryptic lineages shown in the original study. Overall our study provides an in-depth analysis reconstructing virus lineage dynamics from wastewater. While applying our tool on a wide range of different datasets (from different types of wastewater sample locations and sequenced with different methods), we show that PiGx SARS-CoV-2 can be used to identify new mutations and detect any emerging new lineages in a highly automated and scalable way. Our approach can support efforts to establish continuous monitoring and early-warning projects for detecting SARS-CoV-2 or any other pathogen.

Keywords: COVID-19 surveillance; Environmental monitoring; Public health risk; Sequencing; Sewage sampling.


Conflict of interest statement

Declaration of competing interest The authors declare that they have no known competing financial interests or personal relationships that could have appeared to influence the work reported in this paper.

Figures

Unlabelled Image
Graphical abstract
Fig. 1
Fig. 1
Flowchart of PiGx SARS-CoV-2 pipeline describing required input files, the analysis workflow and used tools and output files.
Fig. 2
Fig. 2
A) Prediction verification results for the spike-in data simulation per lineage, the dotted line shows the expected trendline; B) Prediction verification results for the spike-in data simulation across all lineages excluding lineage A; C) Prediction verification results in-silico simulation, single-end simulated 40 bp reads from GISAID, 100 k reads.
Fig. 3
Fig. 3
A) Top 10 sequence variants that significantly increase over time in Berlin. The mutations were pooled over locations of four different wastewater treatment plants and daytime and sorted by decreasing coefficients from linear models. Statistical significance was evaluated by a t-test using p ≤ 0.05 as cutoff. Only samples passing the sample quality scoring (>90 % reference genome coverage) were used. There was no sampling between June 11 and September 19, 2021. B) Top 10 sequence variants that significantly increase over time in New York City (NYC) (2021). The mutations were pooled over locations of 14 different wastewater treatment plants in NYC and daytime and sorted by decreasing coefficients from linear models. Statistical significance was evaluated by a t-test using p ≤ 0.05 as cutoff.
Fig. 4
Fig. 4
A) Proportion of tracked lineages over time in Berlin wastewater. Only samples passing the sample quality scoring (≥ 90 % reference genome coverage) were considered. Shaded area highlights the non-sampling Phase. B) Proportion of tracked lineages over time in New York City wastewater. The proportions were calculated with a deconvolution model based on the signature mutation frequencies. “Others” denotes a set of reference mutations derived from the deconvolution matrix. Sample results were pooled from four different wastewater treatment plants using weighted mean with read number as weights. In case of undistinguishable lineages the proportion derived for the group was distributed equally for the affected lineages. C,D) Comparison of deconvolution results (dark color) with lineage frequency analysis data from Robert-Koch-Institute (RKI) (C) or NYC Department of Health and Mental Hygiene (NYC) (D) (light color). Deconvolution results were pooled by weeks using weighted mean using sample read numbers as weights. For the data from Berlin only samples passing the sample quality scoring (≥ 90 % reference genome coverage) were used.
Fig. 5
Fig. 5
A) Combination of lineage prediction results (deconvolution) for B.1.617.2 and BA.1/BA.2 (dataset-Berlin250), B,C,D) single key signature mutations M:I82T::T26767C, N:D63G::A28461G, ORF1ab:T3255I::C10029T, ORF1ab:P3395H::C10449A, N:P13L::C28311T, S:H655Y::C23525T and case numbers in Berlin (from RKI).
Fig. 6
Fig. 6
A) 7 days average of COVID-19 cases in Berlin, data from Robert Koch-Institute (RKI) (light green, left axis) and proportion of samples positively determined SARS-CoV-2 RNA by RT-qPCR (dark violet, right axis) over Feb - Jan 2022. B) Correlation of 7 days average of COVID-19 cases in Berlin and proportion of samples with positively determined SARS-CoV-2 RNA by RT-qPCR. C) 7 days average of COVID-19 cases in Berlin, data from Robert Koch-Institute (RKI) (light green, left axis) and proportion of samples positively determined SARS-CoV-2 RNA by RT-qPCR (dark violet, right axis) over Feb - Jan 2022 with one time point lag. D) Correlation of 7 days average of COVID-19 cases in Berlin and proportion of samples with positively determined SARS-CoV-2 RNA by RT-qPCR with one time point lag.

References

    1. Ahmed W., Bertsch P.M., Bivins A., Bibby K., Farkas K., Gathercole A., et al. Comparison of virus concentration methods for the RT-qPCR-based recovery of murine hepatitis virus, a surrogate for SARS-CoV-2 from untreated wastewater. Sci. Total Environ. 2020;739 - PMC - PubMed
    1. Bar-Or I., Yaniv K., Shagan M., Ozer E., Erster O., Mendelson E., et al. Regressing SARS-CoV-2 sewage measurements onto COVID-19 burden in the population: a proof-of-concept for quantitative environmental surveillance. Front. Public Health. 2022;9(56171) doi: 10.3389/fpubh.2021.561710. - DOI - PMC - PubMed
    1. Chen A.T., Altschuler K., Zhan S.H., Chan Y.A., Deverman B.E. COVID-19 CG enables SARS-CoV-2 mutation and lineage tracking by locations and dates of interest. elife. 2021;10 - PMC - PubMed
    1. Chen S., Zhou Y., Chen Y., Gu J. fastp: an ultra-fast all-in-one FASTQ preprocessor. Bioinformatics. 2018;34:i884–i890. - PMC - PubMed
    1. Courtès L., Wurmus R. 2015. Reproducible and User-Controlled Software Environments in HPC with Guix. arXiv:150602822 [cs]

Supplementary concepts