

In simulated data and health records, latent class analysis was the optimum multimorbidity clustering algorithm
- PMID: 36228971
- PMCID: PMC7613854
- DOI: 10.1016/j.jclinepi.2022.10.011
In simulated data and health records, latent class analysis was the optimum multimorbidity clustering algorithm
Abstract
Background and objectives: To investigate the reproducibility and validity of latent class analysis (LCA) and hierarchical cluster analysis (HCA), multiple correspondence analysis followed by k-means (MCA-kmeans) and k-means (kmeans) for multimorbidity clustering.
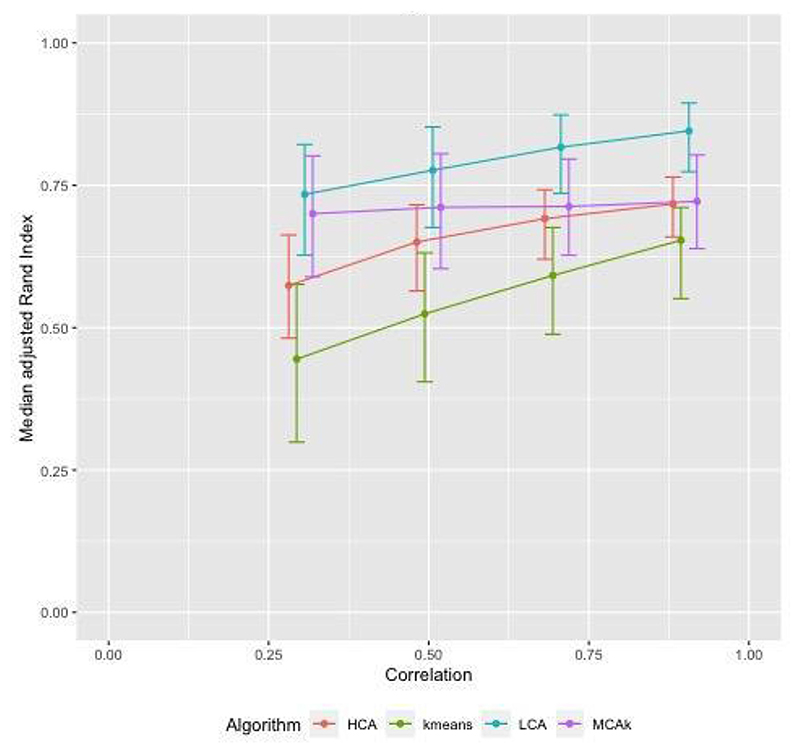
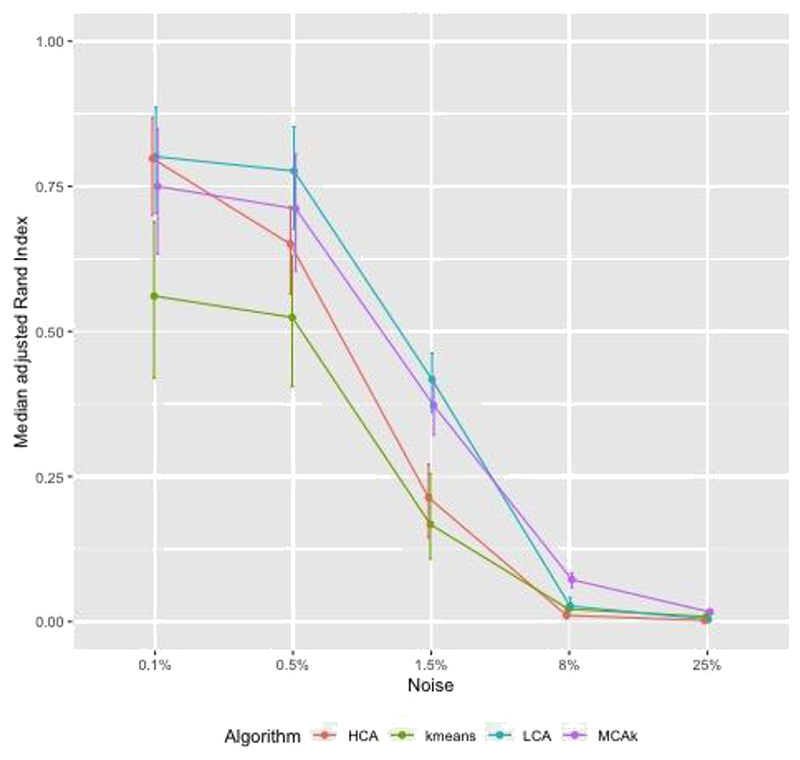
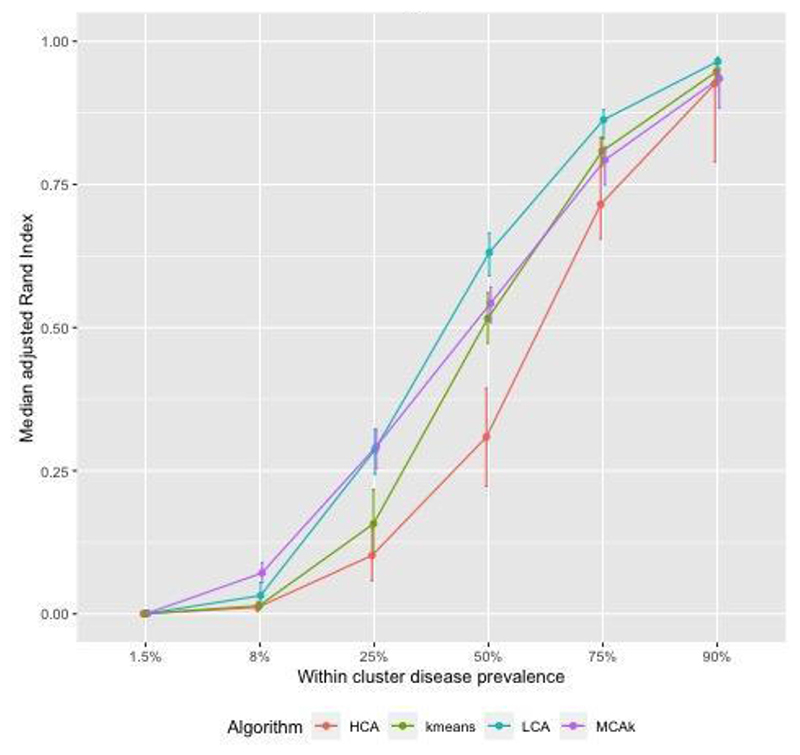
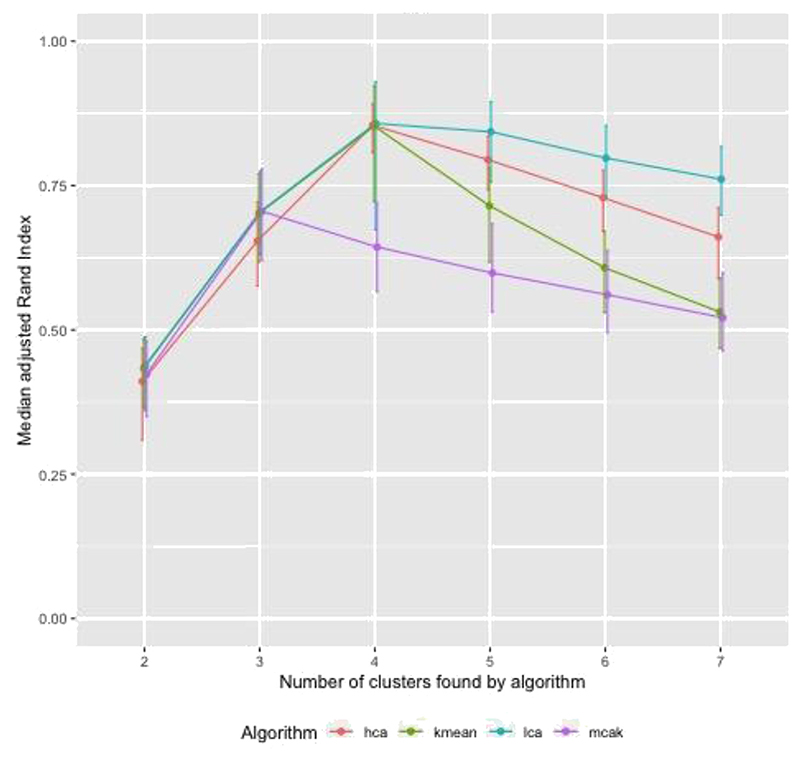
Methods: We first investigated clustering algorithms in simulated datasets with 26 diseases of varying prevalence in predetermined clusters, comparing the derived clusters to known clusters using the adjusted Rand Index (aRI). We then them investigated the medical records of male patients, aged 65 to 84 years from 50 UK general practices, with 49 long-term health conditions. We compared within cluster morbidity profiles using the Pearson correlation coefficient and assessed cluster stability using in 400 bootstrap samples.
Results: In the simulated datasets, the closest agreement (largest aRI) to known clusters was with LCA and then MCA-kmeans algorithms. In the medical records dataset, all four algorithms identified one cluster of 20-25% of the dataset with about 82% of the same patients across all four algorithms. LCA and MCA-kmeans both found a second cluster of 7% of the dataset. Other clusters were found by only one algorithm. LCA and MCA-kmeans clustering gave the most similar partitioning (aRI 0.54).
Conclusion: LCA achieved higher aRI than other clustering algorithms.
Keywords: Clustering methods; Electronic medical records; Hierarchical cluster analysis; K-means; Latent class analysis; Multimorbidity; Multiple correspondence analysis.
Copyright © 2022 The Author(s). Published by Elsevier Inc. All rights reserved.
Conflict of interest statement
Declaration of interests: The authors declare that they have no known competing financial interests or personal relationships that could have appeared to influence the work reported in this paper. Tom Marshall reports financial support was provided by UKRI - research grant from NIHR-MRC for BIRMCAM study. Jessica Barrett reports financial support was provided by Medical Research Council (Biostatistics Unit). Sylvia Richardson reports financial support was provided by Medical Research Council (Biostatistics Unit). Paul Kirk reports was provided by Medical Research Council (Biostatistics Unit). Linda Nichols reports financial support was provided by UKRI - research grant from NIHR-MRC for BIRMCAM study. Tom Taverner reports financial support was provided by UKRI - research grant from NIHR-MRC for BIRMCAM study. Krishnarajah Nirantharakumar reports financial support was provided by Health Data Research UK - fellowship. Paul Kirk reports a relationship with Director, Health Data Science, AstraZeneca that includes: employment.
Figures
References
-
- The Academy of Medical Sciences. Multimorbidity: a priority for global health research. Acad Med Sci. 2018:1–127.
-
- den Akker M, Buntinx F, Knottnerus JV. Comorbidity or multimorbidity: what’s in a name? A review of literature. Eur J Gen Pract. 1996;2:65–70.
-
- Barnett K, Mercer SW, Norbury M, Watt G, Wyke S, Guthrie B. Epidemiology of multimorbidity and implications for health care, research, and medical education: a cross-sectional study. Lancet. 2012;380:37–43. - PubMed
MeSH terms
Grants and funding
LinkOut - more resources
Full Text Sources
Research Materials
