. 2022 Oct 13;6(1):e202101305.
doi: 10.26508/lsa.202101305. Print 2023 Jan.

A dominant negative mitofusin causes mitochondrial perinuclear clusters because of aberrant tethering

Affiliations

A dominant negative mitofusin causes mitochondrial perinuclear clusters because of aberrant tethering

Stephanie R Sloat et al. Life Sci Alliance. .

Abstract

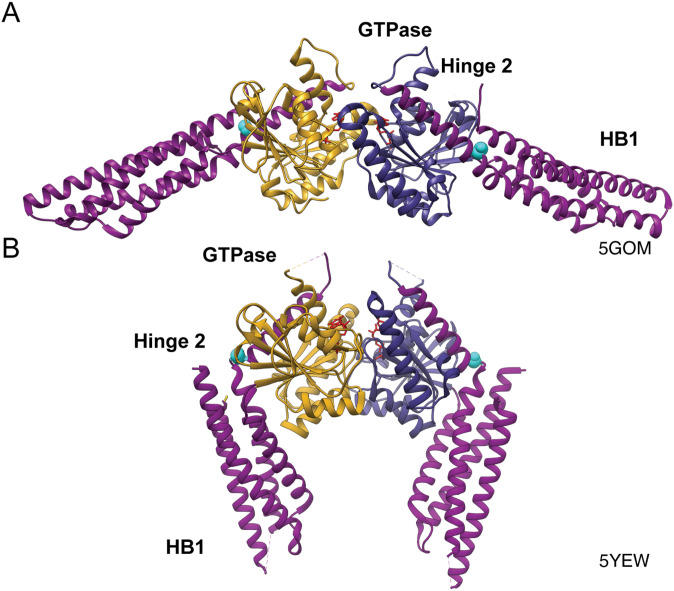
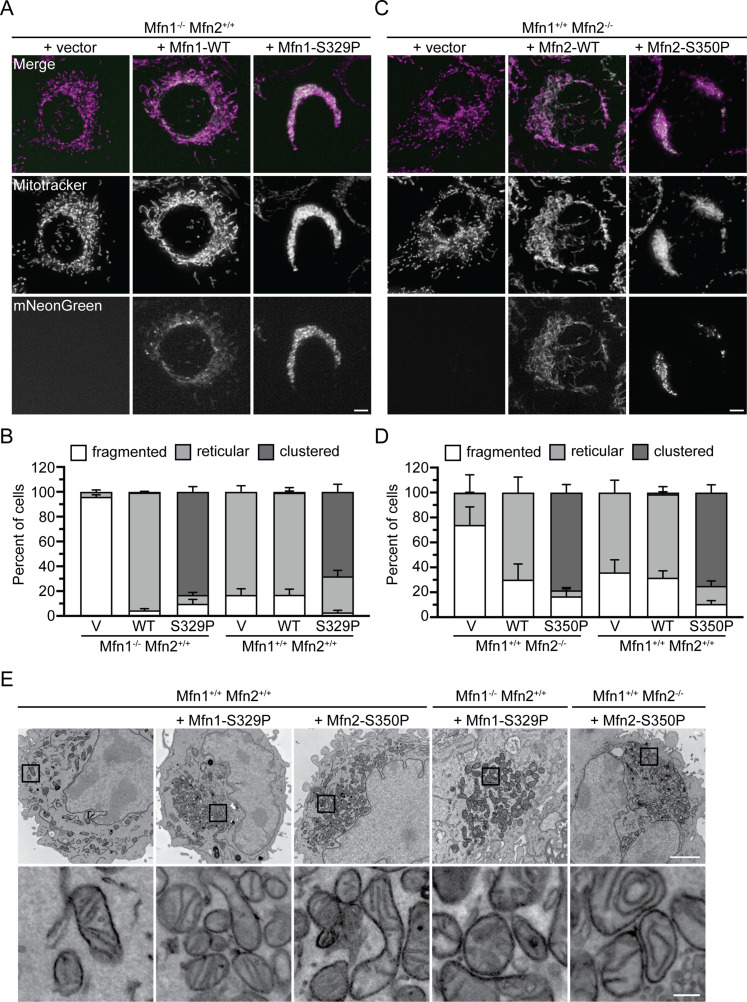
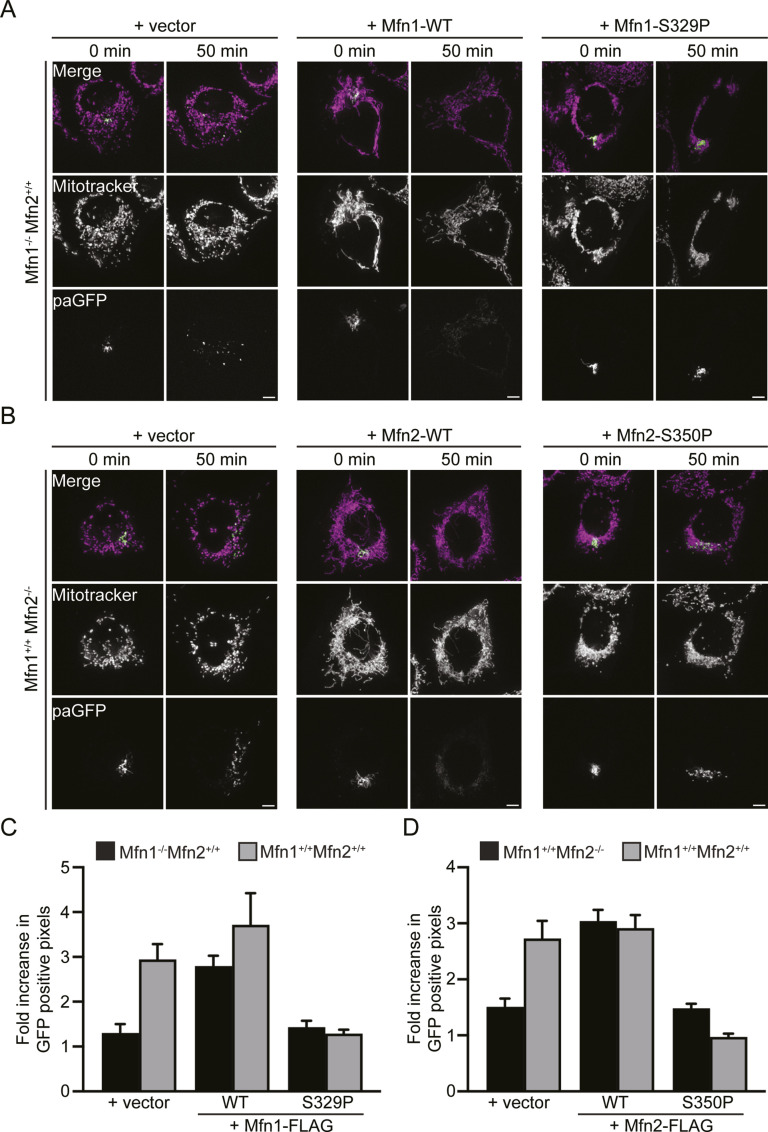
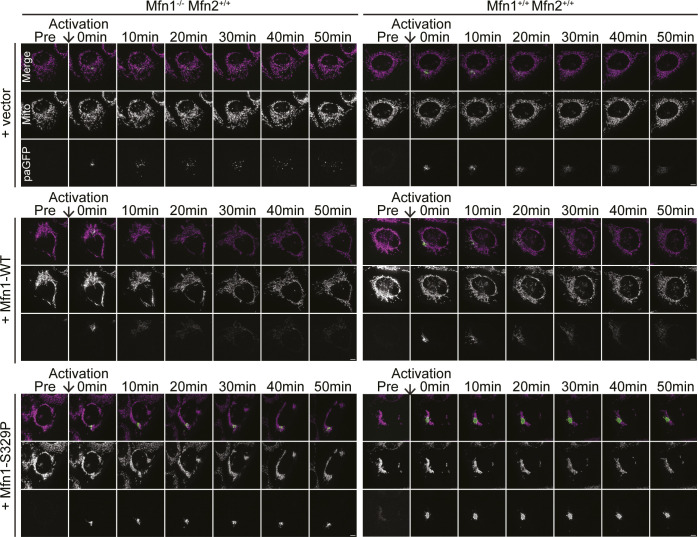
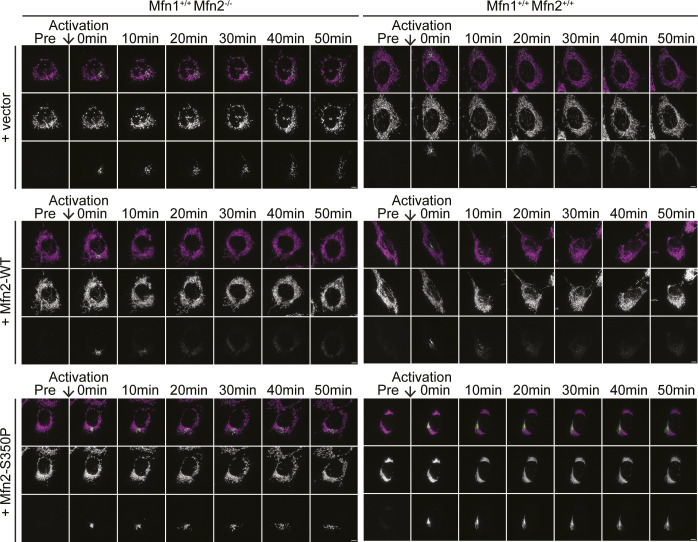
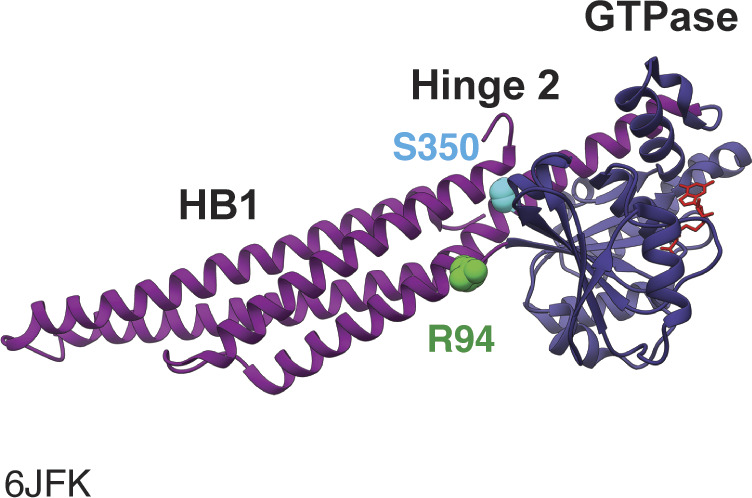
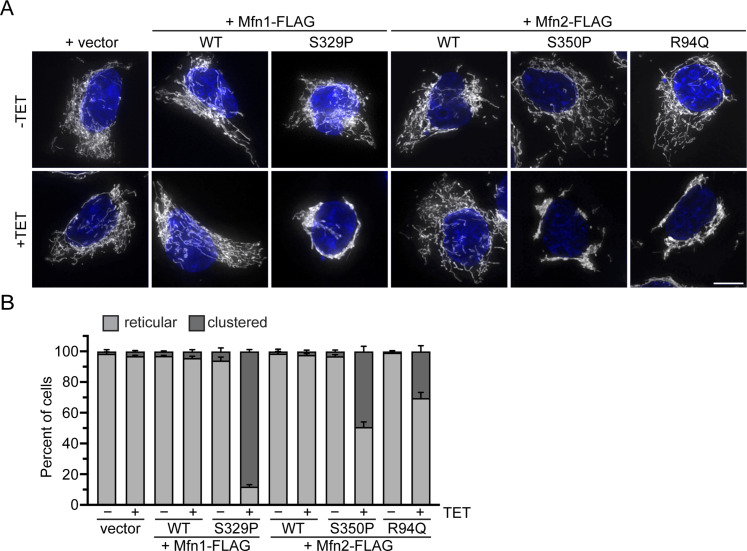
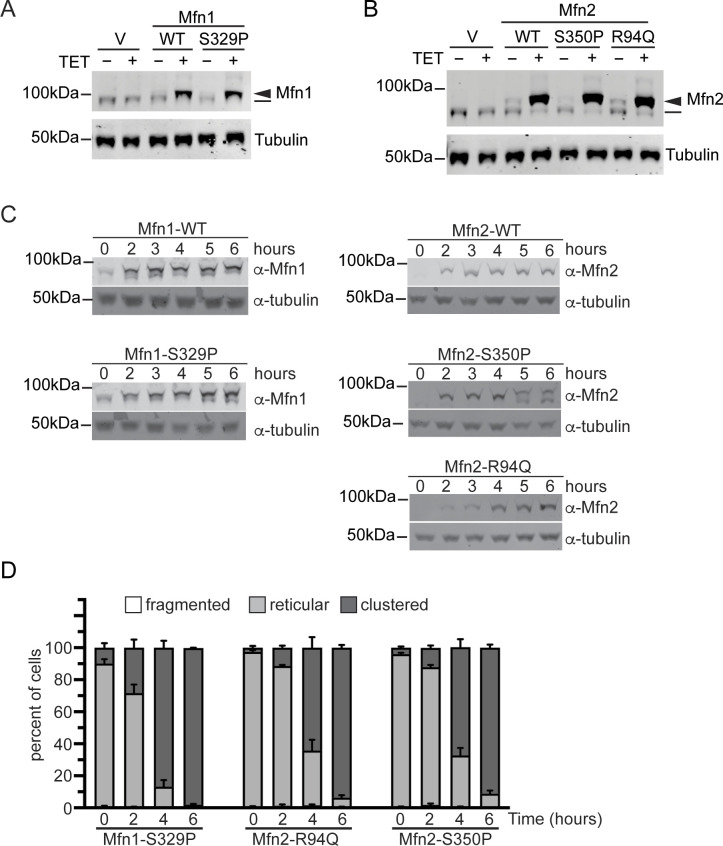
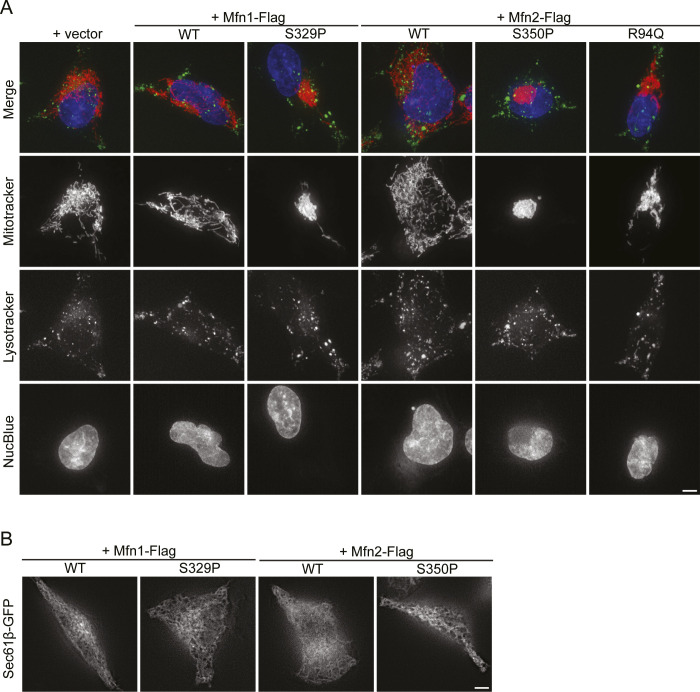
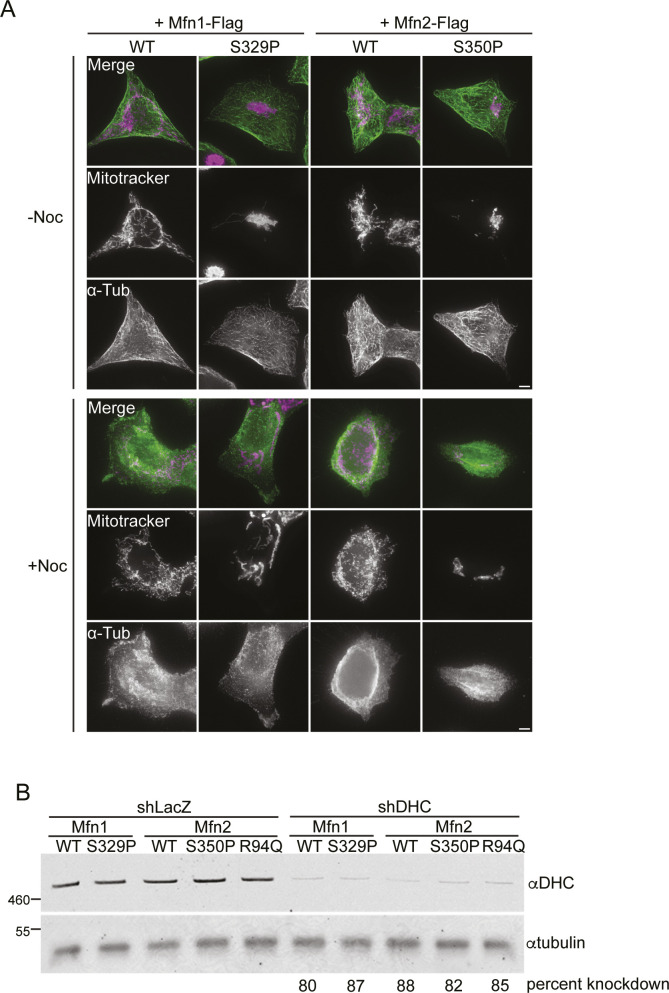
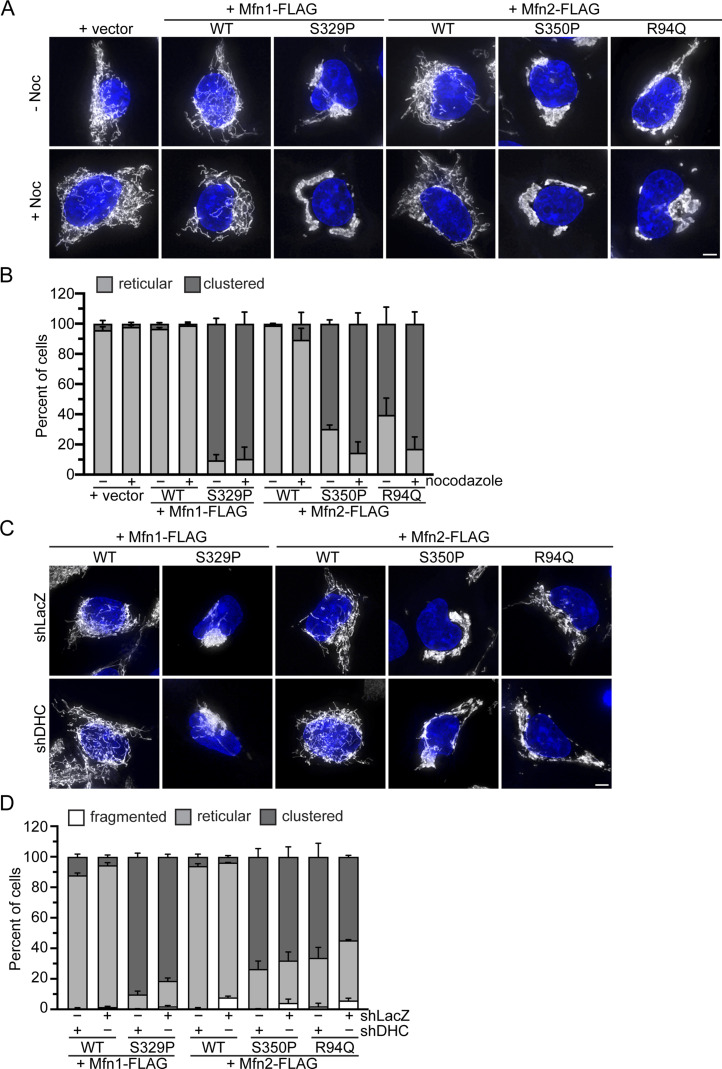
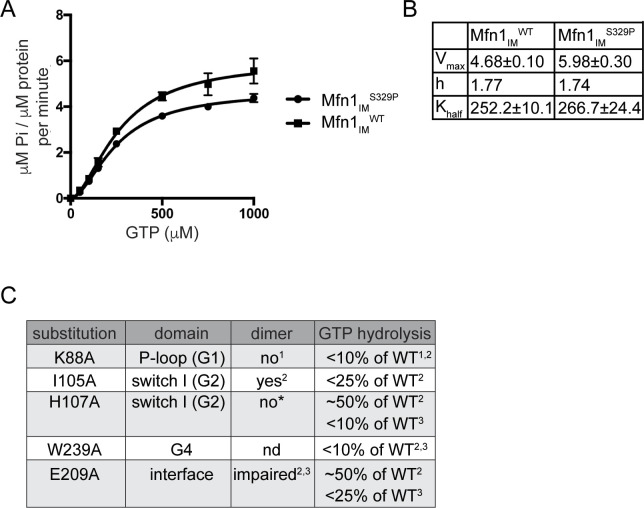
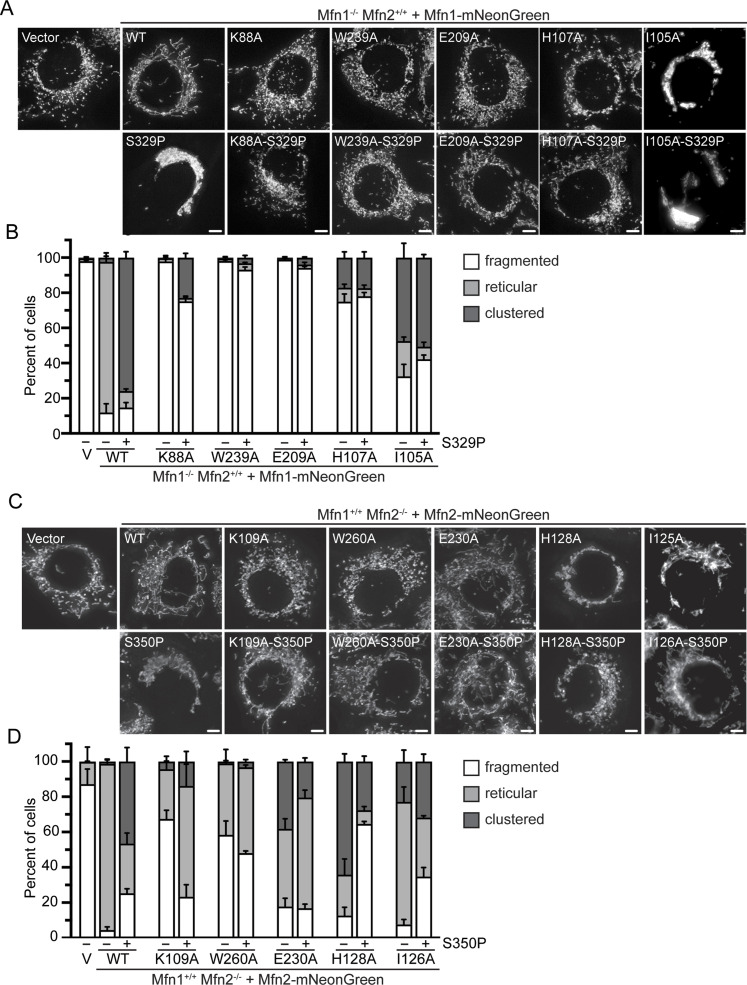
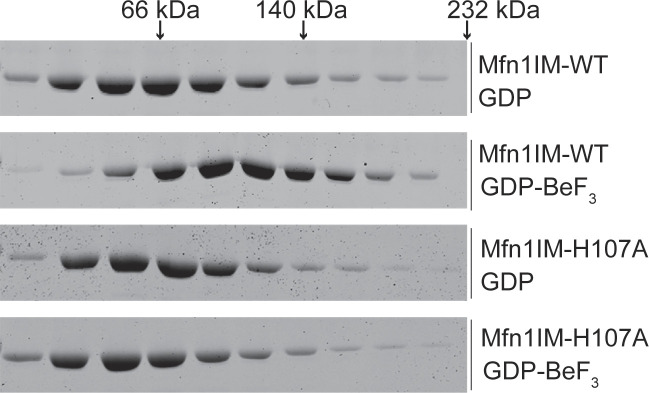
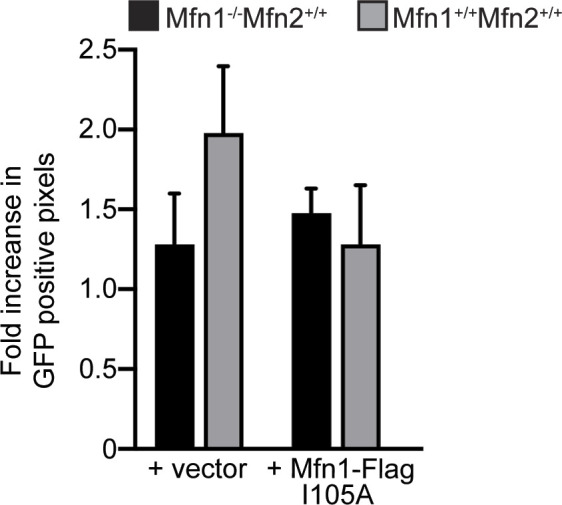
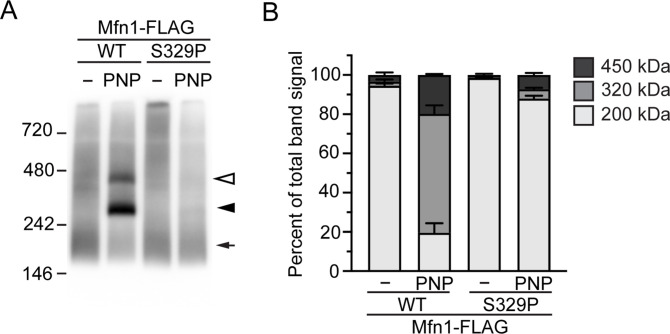
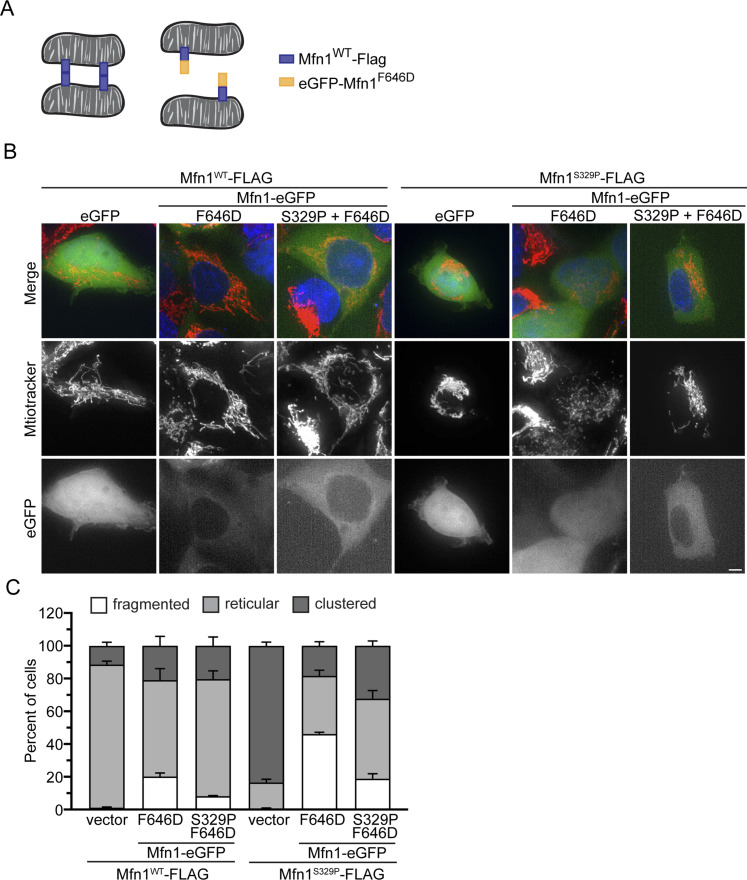
In vertebrates, mitochondrial outer membrane fusion is mediated by two mitofusin paralogs, Mfn1 and Mfn2, conserved dynamin superfamily proteins. Here, we characterize a variant of mitofusin reported in patients with CMT2A where a serine is replaced with a proline (Mfn2-S350P and the equivalent in Mfn1, S329P). This serine is in a hinge domain (Hinge 2) that connects the globular GTPase domain to the adjacent extended helical bundle. We find that expression of this variant results in prolific and stable mitochondrial tethering that also blocks mitochondrial fusion by endogenous wild-type mitofusin. The formation of mitochondrial perinuclear clusters by this CMT2A variant requires normal GTPase domain function and formation of a mitofusin complex across two membranes. We propose that conformational dynamics mediated by Hinge 2 and regulated by GTP hydrolysis are disrupted by the substitution of proline at S329/S350 and this prevents progression from tethering to membrane fusion. Thus, our data are consistent with a model for mitofusin-mediated membrane fusion where Hinge 2 supports a power stroke to progress from the tethering complex to membrane fusion.


Conflict of interest statement

The authors declare that they have no conflict of interest.

Figures

Figure 1.
Figure 1.. Structure of Mfn1.
(A) Ribbon structure of Mfn1IM dimer in the open conformation bound to GDP (PDB: 5GOM) with the GTPase domain of one protomer in goldenrod, the second GTPase domain in dark blue, helical bundle 1 (HB1) in magenta, S329 highlighted in cyan, and GDP in red. (B) Structure of Mfn1IM dimer in the closed conformation bound to transition-state mimic GDP-BeF3 in red (PDB: 5YEW).
Figure 2.
Figure 2.. Expression of Mfn1S329P or Mfn2S350P causes perinuclear clustering of mitochondria.
(A) Representative images of Mfn1-null MEFs transduced with an empty vector (V), Mfn1WT-mNeonGreen, or Mfn1S329P-mNeonGreen. Mitochondria were labeled with MitoTracker Red CMXRos and visualized with live-cell fluorescence microscopy. Images represent maximum intensity projections. Scale bar = 5 μm. (A, B) Quantification of the mitochondrial morphology in the cell lines described in (A) and of wild-type MEFs transduced with an empty vector (V), Mfn1WT-mNeonGreen or Mfn1S329P-mNeonGreen. Error bars represent mean ± SEM from n = 3 separate blinded experiments (>100 cells per experiment). (C) Representative images of Mfn2-null MEFs transduced with an empty vector (V), Mfn2WT-mNeonGreen, or Mfn2S350P-mNeonGreen. Mitochondria were labeled with MitoTracker Red CMXRos and visualized with live-cell fluorescence microscopy. Images represent maximum intensity projections. Scale bar = 5 μm. (C, D) Quantification of the mitochondrial morphology in the cell lines described in (C) and wild-type MEFs transduced with an empty vector (V), Mfn2WT-mNeonGreen, or Mfn2S350P-mNeonGreen. Error bars represent mean ± SEM from n = 3 separate blinded experiments (>100 cells per experiment). (E) Representative electron micrographs of the indicated MEFs cell lines. Scale bar = 2 μm. Lower panels show higher magnification from boxed area in upper panel. Scale bar = 0.2 μm.
Figure 3.
Figure 3.. Mitochondrial clusters induced by proline variants do not have connected mitochondrial network.
(A) Representative images of Mfn1-null MEFs expressing mt-paGFP and transduced with an empty vector (V), Mfn1WT-FLAG, or Mfn1S329P-FLAG either 0 or 50 min after activation of mt-paGFP with a 405-nm laser, which is time = 0. Mitochondria were labeled with MitoTracker Red CMXRos and visualized with live-cell fluorescence microscopy. Images represent maximum intensity projections. Scale bar = 5 μm. (B) Representative images of Mfn2-null MEFs expressing mt-paGFP and transduced with an empty vector (V), Mfn2WT-FLAG, or Mfn2S350P-FLAG either 0 or 50 min after activation of mt-paGFP with a 405-nm laser, which is time = 0. Mitochondria were labeled with MitoTracker Red CMXRos and visualized with live-cell fluorescence microscopy. Images represent maximum intensity projections. Scale bar = 5 μm. (A, C) Quantification of the diffusion of mt-paGFP in the cell lines described in (A) and in wild-type MEFs (Mfn1+/+Mfn2+/+) transduced with an empty vector (V), Mfn1WT-FLAG, or Mfn1S329P-FLAG. Error bars represent mean ± SEM. n = 6/7 cells over two independent experiments. (B, D) Quantification of the diffusion of mt-paGFP in the cell lines described in (B) and in wild-type MEFs (Mfn1+/+Mfn2+/+) transduced with an empty vector (V), Mfn2WT-FLAG, or Mfn2S350P-FLAG. Error bars represent mean ± SEM. N = 9–11 cells over three independent experiments.
Figure S1.
Figure S1.. Representative images of mt-paGFP diffusion over 50 min.
Representative images of Mfn1-null or WT MEFs expressing mt-paGFP and transduced with an empty vector (V), Mfn1WT-FLAG, or Mfn1S329P-FLAG before activation of mt-paGFP (Pre) and 0, 10, 20, 30, 40, and 50 min following. Mitochondria were labeled with MitoTracker Red CMXRos and visualized with live-cell fluorescence microscopy. Images represent maximum intensity projections. Scale bar = 5 μm.
Figure S2.
Figure S2.. Representative images of mt-paGFP diffusion over 50 min.
Representative images of Mfn2-null or WT MEFs expressing mt-paGFP and transduced with an empty vector (V), Mfn2WT-FLAG, or Mfn2S350P-FLAG before activation of mt-paGFP (Pre) and 0, 10, 20, 30, 40, and 50 min following. Mitochondria were labeled with MitoTracker Red CMXRos and visualized with live-cell fluorescence microscopy. Images represent maximum intensity projections. Scale bar = 5 μm.
Figure S3.
Figure S3.. Structure of Mfn2.
Ribbon structure of Mfn2IM bound to GDP (PDB: 6FJK) with the GTPase domain in dark blue, helical bundle 1 (HB1) in magenta, S350 highlighted in cyan, R94 highlighted in green, and GDP in red.
Figure 4.
Figure 4.. Mitofusin proline variants induce rapid perinuclear clustering of mitochondria.
(A) Representative images of Flp-In TREx HEK293 expressing the indicated mitofusin variant after incubation with 0.2 μg/ml TET for 4 h. Mitochondria were labeled with MitoTracker Red CMXRos, and nuclei were labeled with NucBlue and visualized with live-cell fluorescence microscopy. Images represent maximum intensity projections. Scale bar = 5 μm. (A, B) Quantification of the mitochondrial morphology in the cell lines described in (A). Error bars represent mean ± SEM from n = 3 separate blinded experiments (>100 cells per experiment).
Figure S4.
Figure S4.. Mitofusin protein expression in Flp-In TREx HEK293 induced with 0.2 μg/ml TET.
(A) Whole-cell lysates prepared from the indicated cell lines incubated in the absence (−) or presence (+) of 0.2 μg/ml TET for 4 h were subject to SDS–PAGE and immunoblotting with α-Mfn1 and α-tubulin. Endogenous Mfn1 and Mfn1-FLAG are indicated with a line an arrowhead, respectively. (B) Whole-cell lysates prepared from the indicated cell lines incubated in the absence (−) or presence (+) of 0.2 μg/ml TET for 4 h were subject to SDS–PAGE and immunoblotting with α-Mfn2 and α-tubulin. Endogenous Mfn2 and Mfn2-FLAG are indicated with a line an arrowhead, respectively. (C) Whole-cell lysates prepared from the indicated cell lines incubated in the absence (−) or presence (+) of 0.2 μg/ml TET for the indicated time were subject to SDS–PAGE and immunoblotting with α-Mfn1 or α-Mfn2 and α-tubulin. (C, D) Quantification of the mitochondrial morphology in the cell lines described in (C). Error bars represent mean ± SEM from n = 3 separate blinded experiments (>100 cells per experiment).
Figure S5.
Figure S5.. Distribution of lysosome and endoplasmic reticulum are not affected by expression of mitofusin proline variants.
(A) Representative images of Flp-In TREx HEK293 expressing the indicated mitofusin variant after incubation with 0.2 μg/ml TET for 4 h. Mitochondria were labeled with MitoTracker Red CMXRos, lysosomes were labeled with LysoTracker, and nuclei were labeled with NucBlue and visualized by live-cell fluorescence microscopy. Images represent maximum intensity projections. Scale bar = 5 μm. (B) Representative images of Flp-In TREx HEK293 expressing the indicated mitofusin variant after induction of expression by incubation with 0.2 μg/ml TET for 4 h. Endoplasmic reticulum was labeled by expression of Sec61-eGFP and visualized by live-cell fluorescence microscopy. Images represent single z-slices near the coverslip. Scale bar = 5 μm.
Figure S6.
Figure S6.. Flp-In TREx HEK293 treated with nocodazole or shRNA targeting dynein heavy chain (DHC).
(A) Representative images of Flp-In TREx HEK293 expressing the indicated mitofusin variant after incubation with 0.2 μg/ml TET for 4 h in the presence of 0 or 5 nM nocodazole. Mitochondria were labeled with MitoTracker Red CMXRos. Cells were fixed and immunolabeled with anti-tubulin (α-Tub). Images represent maximum intensity projections. Scale bar = 5 μm. (B) Representative Western blot of α-DHC and α-tubulin in whole-protein extract from cells treated with either control shRNA (shLacZ) or shRNA against DHC (shDHC). Molecular-weight markers are indicated in kD on left. Percent knockdown represents mean knockdown of DHC n = 3 quantified by band intensities in Western blot normalized to whole-protein stain.
Figure 5.
Figure 5.. Perinuclear clustering of mitochondria by the proline variant is not dependent on dynein-mediated microtubule-based transport.
(A) Representative images of Flp-In TREx HEK293 expression indicated the mitofusin variant after incubation with 0.2 μg/ml TET for 4 h in the presence or absence of 5 nM nocodazole. Mitochondria were labeled with MitoTracker Red CMXRos, and nuclei were labeled with NucBlue and visualized by live-cell fluorescence microscopy. Images represent maximum intensity projections. Scale bar = 5 μm. (A, B) Quantification of the mitochondrial morphology in the cell lines described in (A). Error bars represent mean ± SEM from n = 3 separate and blinded experiments (>100 cells per experiment). (C) Representative images of Flp-In TREx HEK293 with shLacZ or shDHC and expressing the indicated mitofusin variant after incubation with 0.2 μg/ml TET for 4 h. Mitochondria were labeled with MitoTracker Red CMXRos, and nuclei were labeled with NucBlue and visualized by live-cell fluorescence microscopy. Images represent maximum intensity projections. Scale bar = 5 μm. (C, D) Quantification of the mitochondrial morphology in the cell lines described in (C). Error bars represent mean ± SEM from n = 3 separate and blinded experiments (>100 cells per experiment).
Figure S7.
Figure S7.. Mfn1IMS329P has normal GTPase activity.
(A) A kinetic plot of GTP hydrolysis of Mfn1IMWT and Mfn1IMS329P fit to an allosteric sigmoidal equation. (B) Table of kinetic parameters for Mfn1IMWT and Mfn1IMS329P: maximum velocity (Vmax), Hill coefficient (h) and Michaelis–Menten constant (Khalf). (C) Summary of key catalytic residues in Mfn1 with alanine substitutions and the reported impact on dimerization (G–G interface) and GTP hydrolysis. References are (1) Qi et al (2016), (2) Yan et al (2018), (3) Cao et al (2017), and (4) this work.
Figure 6.
Figure 6.. Mitofusin proline variants require GTPase activity to induce perinuclear clustering of mitochondria.
(A) Representative images of Mfn1-null MEFs expressing the indicated Mfn1-mNeonGreen variant. Mitochondria were labeled with MitoTracker Red CMXRos and visualized with live-cell fluorescence microscopy. Images represent maximum intensity projections. Scale bar = 5 μm. (A, B) Quantification of the mitochondrial morphology in the cell lines described in (A). Error bars represent mean ± SEM from n = 3 separate blinded experiments (>100 cells per experiment). (C) Representative images of Mfn2-null MEFs expression indicated the Mfn2-mNeonGreen variant. Mitochondria were labeled with MitoTracker Red CMXRos and visualized with live-cell fluorescence microscopy. Images represent maximum intensity projections. Scale bar = 5 μm. (C, D) Quantification of the mitochondrial morphology in the cell lines described in (C). Error bars represent mean ± SEM from at least n = 3 separate blinded experiments (>100 cells per experiment).
Figure S8.
Figure S8.. Mfn1IMH107A does not form a stable dimer.
Mfn1IMWT or Mfn1IMH107A were incubated with either GDP alone or GDP•BeF3 and then loaded onto a 5–20% linear sucrose gradient and spun at 100,000g for 16 h. Fractions were collected and subject to SDS–PAGE and Coomassie staining.
Figure S9.
Figure S9.. Mfn1I105A does not support mitochondrial fusion and blocks mitochondrial fusion by wild-type mitofusins.
Wild-type or Mfn1-null MEFs expressing mt-paGFP and transduced with empty vector (V) or Mfn1I105A-FLAG were imaged either 0 min or 50 min after activation of mt-paGFP with a 405-nm laser, which is time = 0. The mitochondrial network was labeled with MitoTracker Red CMXRos and visualized with live-cell fluorescence microscopy. Quantification of the diffusion of mt-paGFP in the indicated cell lines is shown. Error bars represent mean ± SEM. n = 6/7 cells over three independent experiments.
Figure 7.
Figure 7.. Mfn1S329P is defective for GTP-dependent oligomerization.
(A) Representative blue native–PAGE of mitochondria isolated from Flp-In TREx cells expressing Mfn1WT-FLAG or Mfn1S329P-FLAG after incubation with 0.2 μg/ml TET for 4 h. Mitochondria were untreated or incubated in the presence of GMP-PNP (PNP), followed by solubilization and separation by blue native–PAGE and immunoblotted with α-FLAG. Arrow indicates ∼200-kD species, closed arrowhead indicates ∼320-kD species, and open arrowhead indicates ∼450-kD species. Molecular-weight markers are indicated in kD on left. (A, B) Quantification of native mitofusin species indicated in A. Error bars represent mean ± SEM from n = 3 separate experiments.
Figure 8.
Figure 8.. Cytosolic mitofusin blocks mitochondrial tethering by mitofusin proline variants.
(A) Schematic of mitochondria tethered by mitofusin trans complexes (left) and mitochondria with mitofusin trans complexes blocked by interaction with the cytosolic variant of mitofusin (F646D) (right). (B) Representative images of Flp-In TREx HEK293 transfected with eGFP, eGFP-Mfn1F646D, or eGFP-Mfn1F646D-S329P and expressing either Mfn1WT-FLAG or Mfn1S329P-FLAG after incubation with 0.2 μg/ml TET for 4 h. Mitochondria were labeled with MitoTracker Red CMXRos, and nuclei were labeled with NucBlue and visualized by live-cell fluorescence microscopy. Images represent maximum intensity projections. Scale bar = 5 μm. (B, C) Quantification of the mitochondrial morphology in the cell lines described in (B). Error bars represent mean ± SEM from n = 3 separate blinded experiments (≥100 cells per experiment).

References

    1. Al-Mehdi AB, Pastukh VM, Swiger BM, Reed DJ, Patel MR, Bardwell GC, Pastukh VV, Alexeyev MF, Gillespie MN (2012) Perinuclear mitochondrial clustering creates an oxidant-rich nuclear domain required for hypoxia-induced transcription. Sci Signal 5: ra47. 10.1126/scisignal.2002712 - DOI - PMC - PubMed
    1. Agarwal S, Ganesh S (2020) Perinuclear mitochondrial clustering, increased ROS levels, and HIF1 are required for the activation of HSF1 by heat stress. J Cell Sci 133: jcs245589. 10.1242/jcs.245589 - DOI - PubMed
    1. Alexander C, Votruba M, Pesch UE, Thiselton DL, Mayer S, Moore A, Rodriguez M, Kellner U, Leo-Kottler B, Auburger G, et al. (2000) OPA1, encoding a dynamin-related GTPase, is mutated in autosomal dominant optic atrophy linked to chromosome 3q28. Nat Genet 26: 211–215. 10.1038/79944 - DOI - PubMed
    1. Anton F, Fres JM, Schauss A, Pinson B, Praefcke GJK, Langer T, Escobar-Henriques M (2011) Ugo1 and Mdm30 act sequentially during Fzo1-mediated mitochondrial outer membrane fusion. J Cell Sci 124: 1126–1135. 10.1242/jcs.073080 - DOI - PubMed
    1. Anton V, Buntenbroich I, Schuster R, Babatz F, Simões T, Altin S, Calabrese G, Riemer J, Schauss A, Escobar-Henriques M (2019) Plasticity in salt bridge allows fusion-competent ubiquitylation of mitofusins and Cdc48 recognition. Life Sci Alliance 2: e201900491. 10.26508/lsa.201900491 - DOI - PMC - PubMed

Publication types

LinkOut - more resources