

Imaging Characteristics of Choroid Plexuses in Presymptomatic Multiple Sclerosis: A Retrospective Study
- PMID: 36229188
- PMCID: PMC9562043
- DOI: 10.1212/NXI.0000000000200026
Imaging Characteristics of Choroid Plexuses in Presymptomatic Multiple Sclerosis: A Retrospective Study
Abstract
Background and objectives: Recent imaging studies have suggested a possible involvement of the choroid plexus (CP) in multiple sclerosis (MS). Here, we investigated whether CP changes are already detectable at the earliest stage of MS, preceding symptom onset.
Methods: This study is a retrospective analysis of 27 patients with presymptomatic MS, 97 patients with clinically definite MS (CDMS), and 53 healthy controls (HCs) who underwent a cross-sectional 3T-MRI acquisition; of which, 22 MS, 19 HCs, and 1 presymptomatic MS (evaluated 8 months before conversion to CDMS) also underwent translocator protein (TSPO) 18F-DPA-714 PET and were included in the analysis. CPs were manually segmented on 3D T1-weighted images for volumetric analysis. CP 18F-DPA-714 uptake, reflecting inflammation, was calculated as the average standardized uptake value (SUV). Multivariable regressions adjusted for age, sex, and ventricular and brain volume were fitted to test CP volume differences between presymptomatic patients and MS or HCs. For the presymptomatic case who also had 18F-DPA-714 PET, CP SUV differences with MS and HCs were assessed through Crawford-Howell tests. To provide further insight into the interpretation of 18F-DPA-714-PET uptake at the CP level, a postmortem analysis of CPs in MS vs HCs was performed to characterize the cellular localization of TSPO expression.
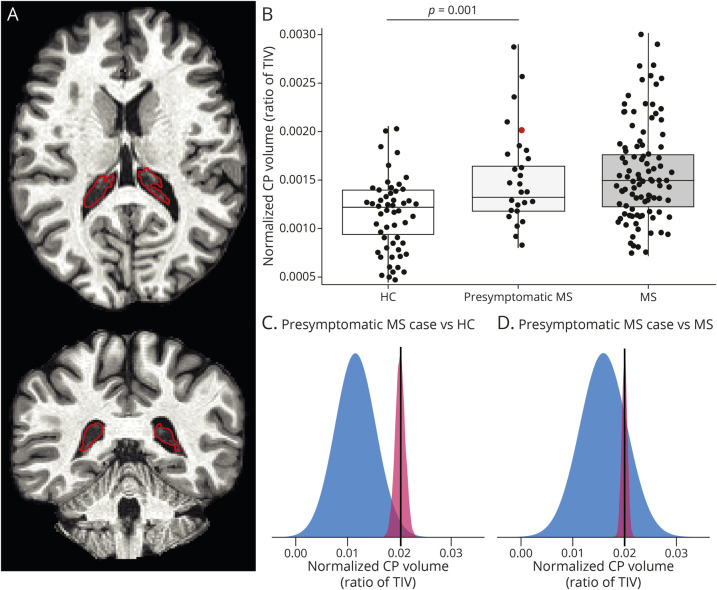
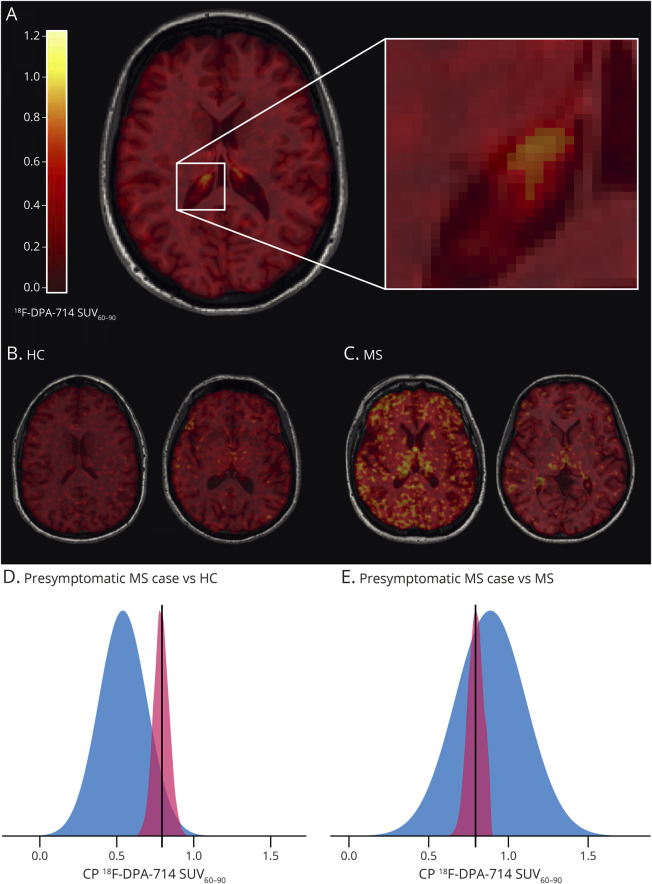
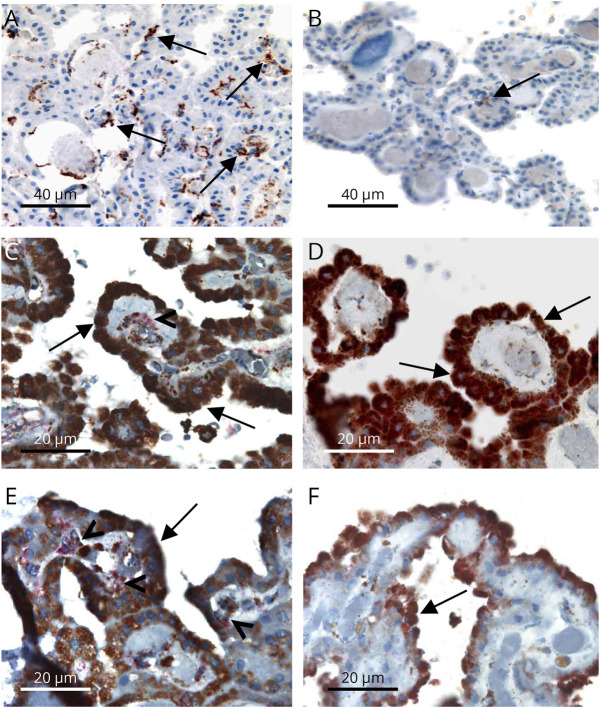
Results: Compared with HCs, patients with presymptomatic MS had 32% larger CPs (β = 0.38, p = 0.001), which were not dissimilar to MS CPs (p = 0.69). Moreover, in the baseline scan of the presymptomatic case who later on developed MS, TSPO PET showed 33% greater CP inflammation vs HCs (p = 0.04), although no differences in 18F-DPA-714 uptake were found in parenchymal regions vs controls. CP postmortem analysis identified a population of CD163+ mononuclear phagocytes expressing TSPO in MS, possibly contributing to the increased 18F-DPA-714 uptake.
Discussion: We identified an imaging signature in CPs at the presymptomatic MS stage using MRI; in addition, we found an increased CP inflammation with PET in a single presymptomatic patient. These findings suggest a role of CP imaging as an early biomarker and argue for the involvement of the blood-CSF barrier dysfunction in disease development.
Trial registration information: APHP-20210727144630, EudraCT-Number: 2008-004174-40; ClinicalTrials.gov: NCT02305264, NCT01651520, and NCT02319382.
Copyright © 2022 The Author(s). Published by Wolters Kluwer Health, Inc. on behalf of the American Academy of Neurology.
Figures
References
-
- Ghersi-Egea JF, Strazielle N, Catala M, Silva-Vargas V, Doetsch F, Engelhardt B. Molecular anatomy and functions of the choroidal blood-cerebrospinal fluid barrier in health and disease. Acta Neuropathol. 2018;135(3):337-361. - PubMed
-
- Johanson CE, Stopa EG, McMillan PN. The blood-cerebrospinal fluid barrier: structure and functional significance. Methods Mol Biol. 2011;686:101-131. - PubMed
-
- Ricigliano VAG, Morena E, Colombi A, et al. . Choroid plexus enlargement in inflammatory multiple sclerosis: 3.0-T MRI and translocator protein PET evaluation. Radiology. 2021;301(1):166-177. - PubMed
Publication types
MeSH terms
Substances
Associated data
LinkOut - more resources
Full Text Sources
Medical
Research Materials
Miscellaneous