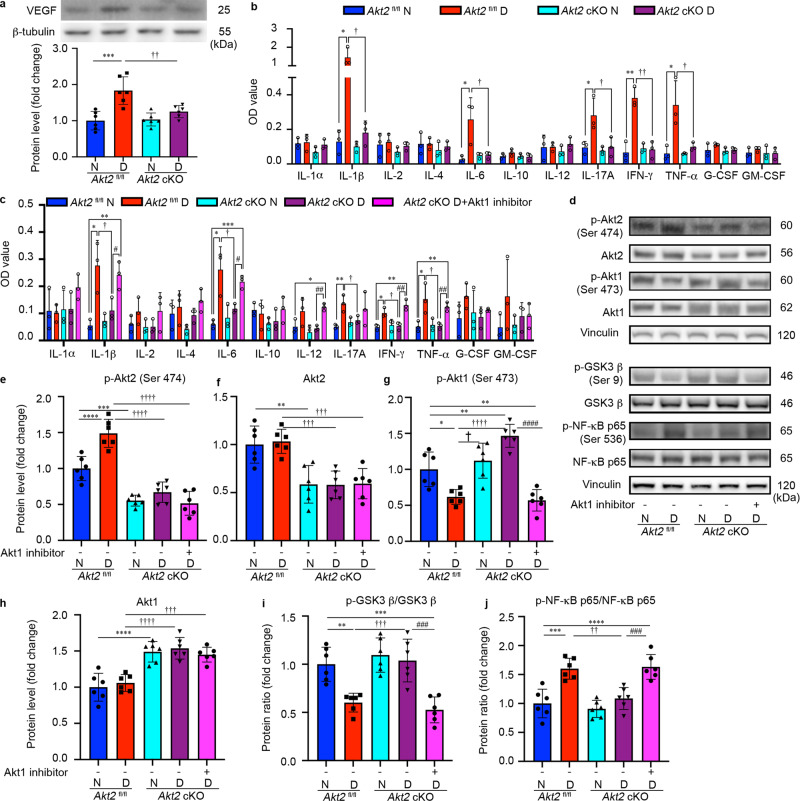
Fig. 9. Inflammatory cytokines are elevated in the retina/RPE of Akt2fl/fl diabetic mice, an effect inhibited in Akt2 cKO mice; however inhibition of Akt1 reverses this protective effect.
a Diabetes-induced increase of retinal VEGF was inhibited in Akt2 cKO mice. b Diabetes increased the RPE/retinal expression of inflammatory cytokines, including IL-1β, IL-6, IL-17A, IFN-γ and TNF-α, in Akt2fl/fl mice compared to Akt2fl/fl nondiabetic animals. Akt2 cKO inhibits diabetes-induced elevation of these inflammatory cytokines. c RPE explants were obtained from Akt2fl/fl and Akt2 cKO nondiabetic and diabetic mice and cultured in 5 mM and 25 mM glucose medium, respectively, for 48 h. The spent medium was collected and ELISA assays performed. As expected, Akt2 cKO inhibited the release of inflammatory cytokines caused by diabetes, including IL-1β, IL-6, IL-12, IL-17A, IFN-γ and TNF-α. Such inhibitory effects were abolished if an Akt1 inhibitor was added to the RPE explants (isolated from Akt2 cKO diabetic mice) culture. d RPE explant culture was collected for western blot analysis. e–j
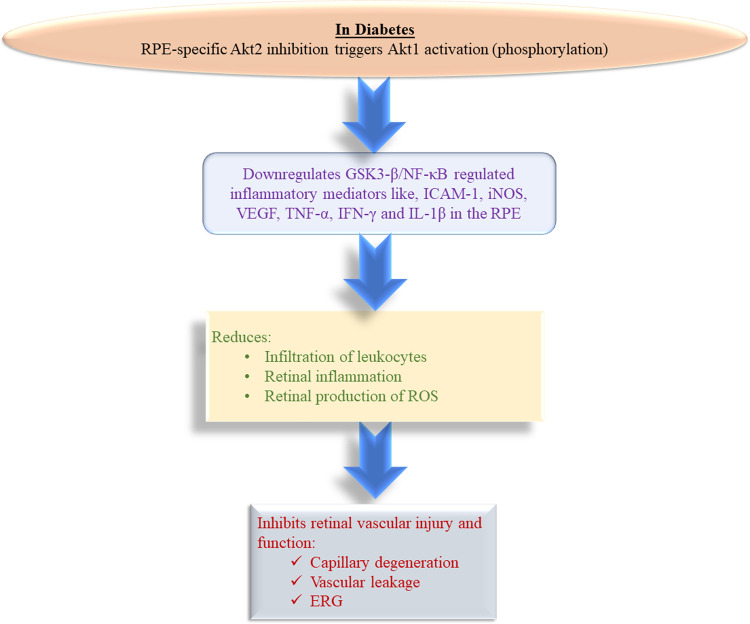
Akt2 cKO increased the level of phospho-Akt1 in the RPE from diabetic mice and inhibited the diabetes-induced reduction in the ratio of p-GSK3β/total GSK3β, as well as the diabetes-induced elevation in the ratio of p-NF-κB p65/total NF-κB p65. The presence of the Akt1 inhibitor in the Akt2 cKO diabetic mouse RPE explants significantly reversed this protective effect for the levels of p-Akt1, p-GSK3β/total GSK3β and p-NF-κB p65/total NF-κB p65. In (a–c, e–j), data are shown as Mean ± SD. *p < 0.05, **p < 0.01, ***p < 0.001, and ***p < 0.0001 versus the Akt2fl/fl nondiabetic mice. †p < 0.05, ††p < 0.01, †††p < 0.001, and ††††p < 0.0001 versus Akt2fl/fl diabetic mice. #p < 0.05, ##p < 0.01, ###p < 0.001, and ###p < 0.0001 versus Akt2 cKO diabetic group. Statistical tests used in (a, e–j) is One-way ANOVA followed by a Tukey’s post hoc test, n = 6 mice for each group. Statistical test used in (b, c) is two tailed, unpaired t-test, n = 6 animals; 3 samples in each group; each sample was composed of 2 animals. Exact p values are: a
p = 0.0001 (Akt2
fl/fl D vs. Akt2
fl/fl N), p = 0.0049 (Akt2 cKO D vs. Akt2
fl/fl D), b IL-1β: p = 0.0342, 95% CI 0.4993 to 2.146, R2 = 0.8326 (Akt2
fl/fl D vs. Akt2
fl/fl N), p = 0.0128, 95% CI −2.095 to −0.4477, R2. = 0.8212 (Akt2 cKO D vs. Akt2
fl/fl D); IL-6: p = 0.0352, 95% CI 0.026 to 0.4347, R2 = 0.7101 (Akt2
fl/fl D vs. Akt2
fl/fl N), p = 0.0483, 95% CI −0.4111 to −0.002517, R2 = 0.6639 (Akt2 cKO D vs. Akt2
fl/fl D); IL-17A: p = 0.0388, 95% CI 0.01557 to 0.3558, R2 = 0.6966 (Akt2
fl/fl D vs. Akt2
fl/fl N), p = 0.0374, 95% CI −0.3671 to −0.01823, R2 = 0.706 (Akt2 cKO D vs. Akt2
fl/fl D); IFN-γ: p = 0.0028, 95% CI 0.1819 to 0.4488, R2 = 0.915 (Akt2
fl/fl D vs. Akt2
fl/fl N), p = 0.0026, 95% CI −0.4227 to −0.1746, R2 = 0.9178 (Akt2 cKO D vs. Akt2
fl/fl D); TNF-α: p = 0.0291, 95% CI 0.04679 to 0.5145, R2 = 0.7351 (Akt2
fl/fl D vs. Akt2
fl/fl N), p = 0.0418, 95% CI −4694 to −0.01459, R2 = 0.6858 (Akt2 cKO D vs. Akt2
fl/fl D). c IL-1β: p = 0.0154, 95% CI 0.06971 to 0.373, R2 = 0.8042 (Akt2
fl/fl D vs. Akt2
fl/fl N), p = 0.048, 95% CI −0.3297 to −0.002349, R2 = 0.6684 (Akt2 cKO D vs. Akt2
fl/fl D), p = 0.0274, 95% CI 0.2393 to 0.2387, R2 = 0.7424 (Akt2 cKO D + Akt1 inhibitor vs. Akt2 cKO D), p = 0.0042, 95% CI 0.09867 to 0.2747, R2 = 0.8966 (Akt2 cKO D + Akt1 inhibitor vs. Akt2
fl/fl N); IL-6: p = 0.0154, 95% CI 0.06357 to 0.3391, R2 = 0.8045 (Akt2
fl/fl D vs. Akt2
fl/fl N), p = 0.044, 95% CI −0.2824 to −0.006241, R2 = 0.678 (Akt2 cKO D vs. Akt2
fl/fl D), p = 0.041, 95% CI 0.05295 to 0.1464, R2 = 0.8977 (Akt2 cKO D + Akt1 inhibitor vs. Akt2 cKO D), p = 0.007, 95% CI 0.1109 to 0.2024, R2 = 0.9576 (Akt2 cKO D + Akt1 inhibitor vs. Akt2
fl/fl N); IL-12: p = 0.0122, 95% CI 0.02614 to 0.1185, R2 = 0.8254 (Akt2 cKO D + Akt1 inhibitor vs. Akt2
fl/fl N), p = 0.0012, 95% CI 0.05197 to 0.1054, R2 = 0.9436 (Akt2 cKO D + Akt1 inhibitor vs. Akt2 cKO D); IL-17A: p = 0.0097, 95% CI 0.03451 to 0.1368, R2 = 0.8439 (Akt2
fl/fl D vs. Akt2
fl/fl N), p = 0.0358, 95% CI −0.1173 to −0.006687, R2 = 0.7077 (Akt2 cKO D vs. Akt2
fl/fl D); IFN-γ: p = 0.0114, 95% CI 0.0195 to 0.08512, R2 = 0.8308 (Akt2
fl/fl D vs. Akt2
fl/fl N), p = 0.0227, 95% CI −0.08379 to −0.01087, R2 = 0.7646 (Akt2 cKO D vs. Akt2
fl/fl D), p = 0.0055, 95% CI 0.03739 to 0.1153, R2 = 0.881 (Akt2 cKO D + Akt1 inhibitor vs. Akt2 cKO D), p = 0.0031, 95% CI 0.0458 to 0.1169, R2 = 0.9099 (Akt2 cKO D + Akt1 inhibitor vs. Akt2
fl/fl N); TNF-α: p = 0.0404, 95% CI 0.00717 to 0.1955, R
2 = 0.6909 (Akt2
fl/fl D vs. Akt2
fl/fl N), p = 0.0392, 95% CI −0.1894 to −0.007913, R2 = 0.6949 (Akt2 cKO D vs. Akt2
fl/fl D), p = 0.0038, 95% CI 0.03767 to 0.1017, R2 = 0.9014 (Akt2 cKO D + Akt1 inhibitor vs. Akt2 cKO D), p = 0.0078, 95% CI 0.03166 to 0.113, R2 = 0.8591 (Akt2 cKO D + Akt1 inhibitor vs. Akt2
fl/fl N). e
p = 0.0003 (Akt2 cKO N vs. Akt2
fl/fl N), p < 0.0001 for the rest. f
p = 0.0018 (Akt2 cKO N vs. Akt2
fl/fl N), p = 0.0016 (Akt2 cKO D vs. Akt2
fl/fl D), p = 0.0009 (Akt2 cKO D + Akt1 inhibitor vs. Akt2
fl/fl D). g
p = 0.0124 (Akt2
fl/fl D vs. Akt2
fl/fl N), p = 0.0019 (Akt2 cKO D vs. Akt2
fl/fl N), p = 0.0043 (Akt2 cKO D + Akt1 inhibitor vs. Akt2
fl/fl N), p = 0.018 (Akt2 cKO N vs. Akt2
fl/fl D), p < 0.0001 for the rest. h p = 0.0007 (Akt2 cKO D + Akt1 inhibitor vs. Akt2
fl/fl N), p < 0.0001 for the rest. i
p = 0.003 (Akt2
fl/fl D vs. Akt2
fl/fl N), p = 0.0004 (Akt2 cKO D + Akt1 inhibitor vs. Akt2
fl/fl N, Akt2 cKO D vs. Akt2
fl/fl D), p = 0.0002 (Akt2 cKO D + Akt1 inhibitor vs. Akt2 cKO D). j
p = 0.0002 (Akt2
fl/fl D vs. Akt2
fl/fl N), p < 0.0001 (Akt2 cKO D + Akt1 inhibitor vs. Akt2
fl/fl N), p = 0.0012 (Akt2 cKO D vs. Akt2
fl/fl D), p = 0.0006 (Akt2 cKO D + Akt1 inhibitor vs. Akt2 cKO D). Source Data is provided in the Source Data file.