. 2022 Oct 13;13(1):6036.
doi: 10.1038/s41467-022-33780-1.

Single cell analysis of cribriform prostate cancer reveals cell intrinsic and tumor microenvironmental pathways of aggressive disease

Affiliations

Single cell analysis of cribriform prostate cancer reveals cell intrinsic and tumor microenvironmental pathways of aggressive disease

Hong Yuen Wong et al. Nat Commun. .

Abstract

Cribriform prostate cancer, found in both invasive cribriform carcinoma (ICC) and intraductal carcinoma (IDC), is an aggressive histological subtype that is associated with progression to lethal disease. To delineate the molecular and cellular underpinnings of ICC/IDC aggressiveness, this study examines paired ICC/IDC and benign prostate surgical samples by single-cell RNA-sequencing, TCR sequencing, and histology. ICC/IDC cancer cells express genes associated with metastasis and targets with potential for therapeutic intervention. Pathway analyses and ligand/receptor status model cellular interactions among ICC/IDC and the tumor microenvironment (TME) including JAG1/NOTCH. The ICC/IDC TME is hallmarked by increased angiogenesis and immunosuppressive fibroblasts (CTHRC1+ASPN+FAP+ENG+) along with fewer T cells, elevated T cell dysfunction, and increased C1QB+TREM2+APOE+-M2 macrophages. These findings support that cancer cell intrinsic pathways and a complex immunosuppressive TME contribute to the aggressive phenotype of ICC/IDC. These data highlight potential therapeutic opportunities to restore immune signaling in patients with ICC/IDC that may afford better outcomes.


Conflict of interest statement

P.J.H., B.H.P., Y.J.K., and J.R. declare the following potential competing interests. P.J.H. receives royalties from Horizon Discovery, LTD for the generation of targeted cell lines under a licensing agreement between Horizon Discovery, LTD and Johns Hopkins University. B.H.P. is a paid consultant for Jackson Labs, EQRx, Hologic, Sermonix, is a paid scientific advisory board member for Celcuity Inc., and receives research funding from GE Healthcare, Lilly, and Pfizer. Under separate licensing agreements between Horizon Discovery, LTD and The Johns Hopkins University, B.H.P. is entitled to a share of royalties received by the University on sales of products. The terms of this arrangement are being managed by Johns Hopkins University in accordance with its conflict-of-interest policies. Y.J.K. is a full-time stockholding employee of Regeneron with stock options. J.R. is a founder, scientific advisory board member, and stockholder of Sitryx Therapeutics, a scientific advisory board member and stockholder of Caribou Biosciences, a member of the scientific advisory board of Nirogy Therapeutics, has consulted for Merck, Pfizer, and Mitobridge within the past three years, and has received research support from Incyte Corp., Calithera Biosciences, and Tempest Therapeutics. The other authors declare no competing interests.

Figures
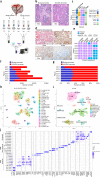
Fig. 1
Fig. 1. ScRNAseq of ICC/IDC-enriched and benign-enriched prostate.
a Schematic of scRNAseq protocol of ICC/IDC-enriched and benign-enriched prostate. b Representative rapid frozen H&E of benign-enriched and ICC/IDC-enriched prostate isolated for scRNAseq at 100x, bar = 200 µm, (n = 7 biologically independent samples). This image and the six additional representative images are in Supplementary Fig. 1. c Patient clinical characteristics. d Representative HMWCK (High Molecular Weight Cytokeratin), TP63, AMACR, AR, ERG, and PTEN expression by IHC on patient FFPE prostate tissue from RP at 100x, bar = 100 µm, (n = 7 biologically independent samples). This image and the six additional representative images are in Supplementary Fig. 2a. e AMACR, AR, ERG, and PTEN expression by IHC per patient. f, g The number (f) and percent (g) of benign-enriched and ICC/IDC-enriched cells per patient. h, i Unsupervised graph-based clustering of all samples visualized by UMAP delineated by cluster (h) and cell-type (i). j Bubble plot of representative cell-type specific markers across all clusters. Source data are provided as a Source Data file.
Fig. 2
Fig. 2. Epithelial and microenvironmental cell types were altered in prostate ICC/IDC.
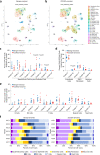
a, b Unsupervised graph-based clustering of all samples visualized by UMAP delineated by benign-enriched (a) and ICC/IDC-enriched (b) prostate. ce Percent total of EpCAM+ (c), EpCAM-/CD45- (d), and CD45+ (e) benign-enriched and ICC/IDC-enriched prostate cells per cluster. Graphs shown as mean ± SEM and analyzed by Wilcoxon matched-pair signed rank two-tailed test; n = 7 biologically independent samples. The partial graph (endothelial cells) in d is also shown in Fig. 4 (g). f Percent of cell type analyzed per patient delineated by benign-enriched and ICC/IDC-enriched prostate. Source data are provided as a Source Data file.
Fig. 3
Fig. 3. Increased SCHLAP1 and JAG1 in prostate ICC/IDC.
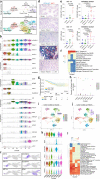
a Unsupervised graph-based clustering of epithelial cell clusters (2, 5, 6, 10, 11, 12, 21) separated by benign-enriched and ICC/IDC-enriched prostate. b, c Violin (b) and feature (c) plots of gene expression in epithelial cell clusters. d, e Representative images at 20x, bar = 10 µm (d) and quantification (e) of SCHLAP1 and JAG1 expression by RNAscope in ICC1-7 at RP for benign prostate luminal epithelial cells, Gleason pattern 3 prostate cancer, and ICC (n = 7 biologically independent samples). Quantification of SCHLAP1 and JAG1 in an extended validation RP cohort of benign prostate luminal epithelial cells (n = 20) as well as Gleason pattern 3 (n = 18), Gleason pattern 4 non-ICC (NC) (n = 14), ICC/IDC (n = 11), and Gleason pattern 5 (n = 6) prostate cancer. A total of n = 23 biologically independent samples were assessed for SCHLAP1 and JAG1 expression with samples having more than one histology. Quantification of SCHLAP1 and JAG1 expression by H-score (intensity x percent expression). Graphs are shown as mean ± SEM and analyzed by one-way ANOVA with Tukey’s multiple comparisons. f PssGSEA of hallmark pathways altered in ICC/IDC cancer cells (clusters 5, 6, and 11) compared to benign luminal epithelial cells in cluster 12. g Kaplan–Meier and log-rank test of progression-free survival in the TCGA PanCancer Atlas prostate adenocarcinoma for JAG1 by median expression (n = 492). h Percent of patient cells per cluster after re-clustering clusters 5, 6, and 11 into 7 clusters (CRIB-0 through CRIB-6). i, j UMAP visualization of re-clustering of clusters 5, 6, and 11 (CRIB-0 through CRIB-6) color-coded by cluster (i) and by patient (j). k Violin plots of gene expression in CRIB-0 through CRIB-6. l PssGSEA of hallmark pathways altered in benign epithelial clusters in ICC/IDC-enriched prostate compared to benign-enriched prostate. Source data are provided as a Source Data file.
Fig. 4
Fig. 4. Increased JAG1/NOTCH signaling and angiogenesis in the prostate ICC/IDC TME.
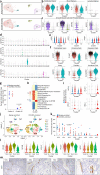
a Unsupervised graph-based clustering of all samples visualized by UMAP highlighted for endothelial clusters 0 and 22 and SMC cluster 13 delineated by benign-enriched and ICC/IDC-enriched prostate. b Violin plots of endothelial, blood, and lymphoid marker expression in clusters 0 and 22. c Violin plots of SMC and pericyte markers in clusters 13 and 20. d Violin plots of NOTCH receptor expression in clusters 0–25. e Violin plots of NOTCH-induced genes in endothelial clusters 0 and 22 and SMC cluster 13 delineated by benign-enriched and ICC/IDC-enriched prostate. f Violin plots of markers differentially enriched in cluster 0 compared to cluster 22. g Percent total of EpCAM-/CD45- benign-enriched and ICC/IDC-enriched prostate cells per endothelial cluster (0 and 22). The graph shown as mean ± SEM and analyzed by Wilcoxon matched-pair signed rank two-tailed test; n = 7 biologically independent samples. The graph is also shown as part of Fig. 2d. h PssGSEA of hallmark pathways in ICC/IDC-enriched prostate compared to benign-enriched prostate in clusters 0 and 22. i Violin plots of markers in ICC/IDC-enriched prostate compared to benign-enriched prostate in clusters 0 and 22. j UMAP visualization of cluster 13 after re-clustering. k Percent of cells in clusters 13–0 through 13–7. The graph is shown as mean ± SEM and analyzed by Wilcoxon matched-pair signed rank two-tailed test; n = 7 biologically independent samples. l Violin plots of markers in clusters 13–0 through 13–3. m Representative images of CD31 expression by IHC in ICC/IDC prostate cancer from RP (n = 7 biologically independent samples) at 100x (bar = 100 µm) and 400x. Source data are provided as a Source Data file.
Fig. 5
Fig. 5. CAFÉ CAF are enriched in ICC/IDC and are associated with worse outcomes.
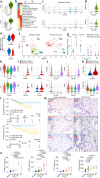
a Violin plots of fibroblast marker expression in clusters 13 and 20. b PssGSEA of hallmark pathways altered in ICC/IDC-enriched compared to benign-enriched prostate in clusters 13 and 20. c Violin plots of ligand expression in epithelial clusters. d Violin plots of receptor expression in clusters 13 and 20. e Violin plots of peri-epithelial (APOD) and interstitial (C7) fibroblast markers in ICC/IDC-enriched compared to benign-enriched prostate in cluster 20. f UMAP visualization of unsupervised graph-based re-clustering of cluster 20 (F0–F3) separated by benign-enriched and ICC/IDC-enriched prostate. g Cell percentage per cluster from ICC/IDC-enriched and benign-enriched regions after re-clustering cluster 20 (F0–F3). The graph is shown as mean ± SEM and analyzed by Wilcoxon matched-pair signed rank two-tailed test; n = 7 biologically independent samples. h Violin plots of marker gene expression in clusters F0-F3. i, j, k Violin plots of CAFÉ CAF gene expression in cluster 20 differentiated by ICC/IDC-enriched and benign-enriched prostate (i, k) and in clusters F0–F3 (j, k). l Kaplan–Meier and log-rank test of progression-free survival in the TCGA PanCancer Atlas Prostate Adenocarcinoma (n = 492) for the CAFÉ CAF signature. Kaplan–Meier and log-rank test of disease-free survival in the MSKCC Prostate Adenocarcinoma for the CAFÉ CAF signature (n = 131). m, n Representative images at 400x, bar = 10 µm (m) and quantification (n) of expression in a combined RP prostate cancer cohort of new and historical samples adjacent to benign prostate (CTHRC1 n = 17, ASPN n = 40, FAP n = 27, and ENG n = 26), Gleason pattern 3 (CTHRC1 n = 6, ASPN n = 24, FAP n = 15, and ENG n = 16), Gleason pattern 4 non-ICC (G4 NC; CTHRC1 n = 9, ASPN n = 24, FAP n = 15, and ENG n = 15), ICC/IDCC (CTHRC1 n = 7, ASPN n = 21, FAP n = 12, and ENG n = 12), and Gleason pattern 5 (G5; CTHRC1 n = 6, ASPN n = 6, FAP n = 6, and ENG n = 6) prostate cancer. N = 42 biologically independent samples were used to assess CTHRC1, ASPN, FAP, and ENG expression with samples having more than one histology for assessment and overlap between markers. Graphs are shown as mean ± SEM and analyzed by one-way Anova with Tukey’s Multiple Comparisons. Source data are provided as a Source Data file.
Fig. 6
Fig. 6. Immune exclusion, reduced T cell fraction and clonality, and increased T cell dysfunction in the prostate ICC/IDC TME.
a Quantification of percent CD45+ cells by flow cytometry from paired samples of benign-enriched and ICC/IDC-enriched prostate. Graph shown as mean ± SEM analyzed by paired two-tailed t-test; n = 4 biologically independent samples. FACS gating strategies shown in Supplementary Fig. 10a. b Representative images of inflammatory cells (red arrow) in benign-enriched regions and IDC/ICC-enriched regions by H & E at 100x, bar = 50 µm, (n = 7 biologically independent samples). c, d Percent T cells of the immune fraction by individual patient (c) and collectively (d) for benign-enriched and ICC/IDC-enriched prostate. Graph in d shown as mean ± SEM analyzed by Wilcoxon matched-pair signed rank two-tailed test; n = 7 biologically independent samples. e, f Simpson Clonality by individual patient (e) and collective (f) for benign-enriched and ICC/IDC-enriched prostate. Graph in f shown as mean ± SEM analyzed by Wilcoxon matched-pair signed rank two-tailed test; n = 7 biologically independent samples. g Percentage of T cells contracted or expanded between benign-enriched and ICC/IDC-enriched prostate. h Clonotype frequency between benign-enriched and ICC/IDC-enriched prostate. i Unsupervised graph-based clustering of all samples visualized by UMAP highlighted for T cell clusters 1, 3, 7, 9, 17, and 23 delineated by benign-enriched and ICC/IDC-enriched prostate. j, k Violin (j) and feature plots (k) of clusters 1, 3, 7, 9, 17, and 23 for immune and T cell markers. l Violin plots of markers in ICC/IDC-enriched prostate compared to benign-enriched prostate in clusters 1, 3, 7, 9, 17, and 23. m PssGSEA of hallmark pathways in ICC/IDC-enriched prostate compared to benign-enriched prostate in T cell clusters. n Pseudotime trajectory analysis for clusters 1, 3, 7, 9, 17, and 23. o Representative clonotype cluster location in benign-enriched and ICC/IDC-enriched prostate and quantification. The graph is shown as mean ± SEM analyzed by Wilcoxon matched-pair signed rank two-tailed test; n = 7 biologically independent samples. Source data are provided as a Source Data file.
Fig. 7
Fig. 7. Increased C1QB+TREM2+APOE+ M2 macrophages in prostate ICC/IDC.
a Unsupervised graph-based clustering of all samples visualized by UMAP highlighted for myeloid clusters 4 and 18 delineated by benign-enriched and ICC/IDC-enriched prostate. The dotted area demarks a subcluster of cells increased in ICC/IDC-enriched regions compared to benign-enriched regions. b Violin plots of myeloid, monocyte, dendritic cell, and macrophage marker expression in clusters 4 and 18. c Feature plots of C1QB, TREM2, APOE, and M2 macrophage markers (CD163, MSR1, and MRC1) in clusters 4 and 18. d Violin plots of C1QB, TREM2, APOE, and M2 macrophage markers (CD163, MSR1, and MRC1) in clusters 4 and 18 separated by ICC/IDC-enriched and benign-enriched. e PssGSEA of hallmark pathways in ICC/IDC-enriched prostate compared to benign-enriched prostate cells in clusters 4 and 18. f Re-clustering of clusters 4 and 18 into six clusters (Mac0-Mac6) separated by ICC/IDC-enriched and benign-enriched prostate and demarked by the original clusters 4 and 18. gi Violin plots of markers in Mac0-Mac6. j Kaplan–Meier and log-rank test of progression-free survival in the TCGA PanCancer Atlas Prostate Adenocarcinoma for C1QB, TREM2, APOE, CD163, MRC1, and MSR1 signature (C1QB+TREM2+APOE+ M2 Signature) by median expression (n = 492). Kaplan-Meier and long-rank test of disease-free survival (DFS) in the MSKCC Prostate Adenocarcinoma for C1QB, TREM2, APOE, CD163, MRC1, and MSR1 signature (C1QB+TREM2+APOE+ M2 Signature) by median expression (n = 131).

References

    1. Epstein JI, Amin MB, Reuter VE, Humphrey PA. Contemporary gleason grading of prostatic carcinoma: an update with discussion on practical issues to implement the 2014 international society of urological pathology (isup) consensus conference on gleason grading of prostatic carcinoma. Am. J. Surg. Pathol. 2017;41:e1–e7. doi: 10.1097/PAS.0000000000000820. - DOI - PubMed
    1. Epstein JI. Prostate cancer grading: a decade after the 2005 modified system. Mod. Pathol. 2018;31:S47–S63. doi: 10.1038/modpathol.2017.133. - DOI - PubMed
    1. Pierorazio PM, Walsh PC, Partin AW, Epstein JI. Prognostic Gleason grade grouping: data based on the modified Gleason scoring system. BJU Int. 2013;111:753–760. doi: 10.1111/j.1464-410X.2012.11611.x. - DOI - PMC - PubMed
    1. Gleason DF. Classification of prostatic carcinomas. Cancer Chemother. Rep. 1966;50:125–128. - PubMed
    1. Haffner MC, Salles DC, Gao G, Epstein JI. Gleason pattern 4 with cribriform morphology on biopsy is associated with adverse clinicopathological findings in a prospective radical prostatectomy cohort. Hum. Pathol. 2020;98:74–80. doi: 10.1016/j.humpath.2020.02.004. - DOI - PubMed

Publication types