. 2022 Oct 13;13(1):6033.
doi: 10.1038/s41467-022-33723-w.

Spatiotemporal variations in retrovirus-host interactions among Darwin's finches

Affiliations

Spatiotemporal variations in retrovirus-host interactions among Darwin's finches

Jason Hill et al. Nat Commun. .

Abstract

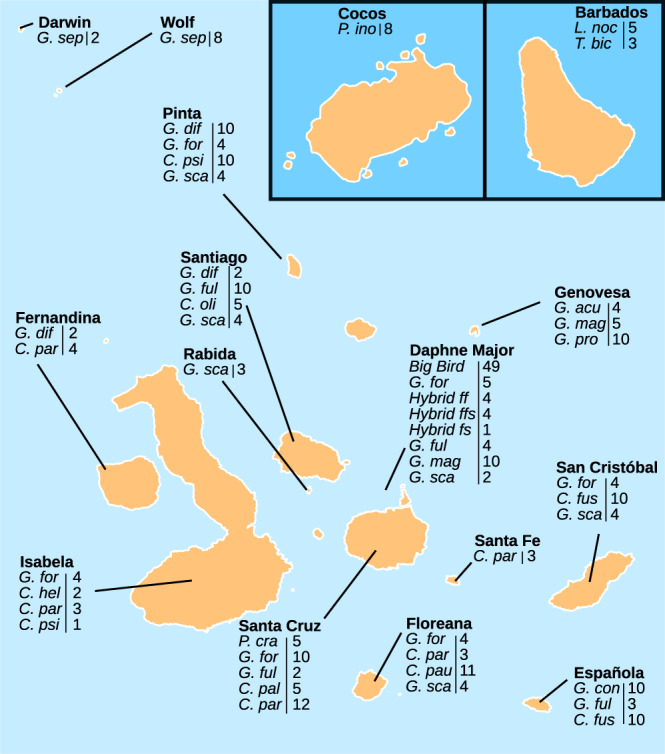
Endogenous retroviruses (ERVs) are inherited remnants of retroviruses that colonized host germline over millions of years, providing a sampling of retroviral diversity across time. Here, we utilize the strength of Darwin's finches, a system synonymous with evolutionary studies, for investigating ERV history, revealing recent retrovirus-host interactions in natural populations. By mapping ERV variation across all species of Darwin's finches and comparing with outgroup species, we highlight geographical and historical patterns of retrovirus-host occurrence, utilizing the system for evaluating the extent and timing of retroviral activity in hosts undergoing adaptive radiation and colonization of new environments. We find shared ERVs among all samples indicating retrovirus-host associations pre-dating host speciation, as well as considerable ERV variation across populations of the entire Darwin's finches' radiation. Unexpected ERV variation in finch species on different islands suggests historical changes in gene flow and selection. Non-random distribution of ERVs along and between chromosomes, and across finch species, suggests association between ERV accumulation and the rapid speciation of Darwin's finches.


Conflict of interest statement

The authors declare no competing interests.

Figures

Fig. 1
Fig. 1. Galápagos islands and sample locations.
A total of 293 Darwin’s finch samples representing 18 species, 4 hybrids and 2 outgroup species (Loxigilla noctis and Tiaris bicolor) from 16 islands, – were included in the study. Island names are indicated above finch species, hybrids and their respective sampling sizes. Finch species abbreviations: Big Bird lineage (Geospiza fortis x Geospiza conirostris), C. fus (Certhidea fusca), C. hel (Camarhynchus heliobates), C. pal (Camarhynchus pallidus), C. par (Camarhynchus parvulus), C. pau (Camarhynchus pauper), C. psi (Camarhynchus psittacula), C. oli (Certhidea olivacea), G. acu (Geospiza acutirostris), G. con (Geospiza conirostris), G. dif (Geospiza difficilis), G. for (Geospiza fortis), G. ful (Geospiza fuliginosa), G. mag (Geospiza magnirostris), G. pro (Geospiza propinqua), G. sca (Geospiza scandens), G. sep (Geospiza septentrionalis), Hybrid ff (Hybrid G. fortis x G. fuliginosa), Hybrid ffs (Hybrid G. fortis x G. fuliginosa x G. scandens), Hybrid fs (Hybrid G. fuliginosa x G. scandens), L. noc (Loxigilla noctis), T. bic (Tiaris bicolor), P. cra (Platyspiza crassirostris), P. ino (Pinaroloxias inornata).
Fig. 2
Fig. 2. Outline for identifying ERV segregation in host populations.
Overall strategy is to identify ERV anchored short reads that are located along host DNA. Flow-chart boxes indicate data and ovals indicate software. Briefly, an ERV mapping library (green box, Supplementary Data 1) is constructed using identified assembly ERVs from RetroTector, and placed in a phylogenetic context (Supplementary Data 2). Paired-end read mapping information in BAM files anchor ERV associated reads to reference assembly positions using RetroSeq to identify non-assembly insertions. On the other end, DELLY and CNVnator are used to identify unique assembly insertions. All locations are then collected into an ERV loci data frame (polymorphic ERVs, orange box) to facilitate frequency estimates for segregating ERVs.
Fig. 3
Fig. 3. ERV phylogeny and heatmap.
a Phylogeny of ERVs from the genome assembly together with retrovirus- and ERV-reference sequences establish evolutionary relationships and facilitate construction of a curated ERV mapping library to match unassembled short read sequences for ERV localizations along host DNA. Full phylogenetic tree is available in Supplementary Data 2. b Frequency histogram of ERVs at loci that contain at least one ERV identification in all species. Loci that fit this criterion are assumed to pre-date Darwin’s finch speciation and are therefore expected to be fixed in all populations. Observed frequencies <1.0 of these ERVs, can be assumed to be the result of false-negative identification calls. c Heatmap showing varying ERV MIR in different, but closely related, host populations.
Fig. 4
Fig. 4. Relative abundance of common ERVs in example species.
a The 10 most frequent ERVs showed significant variation in abundance both within and between species. The relative fraction of insertions of an ERV within an individual was plotted as a data point in the box plots. Red data points are for all finch samples, and black is the subset corresponding to only the species in the labeled window. The boxplot bottom and top hinges represent 25% and 75% confidence respectively, and whiskers indicate the 95% confidence interval. Variation in relative ERV abundance among all samples (e.g., cPa260), could be attributed to either within species variation (e.g., G. fortis and G. magnirostris), between species variation (e.g., L. noctis and G. scandens), or both. b Phylogeny of the non-hybrid Darwin’s finch species with cPa260 MIR in parenthesis next to species abbreviations. Species in this phylogeny that also appear in panel a are highlighted with a border. Three of the four species enriched for cPa260 belong to the ground finch group, with the tree finch C. parvulus being the exception.
Fig. 5
Fig. 5. Contrasting ERV landscapes across finches and islands.
Relative abundance of the 10 most frequent ERVs showed variation between island populations of the same species. Modified MIR normalized ERV abundance values both vertically across ERVs and horizontally across islands. A contrasting color between island populations for a given ERV indicates a difference in relative abundance between populations, either higher (lighter color), or lower (darker color). Variation in MIR increased with small sample size (e.g., G. scandens from Daphne island), however some contrasts are more likely to represent large actual differences in ERV abundance between island populations (e.g., cPa260 in G. magnirostris).

References

    1. Johnson WE. Origins and evolutionary consequences of ancient endogenous retroviruses. Nat. Rev. Microbiol. 2019;17:355–370. doi: 10.1038/s41579-019-0189-2. - DOI - PubMed
    1. Jern P, Coffin JM. Effects of retroviruses on host genome function. Annu. Rev. Genet. 2008;42:709–732. doi: 10.1146/annurev.genet.42.110807.091501. - DOI - PubMed
    1. Grant, P. R. Ecology and evolution of Darwin’s finches. (Princeton University Press, 1986).
    1. Funk ER, Burns KJ. Biogeographic origins of Darwin’s finches (Thraupidae: Coerebinae) Auk. 2018;135:561–571. doi: 10.1642/AUK-17-215.1. - DOI
    1. Sato A, et al. On the origin of Darwin’s finches. Mol. Biol. Evol. 2001;18:299–311. doi: 10.1093/oxfordjournals.molbev.a003806. - DOI - PubMed

Publication types