

Sporozoite motility as a quantitative readout for anti-CSP antibody inhibition
- PMID: 36229488
- PMCID: PMC9561690
- DOI: 10.1038/s41598-022-22154-8
Sporozoite motility as a quantitative readout for anti-CSP antibody inhibition
Abstract
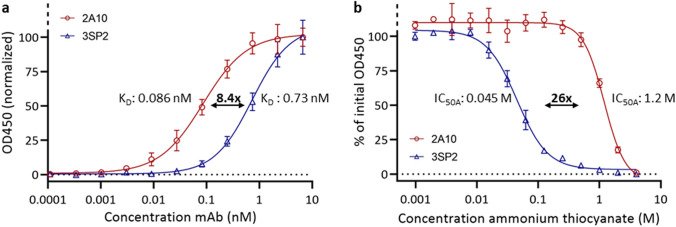
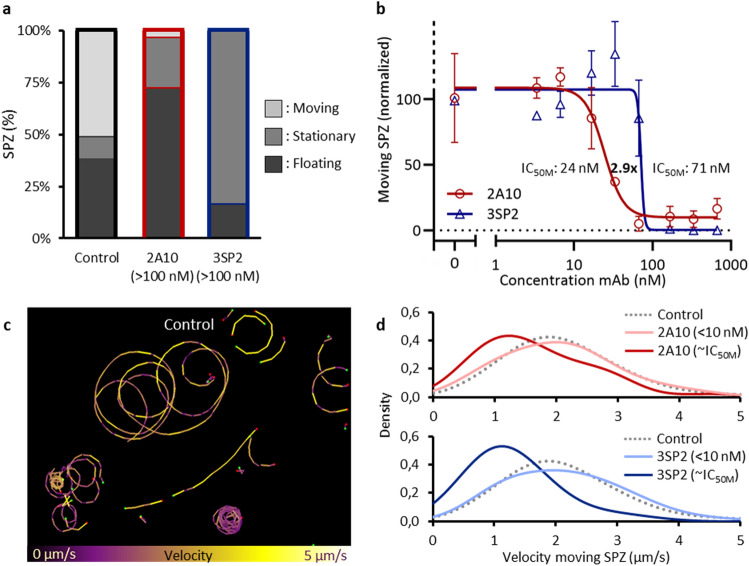
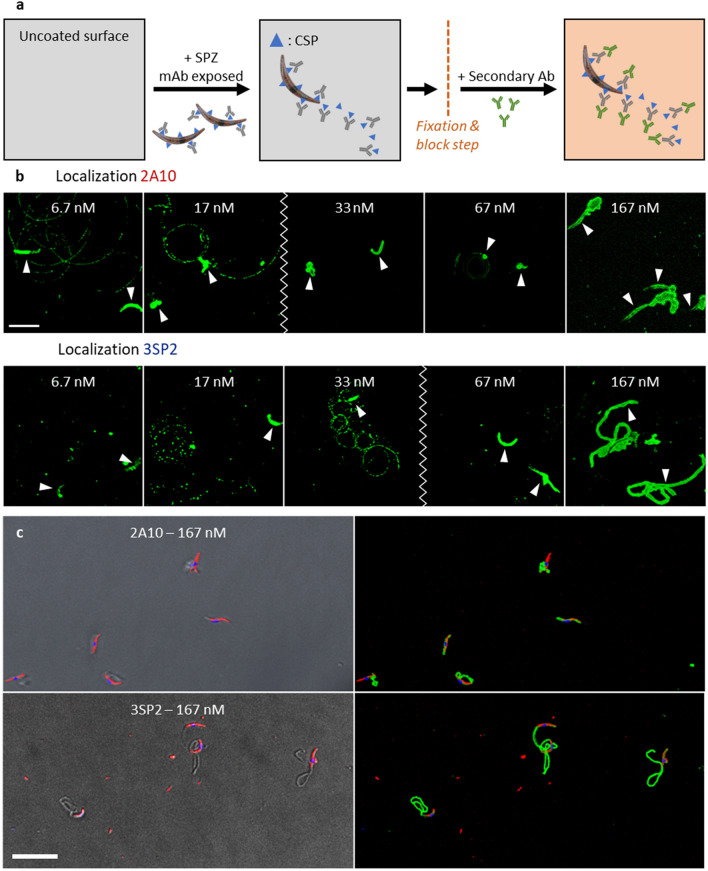
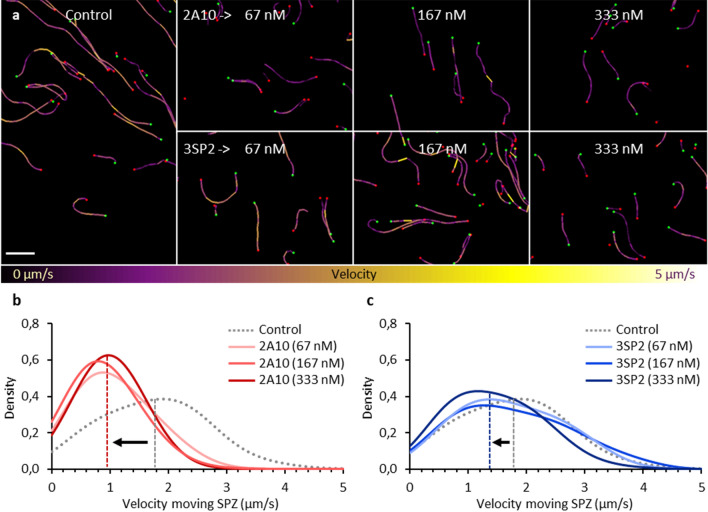
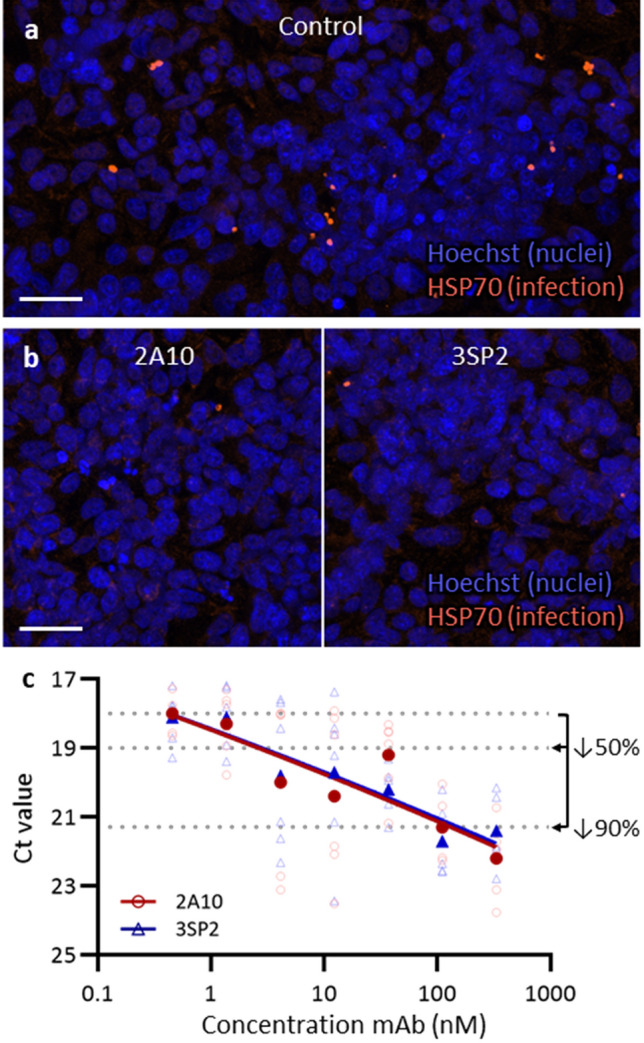
Antibodies can prevent malaria by neutralizing the infectious Plasmodium falciparum sporozoites (SPZ) before they establish an infection in the liver. Circumsporozoite protein (CSP), the most abundant surface protein of SPZ is the leading candidate for passive (and subunit) immunization approaches against malaria. Comprehensive assessment of the parasite-inhibitory capacity of anti-CSP monoclonal antibodies (mAbs) is an important step in advancing CSP-based immunization strategies. In this study, we employed a quantitative imaging-based motility assay to quantify the effect of anti-CSP mAbs on SPZ motility, both in vitro and in human skin.Our assay provided a quantitative measure of mAb parasite-inhibitory capacity through measurement of the half-maximal motility inhibitory concentration (IC50M) value for anti-CSP mAbs (IC50M 2A10: 24 nM, IC50M 3SP2: 71 nM). We found a sevenfold discrepancy between the IC50M and the binding saturation concentration measured by ELISA, possibly related to the observed shedding of CSP-mAb complexes during SPZ movement. In a subset of SPZ (5%), in vitro motility was unaffected by the presence of 2A10 while 3SP2 was able to completely block movement. In our ex vivo skin explant model, SPZ proved less susceptible to anti-CSP mAbs compared to SPZ in an in vitro environment. By quantitatively assessing motility, we created a valuable tool that can be used for comprehensive assessment of anti-CSP mAb potency. Insight that will help deepen our understanding of anti-CSP mAb potency and guide selection of the most promising anti-CSP mAbs for downstream clinical development.
© 2022. The Author(s).
Conflict of interest statement
The authors declare no competing interests.
Figures
Similar articles
-
Cytotoxic anti-circumsporozoite antibodies target malaria sporozoites in the host skin.Nat Microbiol. 2018 Nov;3(11):1224-1233. doi: 10.1038/s41564-018-0254-z. Epub 2018 Oct 22. Nat Microbiol. 2018. PMID: 30349082
-
In vitro and in vivo inhibition of malaria parasite infection by monoclonal antibodies against Plasmodium falciparum circumsporozoite protein (CSP).Sci Rep. 2021 Mar 5;11(1):5318. doi: 10.1038/s41598-021-84622-x. Sci Rep. 2021. PMID: 33674699 Free PMC article.
-
Protective effects of combining monoclonal antibodies and vaccines against the Plasmodium falciparum circumsporozoite protein.PLoS Pathog. 2021 Dec 6;17(12):e1010133. doi: 10.1371/journal.ppat.1010133. eCollection 2021 Dec. PLoS Pathog. 2021. PMID: 34871332 Free PMC article.
-
Current Challenges in the Identification of Pre-Erythrocytic Malaria Vaccine Candidate Antigens.Front Immunol. 2020 Feb 21;11:190. doi: 10.3389/fimmu.2020.00190. eCollection 2020. Front Immunol. 2020. PMID: 32153565 Free PMC article. Review.
-
Live attenuated pre-erythrocytic malaria vaccines.Hum Vaccin Immunother. 2014;10(10):2903-9. doi: 10.4161/21645515.2014.972764. Hum Vaccin Immunother. 2014. PMID: 25483648 Free PMC article. Review.
Cited by
-
Plasmodium sporozoite shows distinct motility patterns in responses to three-dimensional environments.iScience. 2024 Jul 5;27(8):110463. doi: 10.1016/j.isci.2024.110463. eCollection 2024 Aug 16. iScience. 2024. PMID: 39129829 Free PMC article.
-
Protective antibody threshold of RTS,S/AS01 malaria vaccine correlates antigen and adjuvant dose in mouse model.NPJ Vaccines. 2023 Aug 10;8(1):114. doi: 10.1038/s41541-023-00714-x. NPJ Vaccines. 2023. PMID: 37563255 Free PMC article.
-
Monoclonal antibodies to the circumsporozoite proteins as an emerging tool for malaria prevention.Nat Immunol. 2024 Sep;25(9):1530-1545. doi: 10.1038/s41590-024-01938-2. Epub 2024 Aug 28. Nat Immunol. 2024. PMID: 39198635 Review.
-
Molecular determinants of cross-reactivity and potency by VH3-33 antibodies against the Plasmodium falciparum circumsporozoite protein.Cell Rep. 2023 Nov 28;42(11):113330. doi: 10.1016/j.celrep.2023.113330. Epub 2023 Oct 28. Cell Rep. 2023. PMID: 38007690 Free PMC article.
-
Ageing of Plasmodium falciparum malaria sporozoites alters their motility, infectivity and reduces immune activation in vitro.Malar J. 2024 Apr 19;23(1):111. doi: 10.1186/s12936-024-04946-7. Malar J. 2024. PMID: 38641838 Free PMC article.
References
-
- WHO. World malaria report 2021. (2021).
MeSH terms
Substances
LinkOut - more resources
Full Text Sources
Medical
