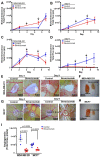
Longitudinal bioluminescence imaging to monitor breast tumor growth and treatment response using the chick chorioallantoic membrane model
- PMID: 36229503
- PMCID: PMC9562337
- DOI: 10.1038/s41598-022-20854-9
Longitudinal bioluminescence imaging to monitor breast tumor growth and treatment response using the chick chorioallantoic membrane model
Abstract
The development of successful treatment regimens for breast cancer requires strong pre-clinical data generated in physiologically relevant pre-clinical models. Here we report the development of the chick embryo chorioallantoic membrane (CAM) model to study tumor growth and angiogenesis using breast cancer cell lines. MDA-MB-231 and MCF7 tumor cell lines were engrafted onto the chick embryo CAM to study tumor growth and treatment response. Tumor growth was evaluated through bioluminescence imaging and a significant increase in tumor size and vascularization was found over a 9-day period. We then evaluated the impact of anti-angiogenic drugs, axitinib and bevacizumab, on tumor growth and angiogenesis. Drug treatment significantly reduced tumor vascularization and size. Overall, our findings demonstrate that the chick embryo CAM is a clinically relevant model to monitor therapeutic response in breast cancer and can be used as a platform for drug screening to evaluate not only gross changes in tumor burden but physiological processes such as angiogenesis.
© 2022. The Author(s).
Conflict of interest statement
The authors declare no competing interests.
Figures


Similar articles
-
Chick Chorioallantoic Membrane as an in vivo Model for the Study of Angiogenesis and Lymphangiogenesis.J Vasc Res. 2025;62(2):109-120. doi: 10.1159/000542875. Epub 2024 Dec 20. J Vasc Res. 2025. PMID: 39709947 Free PMC article. Review.
-
Bevacizumab Modulation of the Interaction Between the MCF-7 Cell Line and the Chick Embryo Chorioallantoic Membrane.In Vivo. 2017 Mar-Apr;31(2):199-203. doi: 10.21873/invivo.11045. In Vivo. 2017. PMID: 28358700 Free PMC article.
-
The chick embryo chorioallantoic membrane as an in vivo experimental model to study human neuroblastoma.J Cell Physiol. 2018 Jan;234(1):152-157. doi: 10.1002/jcp.26773. Epub 2018 Aug 5. J Cell Physiol. 2018. PMID: 30078179 Review.
-
CD44+/CD24- breast cancer cells isolated from MCF-7 cultures exhibit enhanced angiogenic properties.Clin Transl Oncol. 2013 Jan;15(1):46-54. doi: 10.1007/s12094-012-0891-2. Epub 2012 Jul 20. Clin Transl Oncol. 2013. PMID: 22855175
-
An assay for cancer stem cell-induced angiogenesis on chick chorioallantoic membrane.Cell Biol Int. 2021 Apr;45(4):749-756. doi: 10.1002/cbin.11511. Epub 2020 Dec 21. Cell Biol Int. 2021. PMID: 33274828
Cited by
-
Structural and functional effects of helix dipole moment in photoprotein Mnemiopsin 2.Sci Rep. 2025 Jul 8;15(1):24544. doi: 10.1038/s41598-025-10903-4. Sci Rep. 2025. PMID: 40628929 Free PMC article.
-
Chick Chorioallantoic Membrane as an in vivo Model for the Study of Angiogenesis and Lymphangiogenesis.J Vasc Res. 2025;62(2):109-120. doi: 10.1159/000542875. Epub 2024 Dec 20. J Vasc Res. 2025. PMID: 39709947 Free PMC article. Review.
-
Proteomics and personalized PDX models identify treatment for a progressive malignancy within an actionable timeframe.EMBO Mol Med. 2025 Apr;17(4):625-644. doi: 10.1038/s44321-025-00212-8. Epub 2025 Apr 1. EMBO Mol Med. 2025. PMID: 40204966 Free PMC article.
-
A Novel Breast Cancer Xenograft Model Using the Ostrich Chorioallantoic Membrane-A Proof of Concept.Vet Sci. 2023 May 12;10(5):349. doi: 10.3390/vetsci10050349. Vet Sci. 2023. PMID: 37235432 Free PMC article.
-
Development of an in vivo system to model breast cancer metastatic organotropism and evaluate treatment response using the chick embryo.iScience. 2023 Feb 28;26(4):106305. doi: 10.1016/j.isci.2023.106305. eCollection 2023 Apr 21. iScience. 2023. PMID: 36950119 Free PMC article.
References
Publication types
MeSH terms
Substances
Grants and funding
LinkOut - more resources
Full Text Sources
Medical
Research Materials
Miscellaneous

