. 2022 Oct 13;12(1):17147.
doi: 10.1038/s41598-022-22116-0.

Assessment of variability in the plasma 7k SomaScan proteomics assay

Affiliations

Assessment of variability in the plasma 7k SomaScan proteomics assay

Julián Candia et al. Sci Rep. .

Abstract

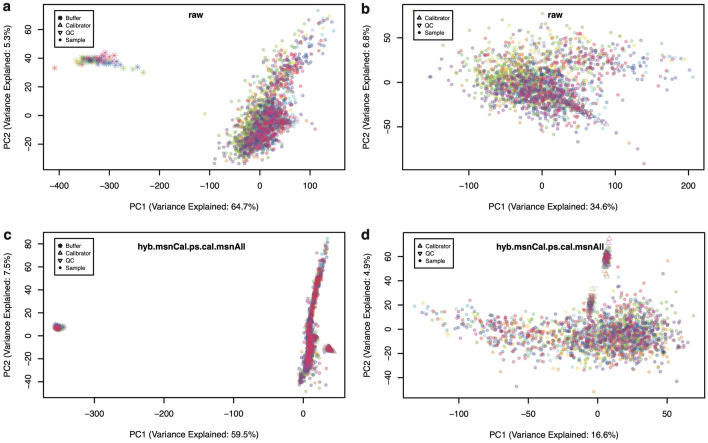
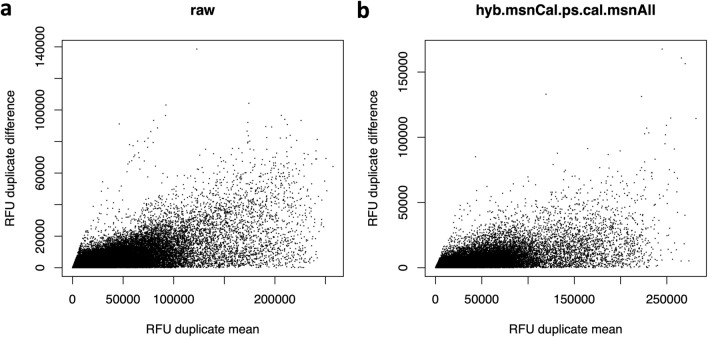
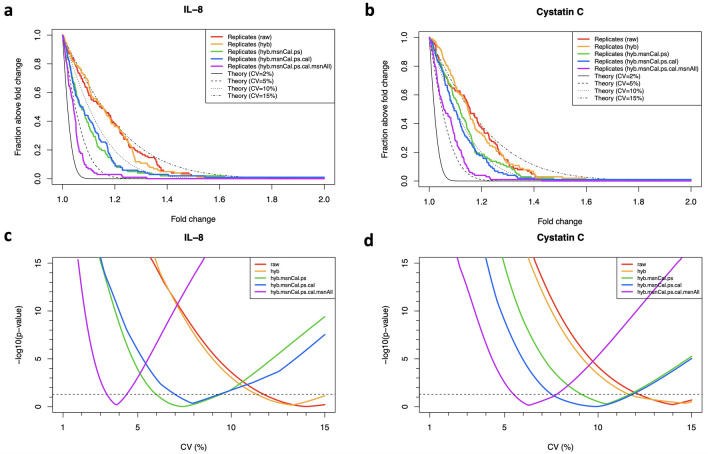
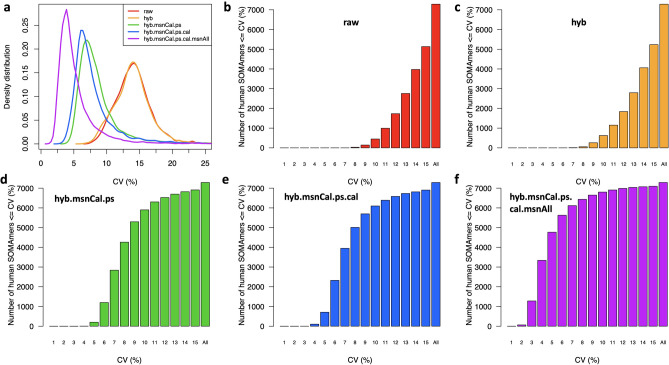
SomaScan is a high-throughput, aptamer-based proteomics assay designed for the simultaneous measurement of thousands of proteins with a broad range of endogenous concentrations. In its most current version, the 7k SomaScan assay v4.1 is capable of measuring 7288 human proteins. In this work, we present an extensive technical assessment of this platform based on a study of 2050 samples across 22 plates. Included in the study design were inter-plate technical duplicates from 102 human subjects, which allowed us to characterize different normalization procedures, evaluate assay variability by multiple analytical approaches, present signal-over-background metrics, and discuss potential specificity issues. By providing detailed performance assessments on this wide range of technical aspects, we aim for this work to serve as a valuable resource for the growing community of SomaScan users.


Conflict of interest statement

The authors declare no competing interests.

Figures

Figure 1
Figure 1
Principal component analysis (PCA) of 2,043 samples. PCA comprising 68 buffers, 110 calibrators, 66 QC and 1,799 human donor samples distributed across 22 plates. Each plate is shown in a different color. (a) Raw data with all sample types. (b) Raw data with buffer wells removed. (c) Fully normalized dataset (hyb.msnCal.ps.cal.msnAll) with all sample types. (d) Fully normalized dataset with buffer wells removed.
Figure 2
Figure 2
RFU spread increases with relative concentration. Bland-Altman plots showing the RFU difference (in absolute value) between inter-plate technical duplicates versus their corresponding mean. Each dot corresponds to the combination of one technical duplicate pair and one human protein SOMAmer, for a total of 102 duplicate pairs × 7288 SOMAmers. (a) Raw data. (b) Fully normalized dataset (hyb.msnCal.ps.cal.msnAll).
Figure 3
Figure 3
Assessment of SOMAmer variability. Density distributions representing different variability measurements across 7288 human protein SOMAmers, obtained from inter-plate technical duplicates from 102 human participants. Each panel shows five distributions corresponding to different normalizations, as indicated. (a) Root-Mean-Squared Variation (RMSV). (b) Mean Absolute Difference Variation (MADV). (c) Percentile Variation (PV).
Figure 4
Figure 4
Grid-search procedure to determine the coefficient of variation (CV) from inter-plate technical duplicates. The method is here illustrated with IL-8 (a,c) and Cystatin C (b,d). (a,b) Probability that two replicate measurements differ by a factor larger than a given fold change. Theoretical estimates assuming different CVs [based on Eq. (5)] are compared to technical duplicates obtained from 102 human subjects using different normalizations, as indicated. (c,d) -log10(p-value) from Kolmogorov-Smirnov tests comparing theoretical and measured distributions as a function of the assumed CV. The minimum in each curve indicates the CV that yields the theoretical distribution most similar to the measured one. Horizontal dashed lines correspond to p-value=0.05.
Figure 5
Figure 5
Distributions of coefficients of variation (CV). (a) Density distributions of CV across 7288 human protein SOMAmers, obtained from inter-plate technical duplicates from 102 human subjects for different normalizations. (b–f) Cumulative distribution of the number of SOMAmers below a given CV for different normalizations.
Figure 6
Figure 6
Brightness and variability of SOMAmers by dilution group. Coefficient of variation of 7288 human protein SOMAmers as a function of the median signal-to-background ratio across experimental samples. SOMAmers are colored based on dilution: 20% (n=6001), 0.5% (n=1100), and 0.005% (n=187). Data have been fully normalized.
Figure 7
Figure 7
Signal-to-background assessment of control SOMAmers. Intensity (measured in Relative Fluorescence Units) for different types of control SOMAmer, as indicated. The median (solid line) and 95% CI (shaded area) are shown for buffer wells (black) and experimental samples (blue). The estimated Limit of Detection derived from Eq. (6) is shown as a solid red line. Control SOMAmers within each type are shown in decreasing order of median RFU intensity in buffer wells. Data have been fully normalized.

References

    1. Gold L, et al. Aptamer-based multiplexed proteomic technology for biomarker discovery. PLoS ONE. 2010;5:e15004. doi: 10.1371/journal.pone.0015004. - DOI - PMC - PubMed
    1. Schneider, D. J. et al. Chapter 8 - Somamer reagents and the somascan platform: Chemically modified aptamers and their applications in therapeutics, diagnostics, and proteomics. In Giangrande, P. H., de Franciscis, V. & Rossi, J. J. (eds.) RNA Therapeutics, 171–260 (Academic Press, 2022).
    1. Rohloff JC, et al. Nucleic acid ligands with protein-like side chains: Modified aptamers and their use as diagnostic and therapeutic agents. Mol. Therapy Nucl. Acids. 2014;3:e201. doi: 10.1038/mtna.2014.49. - DOI - PMC - PubMed
    1. Emilsson V, et al. Co-regulatory networks of human serum proteins link genetics to disease. Science. 2018;361:769–773. doi: 10.1126/science.aaq1327. - DOI - PMC - PubMed
    1. Sun B, et al. Genomic atlas of the human plasma proteome. Nature. 2018;558:73. doi: 10.1038/s41586-018-0175-2. - DOI - PMC - PubMed

Publication types