

A comparative analysis of SARS-CoV-2 viral load across different altitudes
- PMID: 36229507
- PMCID: PMC9558017
- DOI: 10.1038/s41598-022-20516-w
A comparative analysis of SARS-CoV-2 viral load across different altitudes
Abstract
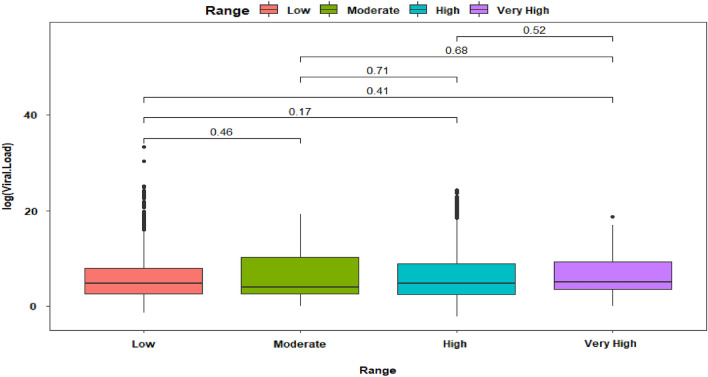
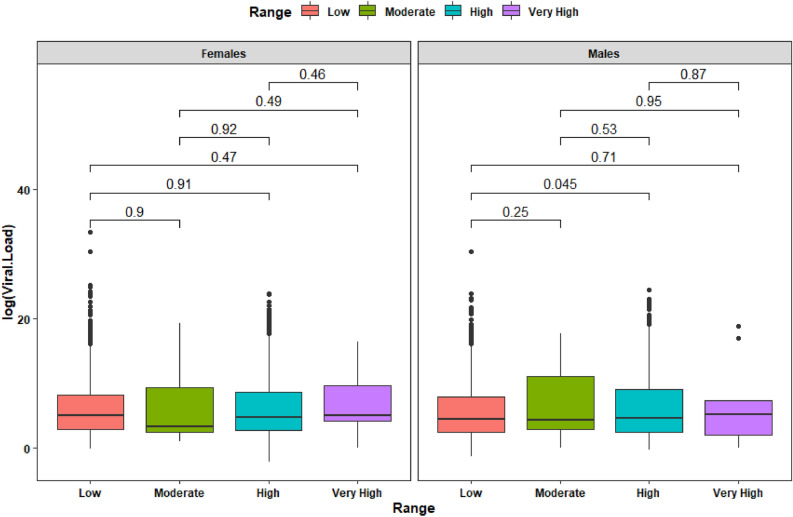
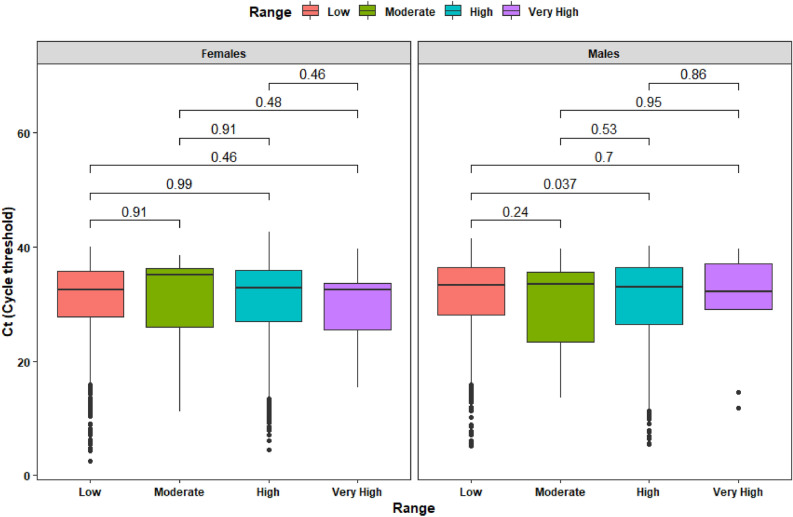
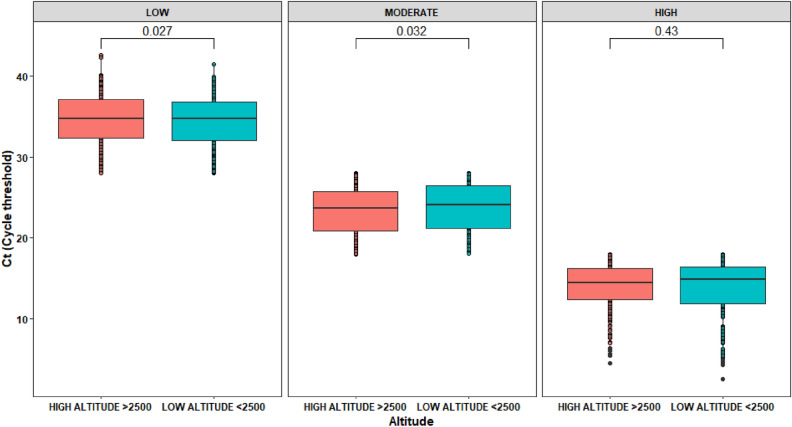
SARS-CoV-2 has spread throughout the world, including areas located at high or very high altitudes. There is a debate about the role of high altitude hypoxia on viral transmission, incidence, and COVID-19 related mortality. This is the first comparison of SARS-CoV-2 viral load across elevations ranging from 0 to 4300 m. To describe the SARS-CoV-2 viral load across samples coming from 62 cities located at low, moderate, high, and very high altitudes in Ecuador. An observational analysis of viral loads among nasopharyngeal swap samples coming from a cohort of 4929 patients with a RT-qPCR test positive for SARS-CoV-2. The relationship between high and low altitude only considering our sample of 4929 persons is equal in both cases and not significative (p-value 0.19). In the case of low altitude, adding the sex variable to the analysis, it was possible to find a significative difference between men and women (p-value < 0.05). Considering initially sex and then altitude, it was possible to find a significative difference between high and low altitude for men (p-value 0.05). There is not enough evidence to state that viral load is affected directly by altitude range but adding a new variable as sex in the analysis shows that the presence of new variables influences the relationship of altitude range and viral load. There is no evidence that viral loads (Ct and copies/ml) differ at low or high altitude. Using sex as a co-factor, we found that men have higher viral loads than women at low and moderate altitude locations, while living at high altitude, no differences were found. When Ct values were aggregated by low, moderate, and high viral load, we found no significant differences when sex was excluded from the analysis. We conclude that viral load is not directly affected by altitude, but COVID-19 incidence and mortality are rather affected by socio-demographic and idiosyncratic dynamics.
© 2022. The Author(s).
Conflict of interest statement
The authors declare no competing interests.
Figures


References
-
- Ortiz-Prado E, Simbaña-Rivera K, Gómez-Barreno L, Rubio-Neira M, Guaman LP, Kyriakidis NC, et al. Clinical, molecular and epidemiological characterization of the SARS-CoV2 virus and the Coronavirus disease 2019 (COVID-19), a comprehensive literature review. Diagn. Microbiol. Infect. Dis. 2020;98:115094. doi: 10.1016/j.diagmicrobio.2020.115094. - DOI - PMC - PubMed
-
- Worldometer. Ecuador Data, Population (2021) and Distribution [Internet]. 2021 [cited 2021 May 17]. Available from: https://www.worldometers.info/world-population/ecuador-population/.
-
- Fernandez-Naranjo, R. P., Vasconez, E., Simbaña-Rivera, K., Lister, A., Landazuri, S., Ortiz-Prado, E. The world’s deadliest outbreak during the COVID-19 pandemic: A proposed analytical approach to estimate excess mortality in Ecuador during the first year of the pandemic. Preprint at Res Sq. Under Review (2021).
Publication types
MeSH terms
LinkOut - more resources
Full Text Sources
Medical
Miscellaneous
