. 2022 Nov;36(11):2605-2620.
doi: 10.1038/s41375-022-01708-9. Epub 2022 Oct 14.

DDX41 coordinates RNA splicing and transcriptional elongation to prevent DNA replication stress in hematopoietic cells

Affiliations

DDX41 coordinates RNA splicing and transcriptional elongation to prevent DNA replication stress in hematopoietic cells

Satoru Shinriki et al. Leukemia. 2022 Nov.

Abstract

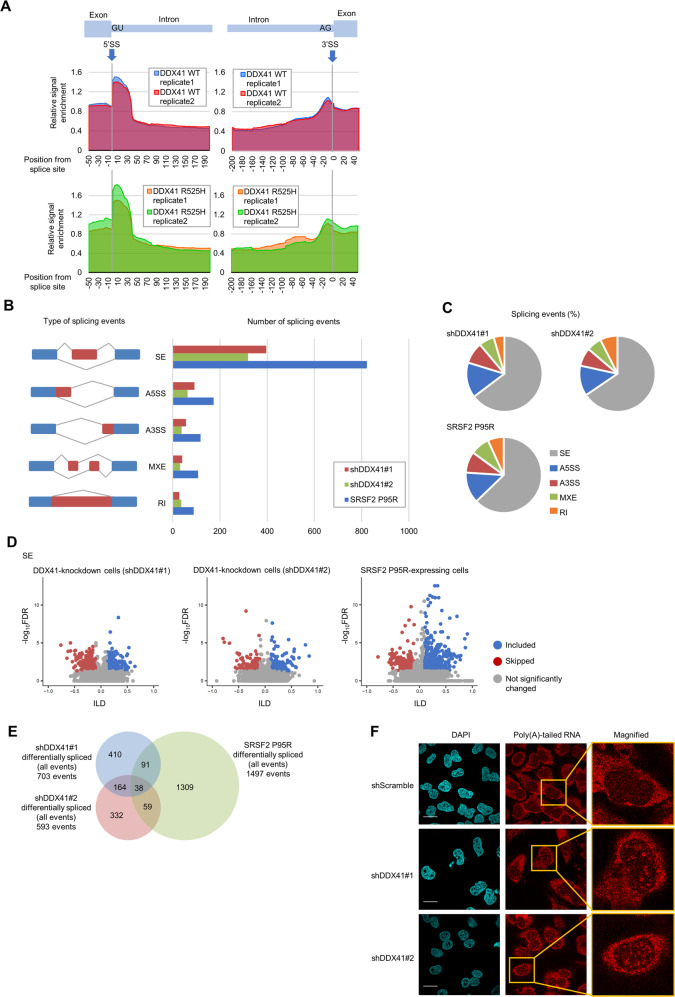
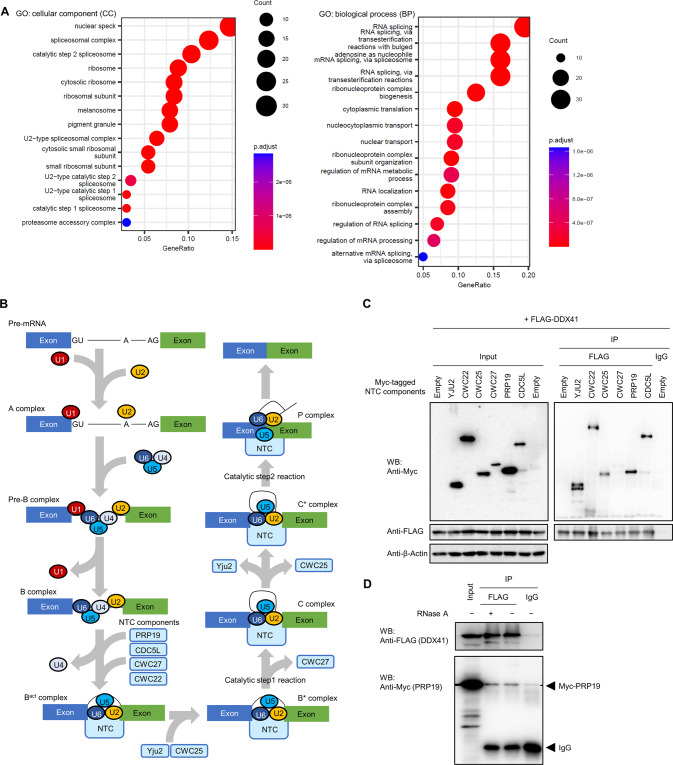
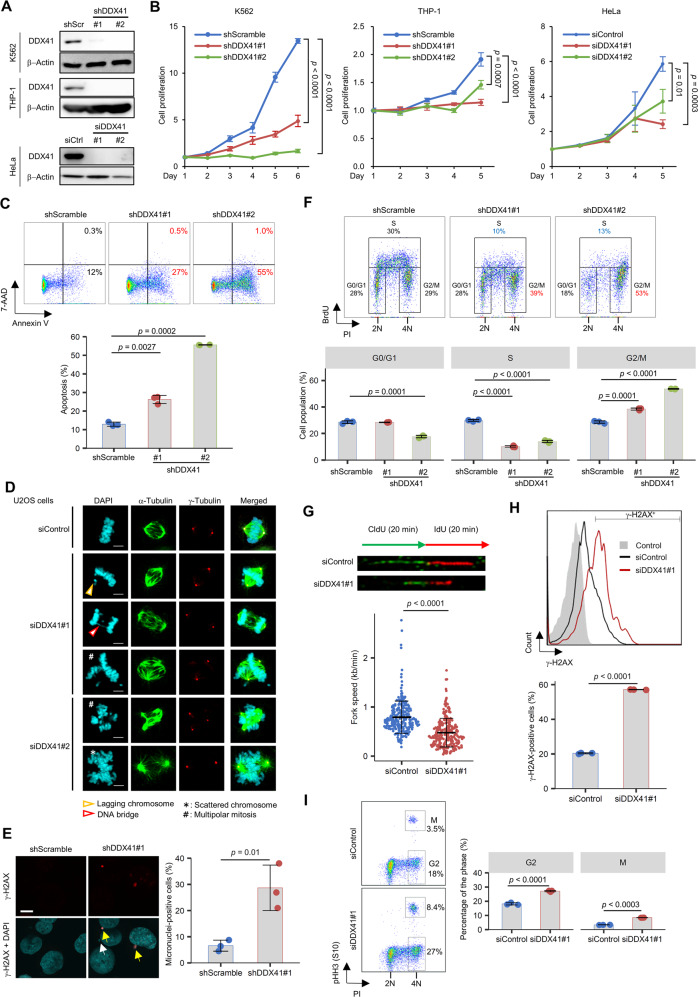
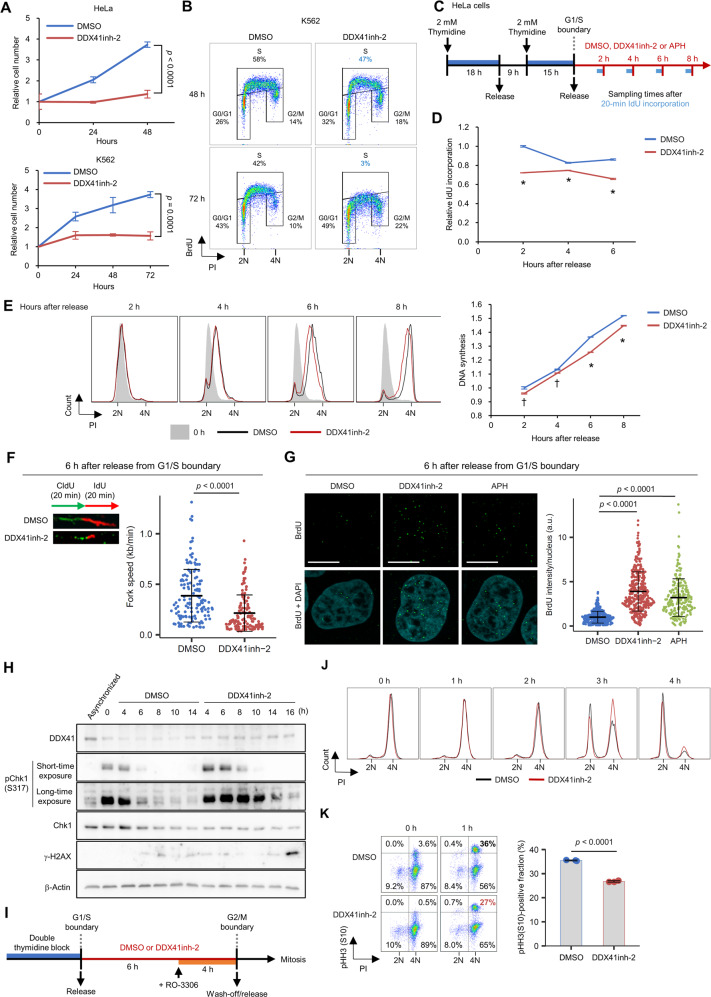
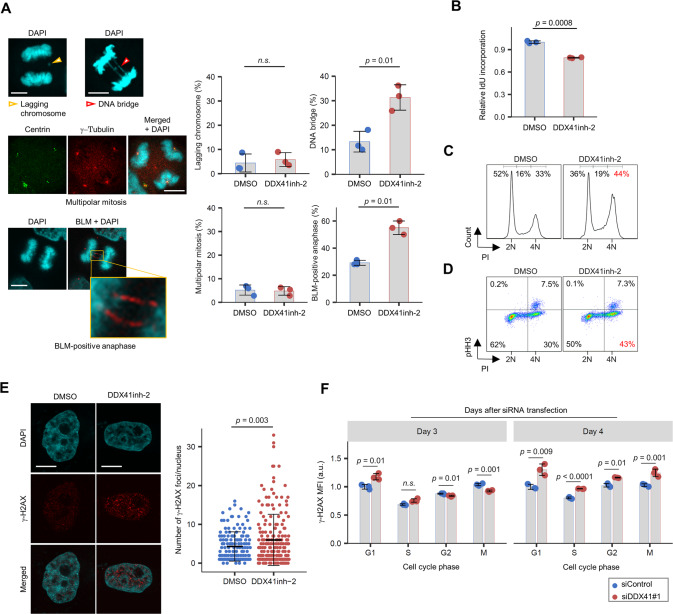
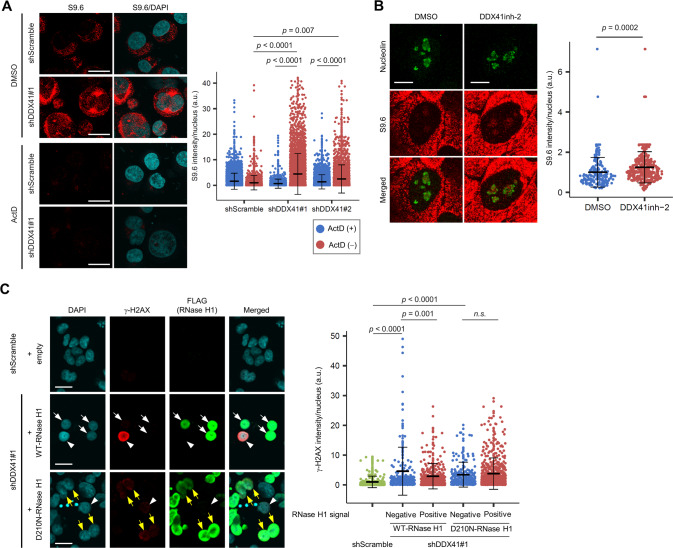
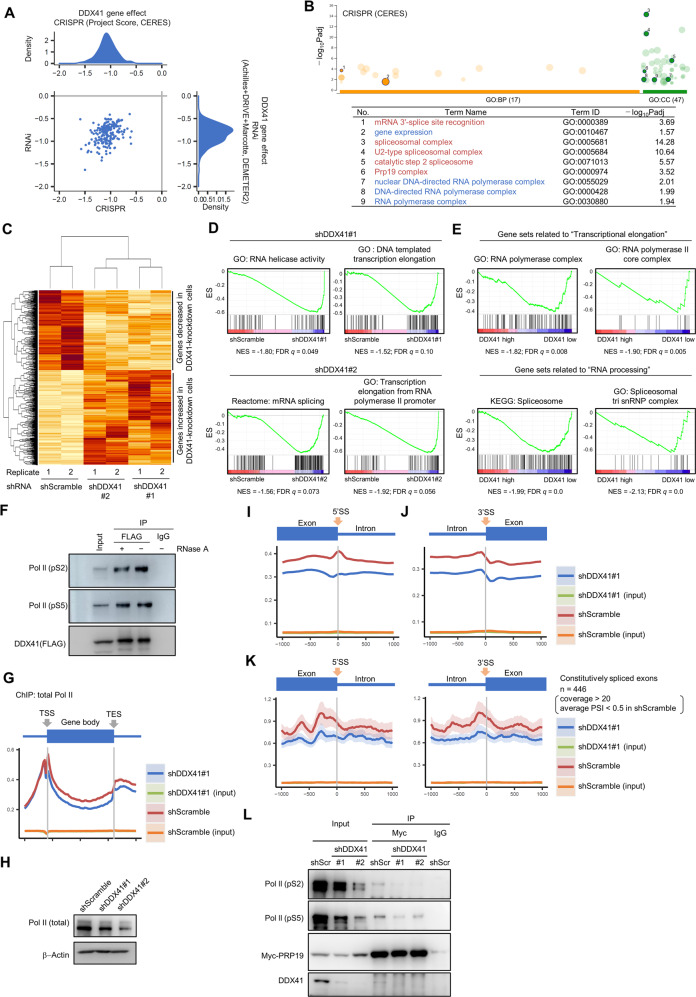
Myeloid malignancies with DDX41 mutations are often associated with bone marrow failure and cytopenia before overt disease manifestation. However, the mechanisms underlying these specific conditions remain elusive. Here, we demonstrate that loss of DDX41 function impairs efficient RNA splicing, resulting in DNA replication stress with excess R-loop formation. Mechanistically, DDX41 binds to the 5' splice site (5'SS) of coding RNA and coordinates RNA splicing and transcriptional elongation; loss of DDX41 prevents splicing-coupled transient pausing of RNA polymerase II at 5'SS, causing aberrant R-loop formation and transcription-replication collisions. Although the degree of DNA replication stress acquired in S phase is small, cells undergo mitosis with under-replicated DNA being remained, resulting in micronuclei formation and significant DNA damage, thus leading to impaired cell proliferation and genomic instability. These processes may be responsible for disease phenotypes associated with DDX41 mutations.


Conflict of interest statement

The authors declare no competing interests.

Figures

Fig. 1
Fig. 1. DDX41 is involved in RNA splicing by binding to 5’SS but does not play a major role in SS recognition.
A Relative CLIP-seq signals at 5ʹSS and 3ʹSS on coding RNA. Vertical axis: ratio of CLIP sample signal divided by that of input RNA from same cells. Blue and red lines in top panels indicate relative signal enrichment of CLIP reads from cells expressing Myc-tagged WT DDX41; green and orange lines in bottom panels indicate reads from cells expressing Myc-tagged R525H mutant DDX41. B Quantification of RNA splicing changes in K562 cells expressing shDDX41#1, shDDX41#2, or SRSF2 P95R. We placed splicing events into groups according to rMATS: (1) skipped exon (SE), (2) alternative 5ʹSS (A5SS), (3) alternative 3ʹSS (A3SS), (4) mutually exclusive exons (MXE), and (5) retained intron (RI). Cumulative number of events in each cell group with an inclusion level difference (ILD) > 0.1 or <−0.1 and a false discovery rate (FDR) <0.05 are shown. C Distribution of RNA splicing events in K562 cells expressing shDDX41#1, shDDX41#2, or SRSF2 P95R compared with control K562 cells. Splicing events were categorized as in B. D Changes in RNA splicing events for SE in DDX41-knockdown cells and SRSF2 P95R-expressing cells. We included splicing events with 10% minimum change of absolute percent spliced-in index (PSI, which indicates rate of incorporation of specific exon into transcript of a gene) (delta PSI ≥ 0.1) and average reads ≥5; those with FDR < 0.05 with ILD < 0.1 or >0.1 in each group were considered significant and plotted with red or blue dots, respectively. Gray dots are not significant. E Overlap of RNA splicing events among DDX41-knockdown cells and SRSF2 P95R-expressing cells. All significant RNA splicing events (SE, MXE, RI, A5SS, and A3SS) in each cell type were summed, and event overlap among DDX41-knockdown cells and SRSF2 P95R-expressing cells is shown. F Subcellular distribution of poly(A)-tailed RNA in DDX41-knockdown cells. Scale bars: 20 μm.
Fig. 2
Fig. 2. Interaction of DDX41 with RNA splicing-related proteins.
A Major GOs of proteins interacted with FLAG-DDX41. Nuclear proteins immunoprecipitated with FLAG-DDX41 were categorized via GO analysis. Top 15 GO terms for CC (cellular component) and BP (biological process) categories are shown, with the number of genes indicated by circle sizes and adjusted p values indicated by red to blue colors. B Schematic diagram showing NTC involvement in RNA splicing. The factors within NTC are incorporated into or excluded from the complex depending on the splicing steps, in which core NTC components (PRP19 and CDC5L) occur throughout NTC after incorporation of the complex into the spliceosome; CWC25 and Yju2 are incorporated before the B* complex and excluded before the C* complex, and CWC27 is excluded before the C complex. C Interaction of DDX41 with RNA splicing process-specific components in the NTC. Myc-tagged NTC components (Yju2, CWC22, CWC25, CWC27, PRP19, and CDC5L) were expressed with FLAG-tagged DDX41 in HEK293FT cells, and DDX41-interacting proteins were immunoprecipitated with an anti-FLAG antibody. Precipitated proteins were probed with anti-FLAG, anti-Myc, or anti-β-Actin antibody. Left and right panels indicate input and immunoprecipitated samples, respectively. D Non-RNA-mediated interaction of DDX41 with PRP19. FLAG-tagged DDX41 and Myc-tagged PRP19 were expressed in HEK293FT cells, and FLAG-DDX41 was immunoprecipitated with anti-FLAG antibody. Precipitated samples were then treated with 20 μg/ml RNase A for 30 min at 37 °C before being probed with anti-FLAG or anti-Myc antibody.
Fig. 3
Fig. 3. DDX41-knockdown induces impaired DNA replication and abnormal mitosis.
A Inhibition of DDX41 expression by siRNA/shRNA against DDX41. shScr, shScramble; siCtrl, siControl. B Suppression of cell growth by DDX41 knockdown. Cells were transfected with the indicated shRNAs (K562 and THP-1 cells) or siRNAs (HeLa cells). Day 1 means day 4 after lentivirus infection (K562 and THP-1 cells; n = 4) or the day of siRNA transfection (HeLa cells; n = 3). Values are means ± SD; two-tailed unpaired Student’s t test. C Induction of apoptosis by DDX41 knockdown. (Upper) Representative images of flow cytometric analysis of K562 cell apoptosis. (Lower) Bars indicate means; error bars, SDs of triplicate samples; two-tailed Welch’s t test. D Abnormal mitosis after DDX41 knockdown in U2OS cells. Scale bars: 5 μm. E Micronucleus formation by DDX41 knockdown in K562 cells. Percent micronucleus-positive cells in shScramble (n = 176, 194 and 233 cells) and shDDX41#1 (n = 84, 100 and 115 cells) groups were analyzed 3 days after lentivirus infection. (Left) Yellow and white arrows indicate micronuclei positive and negative for γ-H2AX, respectively. Scale bar: 10 μm. (Right) Bars indicate means; error bars, SD of triplicate samples; two-tailed unpaired Student’s t test. F Inhibition of DNA replication by DDX41 knockdown in K562 cells. (Upper) Representative images of flow cytometric analysis of BrdU incorporation. (Lower) Bars indicate means; error bars, SD of triplicate samples; two-tailed Welch’s t test. G Slowed replication fork progression by DDX41 knockdown in HeLa cells. (Upper) Dual labeling with DNA analogs and representative images of DNA fibers. Thymidine analogues were visualized via immunofluorescence (CldU, green; IdU, red). (Lower) Fork progression speed calculated for each sample. Bars indicate means ± SD; n = 269 and 271 for siControl and siDDX41#1, respectively; two-tailed Welch’s t test. H Induction of γ-H2AX signals by DDX41 knockdown in HeLa cells. Three days after siRNA transfection, flow cytometry analysis was performed. (Upper) Histogram of γ-H2AX levels. (Lower) Percent γ-H2AX-positive cells in each cell group. Bars indicate means; error bars, SD of triplicate samples; two-tailed Welch’s t test. I Cell cycle changes by DDX41 knockdown in HeLa cells. Three days after siRNA transfection, flow cytometry analysis was performed. (Left) Representative flow cytometry plots of cells stained with anti-phosphorylated histone H3 (pHH3) antibody and Propidium Iodide (PI). (Right) Percent cells at G2 and M phases. Bars indicate means; error bars, SD of triplicate samples; two-tailed Welch’s t test.
Fig. 4
Fig. 4. DDX41 inhibition induces mild DNA replication stress in S phase.
A Suppression of HeLa and K562 cell proliferation by DDX41 inhibition (50 μM DDX41inh-2 treatment). Cell number was counted by using trypan blue. Values are means ± SD of triplicate samples; two-tailed unpaired Student’s t test. B Reduced BrdU incorporation by 50 μM DDX41inh-2 treatment in HeLa cells. C Schematic diagram of cell cycle synchronization, drug treatment, and IdU incorporation in HeLa cells. D Reduced IdU incorporation in S phase by 50 μM DDX41inh-2 treatment in HeLa cells. *p < 0.0001, two-tailed unpaired Student’s t test. Results of the 8-h treatment are not shown because S-G2 transition occurred (see Supplementary Fig. S4B). E Delayed S-phase progression in HeLa cells by 50 μM DDX41inh-2 treatment. (Left) Representative histograms. (Right) DNA synthesis rate as estimated by median fluorescence intensity (MFI) of PI. Values are means ± SD of triplicate samples; *p < 0.0001; p < 0.005, two-tailed unpaired Student’s t test. F Slowed replication fork progression by DDX41 inhibition. (Left) Experimental scheme of dual labeling with DNA analogs and representative images of DNA fibers. Thymidine analogues were visualized via immunofluorescence (CldU, green; IdU, red). (Right) Fork progression speed was calculated for each sample. Bars represent means ± SD; n = 139 and 134 for DMSO and DDX41inh-2 group, respectively; two-tailed Welch’s t test. G Increase in single-stranded DNA by treatment with 50 μM DDX41inh-2 or 10 nM APH. Scale bars: 10 μm. Bars represent means ± SD; n = 400, 380 and 222 nuclei for DMSO, DDX41inh-2, and APH, respectively; two-tailed Welch’s t test. H Increase in DNA damage-related signals by DDX41 inhibition in HeLa cells. Protein extracts obtained from cell cycle-synchronized HeLa cells were probed with antibodies indicated at left. The time indicated are the hours after release from G1/S arrest. I Schematic diagram of mitosis assessment in HeLa cells after 50 μM DDX41inh-2 treatment during S phase. RO-3306, a CDK1 inhibitor, was used to induce G2 arrest. J, K Delayed mitosis in HeLa cells after DDX41 inhibition in S phase. HeLa cells were treated as indicated in I. Flow cytometry analysis of cell cycle change (J) and proportion of cells at M phase (K). Cells at G2 or M were determined as those negative or positive for pHH3 with PI signal corresponding to 4N, respectively. Right panel in K indicates proportion of pHH3-positive M phase cells 1 h after RO-3306 removal. Bars indicate means, error bars indicate SD of triplicate samples; two-tailed Welch’s t test.
Fig. 5
Fig. 5. Mild replication stress by DDX41 inhibition triggers mitotic abnormalities and affects cell cycle progression of daughter cells.
A Increased DNA bridges and ultrafine DNA bridges in mitotic HeLa cells treated with DDX41inh-2 during S phase. See Supplementary Fig. S5A for schematic. (Left) Representative images of abnormal mitosis. (Right) Quantitative result of abnormal mitosis. Bars indicate means; error bars, SD of triplicate samples; two-tailed Welch’s t test. n.s., not significant. Scale bars: 10 μm. B Reduced IdU incorporation in cells that had been treated with DDX41inh-2 in S phase and had undergone mitosis. See Supplementary Fig. S5A for schematic. Bars indicate means; error bars, SD of triplicate samples; two-tailed Welch’s t test. C, D Cell cycle arrest at G2 phase in HeLa cells that had been treated with DDX41inh-2 in S phase and had undergone mitosis. Cells were treated as in Fig. 4I. Cell cycle status 18 h after removal of DDX41inh-2 and RO-3306 was identified by PI staining (C). Cells were double-stained with PI and anti-pHH3 antibody to distinguish mitotic cells from cells at G2 (D). E Increase in γ-H2AX foci in G1 HeLa cells that had been treated with DDX41inh-2 in S phase and had undergone mitosis. Cells were stained with anti-γ-H2AX antibody and DAPI. See Supplementary Fig. S5B for schematic. Bars represent means ± SD; n = 151 and 195 for DMSO and DDX41inh-2, respectively; two-tailed Welch’s t test. Scale bars: 10 μm. F Increase in γ-H2AX signals primarily occurred at G1 in HeLa cells after DDX41 knockdown. Cells were stained with anti-γ-H2AX and anti-pHH3 antibodies and PI. MFI of γ-H2AX in each cell cycle phase was analyzed with flow cytometry. Bars indicate means; error bars, SD of triplicate samples; two-tailed Student’s t test.
Fig. 6
Fig. 6. Loss of expression or function of DDX41 induces R-loop accumulation.
A Increase in nuclear S9.6 signals by DDX41 knockdown. K562 cells infected with lentivirus expressing shDDX41#1, shDDX41#2, or shScramble were treated with ActD or DMSO for 6 h. Cells were stained with S9.6 antibody and DAPI. (Left) Representative immunofluorescence images. Scale bars: 20 μm. (Right) Nuclear S9.6 signal intensity. Bars represent means ± SD; n = 2645, 1628, 1490, 2357, 2095 and 2401 nuclei for shScramble/ActD+, shScramble/ActD, shDDX41#1/ActD+, shDDX41#1/ActD, shDDX41#2/ActD+, and shDDX41#2/ActD, respectively; two-tailed Welch’s t test. B Increase in nuclear S9.6 signals in S phase by DDX41 inhibition. HeLa cells were treated with 50 μM DDX41inh-2 or DMSO as in Fig. 4C. Six hours after release from the G1/S boundary, cells were stained with S9.6 antibody and DAPI. S9.6 signals from nucleoli were subtracted, and signals in nucleoplasm were quantitatively measured. (Left) Representative immunofluorescence images. Scale bars: 10 μm. (Right) Nuclear S9.6 signal intensity. Bars represent means ± SD; n = 187 and 407 for DMSO and DDX41inh-2, respectively; two-tailed Welch’s t test. C Reduced γ-H2AX signals by enforced expression of RNase H1 in DDX41-knockdown cells. K562 cells were infected with lentivirus expressing shDDX41#1, shDDX41#2, or shScramble. Five days later, cells were transfected with FLAG-tagged nuclear-localizing RNase H1-expressing vector or an empty vector; 2 days later, cells were stained with anti-γ-H2AX and anti-FLAG antibodies and DAPI. (Left) Representative immunofluorescence images. White arrowheads, white arrows, and yellow arrows indicate γ-H2AX+/RNase H1 cells, WT-RNase H1+ cells, and γ-H2AX+/D210N-RNase H1+ cells, respectively. Scale bars: 20 μm. (Right) γ-H2AX signal intensity for cells negative and positive for RNase H1 signal. Bars represent means ± SD; n = 394, 214, 342, 232 and 612 for shScramble, shDDX41#1/WT-RNase H1, shDDX41#1/RNase H1+, shDDX41#1/D210N-RNase H1, and shDDX41#1/D210N-RNase H1+, respectively; two-tailed Welch’s t test.
Fig. 7
Fig. 7. Changes in gene expression and distribution of Pol II by DDX41 knockdown.
A Dependence of cell lines on DDX41. We used DepMap portal (https://depmap.org/portal/). For density distributions for CRISPR and RNAi data, smaller scores indicate that DDX41 is essential for cell line survival; −1 was comparable to the median of all pan-essential genes. B Genes co-dependent with DDX41 include those related to RNA splicing and Pol II-mediated transcription. Top co-dependent genes with DDX41 (with q values <0.05) identified in CRIPR screening were subjected to GO analysis; results were visualized via g:Profiler (upper). Representative GO terms related to RNA splicing (red) and Pol II-mediated transcription (blue) were numbered (lower). Table S1 gives the complete list. C Gene expression changes by DDX41 knockdown. A hierarchical clustering of 1341 genes that showed expression changes with p < 0.05 in common in shDDX41#1- and shDDX41#2-expressing DDX41-knockdown cells compared with shScramble-expressing control cells was visualized. D Representative gene sets associated with RNA splicing and transcriptional elongation negatively enriched in shDDX41#1- and shDDX41#2-expressing cells. ES, enrichment score; NES, nominal enrichment score. E Representative gene sets associated with transcriptional elongation and RNA processing negatively enriched in DDX41 low-expressing AML cases. The 451 AML cases presented in the article by Tyner et al. [48] were divided into three groups according to the expression level of DDX41, and the transcriptome differences between groups with DDX41 expression levels below mean −SD (DDX41 low) and above mean +SD (DDX41 high) were examined. F Direct interaction of DDX41 with Pol II in HEK293FT cells. Protein extracts from cells expressing FLAG-DDX41 were immunoprecipitated with anti-FLAG antibody or control IgG and then probed with anti-FLAG and anti-Pol II (pS2 and pS5) antibodies. G Average distribution of total Pol II from transcription start site (TSS) to transcription end site (TES) of all RefSeq transcripts visualized with Ngsplot. H Changes in Pol II expression in DDX41-knockdown HEK293FT cells. I, J Average distribution of Pol II around exon/intron boundaries. Distribution of Pol II around 5′SS (I) and 3′SS (J) of genes expressing above the median in control cells are shown. K Average distribution of Pol II around exon/intron boundaries of constitutively spliced exons. Exons that met requirements of coverage >20 and average PSI < 0.5 were selected, and average distributions of Pol II up to 1000 bases upstream and downstream of the 5′SS (left panel) and 3′SS (right panel) of exons were visualized with Ngsplot. L Reduced interaction of PRP19 with pS2- and pS5-modified Pol II. Protein extracts from DDX41-knockdown HEK293FT expressing Myc-tagged PRP19 were immunoprecipitated with anti-Myc antibody or control IgG. The samples were probed with anti-Pol II (pS2 and pS5), anti-Myc and anti-DDX41 antibodies.
Fig. 8
Fig. 8. R-loop accumulation and DNA damage by introduction of R525H mutation in primary hematopoietic progenitor cells in mice.
A Reduced proliferation of immature bone marrow cells expressing R525H mutation. Lin/c-Kit+ bone marrow cells isolated from 9-week-old Ddx41R525H/WT or Ddx41WT/WT mice were cultured ex vivo in the presence of 25 ng/ml human thrombopoietin (TPO), 50 ng/ml mouse stem cell factor (SCF), 50 ng/ml mouse FLT3-L, and 25 mg/ml mouse interleukin-6 (IL-6) for 72 h, and then 4-OHT at 200 nM (final concentration) was added to culture medium for 48 h. Relative cell numbers compared with control cell numbers cultured in the presence or absence of 4-OHT are shown. B, C Increased R-loop formation and DNA damage in immature bone marrow cells expressing Ddx41 R525H mutation. Cells cultured as in A were stained with S9.6 and anti-phospho-RPA32 (S4/S8) antibodies (B) or anti-γ-H2AX antibody (C) with nuclear DAPI counterstaining. Scale bars: 10 μm. (Right) Quantitative signal levels. n = 246, 217, 226 and 128 (B), and 238, 151, 190, and 290 (C) for WT/WT/4-OHT, WT/WT/4-OHT+, R525H/WT/4-OHT, and R525H/WT/4-OHT+, respectively; two-tailed Welch’s t test. D Micronucleus formation in immature bone marrow cells expressing Ddx41 R525H mutation. Cells cultured as in A were stained with DAPI and anti-γ-H2AX antibody. (Left) Representative images of Ddx41R525H/WT cell with γ-H2AX-positive micronucleus (arrowhead). Scale bar: 10 μm. (Right) Percent micronuclei-positive cells. Chi-square analysis. E Morphology of hematopoietic progenitor cells cultured ex vivo. Cells cultured as in A were stained with Giemsa and observed with light microscopy at ×400. Red arrows indicate cells with severely abnormal nuclear morphology. Scale bars: 50 μm. F Schematic illustration of how DDX41 deficiency causes impaired hematopoiesis and leukemogenesis. (a) Normal condition: DDX41, together with NTC, coordinates RNA splicing and transcriptional elongation. The Pol II complex transiently slows at 5ʹSS by interacting with DDX41, where it waits until the intron is spliced. (b) DDX41 deficiency: Pol II complex ignores unfinished RNA splicing and does not slow at 5ʹSS, which leads to increased opportunities for R-loop formation and transcription-replication conflicts. This results in increased under-replicated DNA at end of replication and DNA bridge formation during mitosis that result in genomic instability.

References

    1. Churpek JE, Smith-Simmer K. DDX41-Associated Familial Myelodysplastic Syndrome and Acute Myeloid Leukemia. In: Adam MP, Ardinger HH, Pagon RA, Wallace SE, Bean LJH, Gripp KW, et al. editors. University of Washington, Seattle: GeneReviews; 2021. - PubMed
    1. Li P, White T, Xie W, Cui W, Peker D, Zeng G, et al. AML with germline DDX41 variants is a clinicopathologically distinct entity with an indolent clinical course and favorable outcome. Leukemia. 2021;36:664–74. - PubMed
    1. Sébert M, Passet M, Raimbault A, Rahmé R, Raffoux E, Sicre de Fontbrune F, et al. Germline DDX41 mutations define a significant entity within adult MDS/AML patients. Blood. 2019;134:1441–4. - PubMed
    1. Yang F, Long N, Anekpuritanang T, Bottomly D, Savage JC, Lee T, et al. Identification and prioritization of myeloid malignancy germline variants in a large cohort of adult patients with AML. Blood. 2022;139:1208–21. - PMC - PubMed
    1. Mosler T, Conte F, Longo GMC, Mikicic I, Kreim N, Möckel MM, et al. R-loop proximity proteomics identifies a role of DDX41 in transcription-associated genomic instability. Nat Commun. 2021;12:7314. - PMC - PubMed

Publication types

Substances