. 2022 Oct 13;13(1):6051.
doi: 10.1038/s41467-022-33793-w.

Co-expression of a PD-L1-specific chimeric switch receptor augments the efficacy and persistence of CAR T cells via the CD70-CD27 axis

Affiliations

Co-expression of a PD-L1-specific chimeric switch receptor augments the efficacy and persistence of CAR T cells via the CD70-CD27 axis

Le Qin et al. Nat Commun. .

Abstract

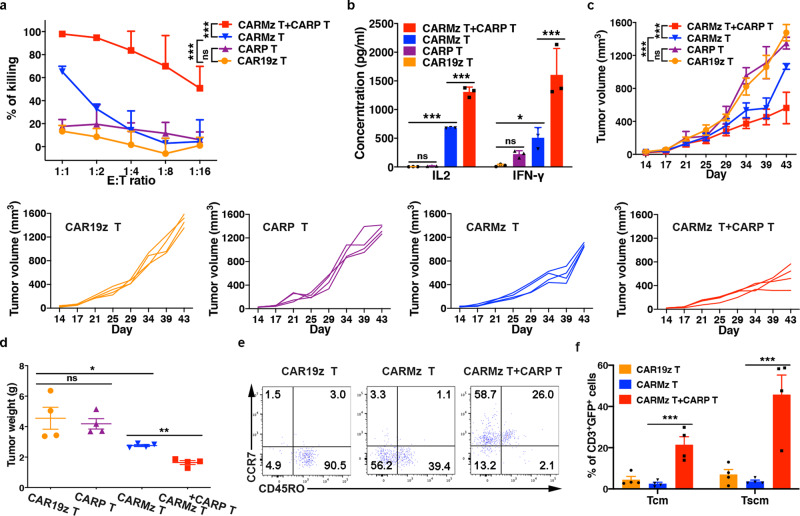
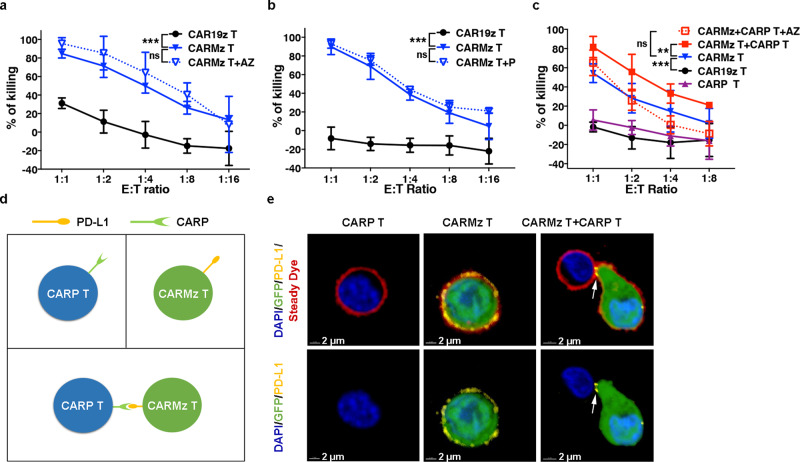
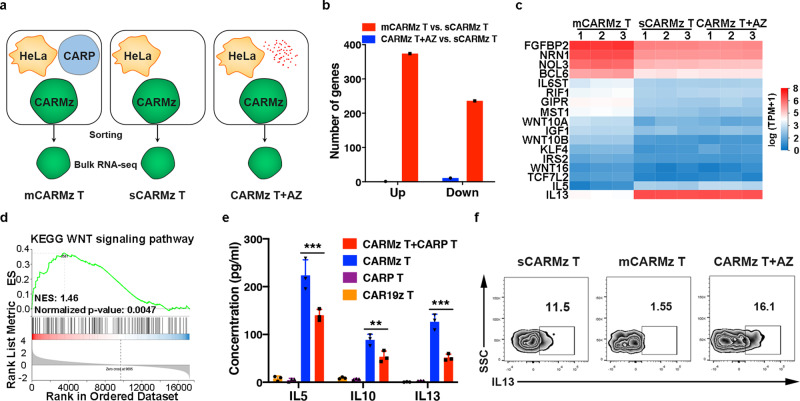
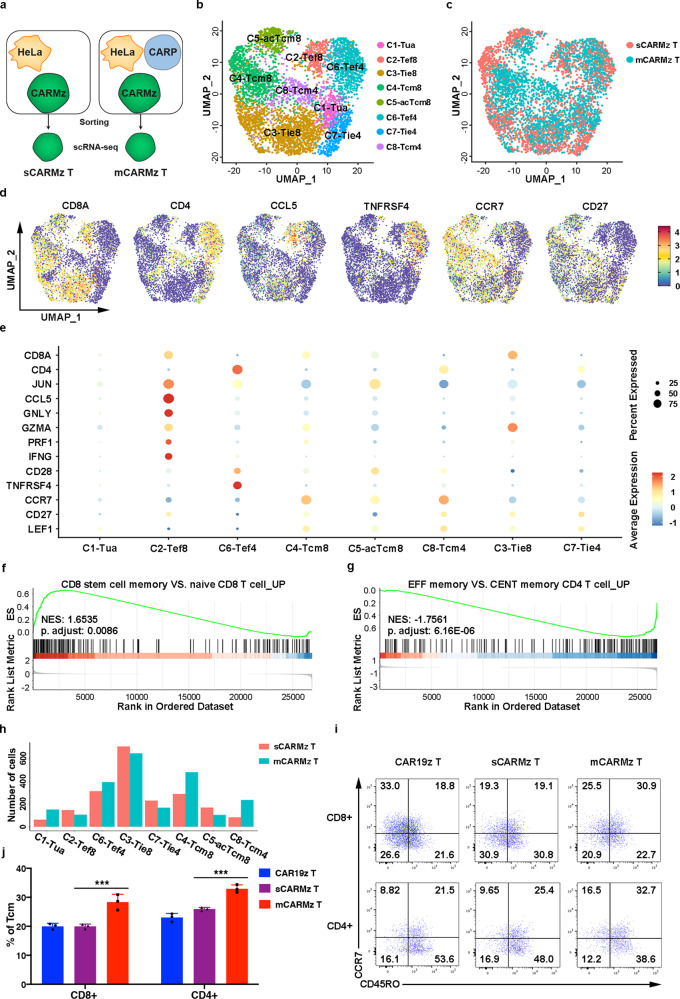
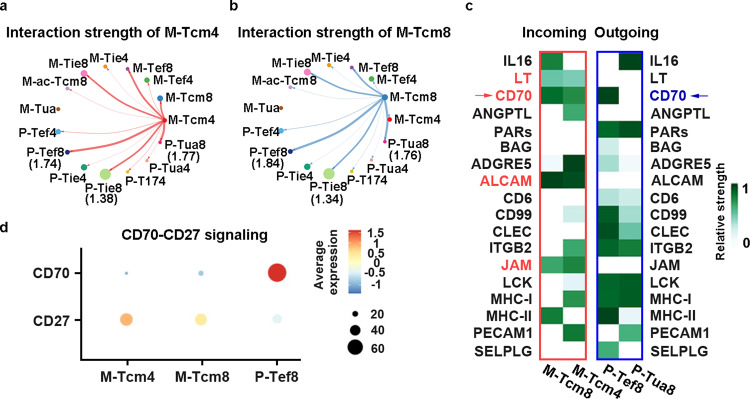
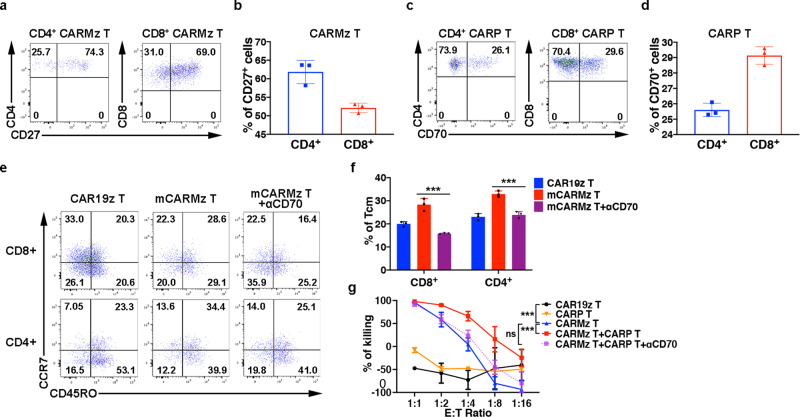
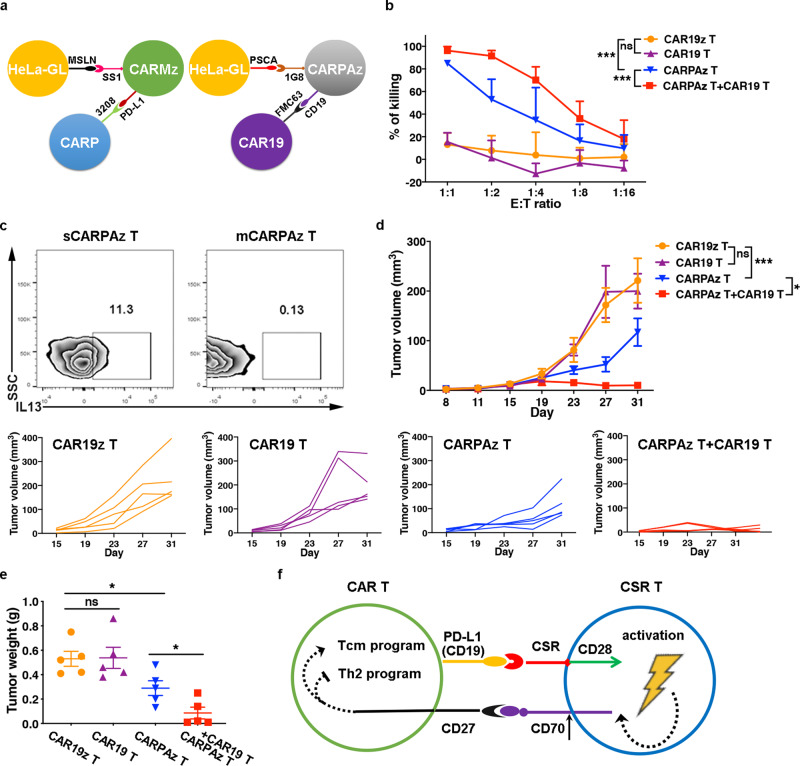
Co-expression of chimeric switch receptors (CSRs) specific for PD-L1 improves the antitumor effects of chimeric antigen receptor (CAR) T cells. However, the effects of trans-recognition between CSRs and PD-L1 expressed by activated CAR T cells remain unclear. Here, we design a CSR specific for PD-L1 (CARP), containing the transmembrane and cytoplasmic signaling domains of CD28 but not the CD3 ζ chain. We show that CARP T cells enhance the antitumor activity of anti-mesothelin CAR (CARMz) T cells in vitro and in vivo. In addition, confocal microscopy indicates that PD-L1 molecules on CARMz T cells accumulate at cell-cell contacts with CARP T cells. Using single-cell RNA-sequencing analysis, we reveal that CARP T cells promote CARMz T cells differentiation into central memory-like T cells, upregulate genes related to Th1 cells, and downregulate Th2-associated cytokines through the CD70-CD27 axis. Moreover, these effects are not restricted to PD-L1, as CAR19 T cells expressing anti-CD19 CSR exhibit similar effects on anti-PSCA CAR T cells with truncated CD19 expression. These findings suggest that target trans-recognition by CSRs on CAR T cells may improve the efficacy and persistence of CAR T cells via the CD70-CD27 axis.


Conflict of interest statement

Z.T. and P.L. are scientific founders of GZI and have equity in GZI. The remaining authors declare no competing interests.

Figures

Fig. 1
Fig. 1. CARP T cells enhance the antitumor efficacy of CARMz T cells.
a CARP T, CARMz T, a mixture of CARMz T and CARP T and control CAR19z T cells cytotoxicity against HeLa-GL cells were measured at various E:T ratios. Data are presented as mean ± SD (N = 3 independent experiments). p Values (CAR19z T vs. CARP T = 0.115, CAR19z T vs. CARMz T = 2.903E−04, CARMz T + CARP T vs. CARMz T = 4.92E−13). b The production of IL-2 and IFN-γ by CARP T, CARMz T, a mixture of CARMz T and CARP T and control CAR19z T cells. Data are presented as mean ± SD (N = 3 biological samples). p Values (CAR19z T vs. CARP T = IL2: 0.757, IFN-γ: 0.360, CAR19z T vs. CARMz T = IL2: 5.795E−08, IFN-γ: 0.044, CARMz T + CARP T vs. CARMz T = IL2: 1.035E−07, IFN-γ: 6.386E−04). cf NSI mice bearing HeLa-GL tumors (5 × 105, established for 14 days) were infused with CARP T, CARMz T, a mixture of CARMz T and CARP T or CAR19z T cells (2.5 × 106). c Tumor volumes were monitored on the indicated days. Individual tumor responses to CAR-T cell injection are shown with spider plots below. Data are presented as mean ± SD (N = 4 mice per group). p Values (CAR19z T vs. CARP T = 0.999, CAR19z T vs. CARMz T = 4.282E−10, CARMz T + CARP T vs. CARMz T = 1.915E−06). d Tumor weights were measured after mouse euthanasia. p Values (CAR19z T vs. CARP T = 0.897, CAR19z T vs. CARMz T = 0.025, CARMz T + CARP T vs. CARMz T = 0.004). e Representative phenotype of CARMz T, CARMz T from a mixture of CARMz T and CARP T and control CAR19z T cells (gated on CD3+GFP+ cells) within tumors. f Proportions of Tcm (central memory T, CD45RO+CCR7+) and Tscm (stem cell memory T, CD45ROCCR7+) cells in (e). p Values (CARMz T + CARP T vs. CARMz T = Tcm: 3.799E−04, Tscm: 5.043E−04). Data of d and f are presented as mean ± SEM (N = 4 mice per group). p Values of a and c were calculated by two-way ANOVA with Tukey’s multiple comparisons test. p Values of b, d, and f were calculated by one-way ANOVA with Sidak’s post hoc test. *p < 0.05, **p < 0.01, and ***p < 0.001.
Fig. 2
Fig. 2. Formation of cell–cell connections between CARMz T and CARP T cells.
a CARMz T and CAR19z T cells with or without an anti-PD-L1 mAb (AZ, 20 μg/ml) against HeLa-GL cells were measured at various E:T ratios. p Values (CAR19z T vs. CARMz T = 7.499E−10, CARMz T + AZ vs. CARMz T = 0.164). b CARMz T and CAR19z T cells with or without an anti-PD-1 mAb (P, 20 μg/ml) against HeLa-GL cells were measured at various E:T ratios. p Values (CAR19z T vs. CARMz T = 5E−14, CARMz T + P vs. CARMz T = 0.084). c CARMz T, CARP T, a mixture of CARMz T and CARP T, a mixture of CARMz T and CARP T treated with anti-PD-L1 mAb (AZ, 20 μg/ml) and control CAR19z T cells against HeLa-GL cells were measured at various E:T ratios. p Values (CAR19z T vs. CARMz T = 3.309E−07, CARMz T + CARP T vs. CARMz T = 0.001, CARMz T + CARP T + AZ vs. CARMz T = 0.939). Data of ac are presented as mean ± SD (N = 3 independent experiments). p Values of ac were calculated by two-way ANOVA with Tukey’s multiple comparisons test. d Schematic diagram of the interaction between CARMz T and CARP T cells. Individual CARP T cells (upper left), individual CARMz T cells with PD-L1 expression (upper right), and the mixture of CARMz T and CARP T cells (below). e CARMz T, CARP T and a mixture of CARMz T and CARP T cells were stained for nuclei (blue), cell membrane (red), and PD-L1 (yellow) after incubate with HeLa cells (N = 4 independent experiments and three representative pictures were presented). GFP staining corresponds to CARMz T cells. The white arrow indicates cell-cell contacts between CARP and PD-L1 molecules. ***p < 0.001.
Fig. 3
Fig. 3. Bulk RNA-seq analysis of individual CARMz T (sCARMz T), CARMz T from a mixture of CARMz T and CARP T (mCARMz T) and CARMz T cells treated with anti-PD-L1 mAb (CARMz T + AZ) after coculture with HeLa-GL cells.
ad Bulk RNA-seq strategy: individual CARMz T (sCARMz T), CARMz T from a mixture of CARMz T and CARP T (mCARMz T) and CARMz T cells treated with AZ (20 μg/ml) (CARMz T + AZ) were isolated by flow cytometry sorting based on their GFP tag post-coculture with HeLa-GL cells, and then performed bulk RNA-seq analysis (N = 3 biological samples). The red dots represent AZ. b The numbers of genes upregulated and downregulated in CARMz T + AZ and mCARMz T compared with sCARMz T. c The heatmap shows clustering of differential expressed genes (DEGs) in sCARMz T, mCARMz T, and CARMz T + AZ (N = 3 biological samples). Cutoff: absolute log2 (fold change) ≥ 1; adjusted P value ≤0.05. d GSEA illustrating the enrichment of genes in WNT signaling pathway in mCARMz T versus sCARMz T. NES (Normalized Enrichment Scores) and normalized p-values are indicated. e The production of IL5, IL10, and IL13 by CARP T, CARMz T, a combination of CARMz T and CARP T and control CAR19z T cells post-coculture with HeLa-GL cells. Data are presented as mean ± SD (N = 3 independent experiments). p Values were calculated by two-way ANOVA with Tukey’s multiple comparisons test (CARMz T + CARP T vs. CARMz T = IL5: 1.016E−07, IL10: 0.009, IL13: 7.235E−07). f Percentage of IL13-scecreting cells in individual CARMz T (sCARMz T), CARMz T from a mixture of CARMz T and CARP T (mCARMz T) and CARMz T cells treated with AZ (20 μg/ml) (CARMz T + AZ) post-coculture with HeLa-GL cells at a 1:1 E:T ratio for 24 h (gated on CD3+GFP+ cells). *p < 0.05, **p < 0.01 and ***p < 0.001.
Fig. 4
Fig. 4. scRNA-seq analysis of individual CARMz T (sCARMz T) and CARMz T from a mixture of CARMz T and CARP T cells (mCARMz T) after coculture with HeLa-GL cells.
ah Single cell RNA-seq strategy: Individual CARMz T (sCARMz T) and CARMz T from a combination of CARMz T and CARP T cells (mCARMz T) were separated by flow cytometry sorting based on their GFP tag post-coculture with HeLa-GL cells, and then processed for scRNA-seq. b The UMAP projection of single CARMz T from sCARMz T and mCARMz T cells. C1-Tua: non-activated T cells, C2-Tef8: CD8+ effector T cells, C3-Tie8: partially differentiated CD8+ effector T cells, C4-Tcm8: CD8+ central memory T cells, C5-acTcm8: activated CD8+ central memory T cells, C6-Tef4: CD4+ effector T cells, C7-Tie4: partially differentiated CD4+ effector T cells, C8-Tcm4: CD4+ central memory T cells. Each dot corresponds to a single cell. c Single cells from sCARMz T (red) and mCARMz T (blue) clusters in distinct regions of the UMAP space. d Single-cell transcript levels of CD8, CD4, CCL5, TNFRSF4, CCR7, and CD27 illustrated in UMAP plots. e Dot plot of selected DEGs expressed in each cluster. f, g GSEA illustrating the enrichment of genes defined as “CD8 stem cell memory vs. naive CD8 T cell UP” in cluster Tcm8 and genes defined as “effector memory vs. central memory CD4 T cell UP” in cluster Tcm4. NES (Normalized Enrichment Scores) and p adjust are indicated. h Bar graphs summarizing the number of sCARMz T and mCARMz T cells in each cluster. i Representative phenotype of separated CARMz T (sCARMz T), CARMz T from a mixture of CARMz T and CARP T (mCARMz T), and control CAR19z T cells (gated on CD8+GFP+ cells and CD8GFP+ cells) post-coculture with HeLa cells for 36 h. j Proportion of Tcm (central memory T cells, CD45RO+CCR7+) in sCARMz T, mCARMz T and control CAR19z T cells in (i). Data are presented as mean ± SD (N = 3 biological samples). p Values were calculated by two-way ANOVA with Tukey’s multiple comparisons test (mCARMz T vs. sCARMz T = CD8+: 3.913E−05, CD4+: 2.268E−04). ***p < 0.001.
Fig. 5
Fig. 5. Quantitative analysis of intercellular communication between CARMz T and CARP T cells.
a, b The inferred interaction strength of CD4+ central memory CARMz T cells (M-Tcm4) and CD8+ central memory CARMz T cells (M-Tcm8) with other cell clusters from CARMz T and CARP T cells. The top three interaction strength were shown with numbers that indicate the strength of interactions in Supplementary Table 1. c Heatmap shows the inferred incoming signaling pathways of M-Tcm4 and M-Tcm8 and outgoing signaling pathways of P-Tef8 and P-Tua8 by CellChat tool. Incoming signaling pathways are shown in the red box on the left and outgoing signaling pathways are shown in the blue box on the right. The relative strength was used to calculate intercellular communication probability. “M” indicates CARMz T and “P” indicates CARP T cells as for the name of each cell cluster on the horizontal axis. d Dot plot shows the average expression of CD27 and CD70 in M-Tcm4, M-Tcm8, and P-Tef8 clusters.
Fig. 6
Fig. 6. CARP T cells augments the efficacy and persistence of CARMz T cells via the CD70-CD27 axis.
a Percentage of CD27 expression in CD8+ (gated on CD8+GFP+ cells) and CD4+ (gated on CD4+GFP+ cells) CARMz T cells post-coculture with HeLa-GL cells. b Bar graphs summarizing the percentage of CD27 expression in (a). Data are represented mean ± SD (N = 3 biological samples). c Percentage of CD70 expression in CD4+ (gated on CD4+CD19+ cells) and CD8+ (gated on CD8+CD19+ cells) CARP T cells post-coculture with HeLa-GL cells. d Bar graphs summarizing the percentage of CD70 expression in (c). Data are represented mean ± SD (N = 3 biological samples). e Representative phenotype of CARMz T cells (gated on CD8+GFP+ cells and CD8-GFP+ cells) from a mixture of CARMz T and CARP T (mCARMz T), a mixture of CARMz T and CARP T treated with anti-CD70 mAb (10 μg/ml) (mCARMz T + αCD70) and control CAR19z T cells were measured post-coculture with HeLa cells for 36 h. f Proportion of Tcm (central memory T cells, CD45RO+CCR7+) in (e). Data are presented as mean ± SD (N = 3 biological samples). p Values were calculated by two-way ANOVA with Tukey’s multiple comparisons test (mCARMz T + αCD70 vs. mCARMz T = CD8+: 9.423E−07, CD4+: 2.858E−05). g CARP T, CARMz T, a mixture of CARMz T and CARP T, a mixture of CARMz T and CARP T treated with anti-CD70 mAb (αCD70) and control CAR19z T cells cytotoxicity against HeLa-GL cells were measured at various E:T ratios. Data are presented as mean ± SD (N = 3 independent experiments). p Values were calculated by two-way ANOVA with Tukey’s multiple comparisons test (CARMz T vs. CAR19z T = 2.052E-09, CARMz T + CARP T vs. CARMz T = 7.427E−10, CARMz T + CARP T + αCD70 vs. CARMz T = 0.248). ***p < 0.001.
Fig. 7
Fig. 7. CAR19 T cells enhance the antitumor effect of CARPAz T cells.
a Schematic diagram of the heterotypic binding of CARMz T cells to CARP T cells (left) and CARPAz T cells to CAR19 T cells (right). Antigens and scFvs are indicated. b CAR19 T, CARPAz T, a mixture of CAR19 T and CARPAz T and control CAR19z T cells cytotoxicity against targeting HeLa-GL cells were measured at various E:T ratios. Data are presented as mean ± SD (N = 3 independent experiments). p Values (CAR19 T vs. CAR19z T = 0.504, CARPAz T vs. CAR19z T = 1.591E-09, CARPAz T + CAR19 T vs. CARPAz T = 2.471E-04). c Percentage of IL3+ cells in individual CARPAz T (sCARPAz T) and CARPAz T from a mixture of CARPAz T and CAR19 T cells (mCARPAz T) post-coculture with HeLa-GL cells at a 1:1 E:T ratio for 24 h (gated on CD3+CD19+ cells). d, e NSI mice bearing HeLa-GL tumors (5 × 105, established for 8 days) were infused with CARPAz T, CAR19 T, a mixture of CARPAz T and CAR19 T or control CAR19z T cells (5 × 106). d Tumor volumes were monitored on the indicated days. Individual tumor responses to CAR-T cell injection are shown with spider plots below. p Values (CAR19 T vs. CAR19z T = 0.999, CARPAz T vs. CAR19z T = 5.491E−04, CARPAz T + CAR19 T vs. CARPAz T = 0.040). e Tumor weights were measured after mouse euthanasia. p Values \ANOVA with Sidak’s post hoc test (CAR19 T vs. CAR19z T = 0.932, CARPAz T vs. CAR19z T = 0.019, CARPAz T + CAR19 T vs. CARPAz T = 0.042). f Schematic diagram of interactions between CSR T and CAR-T cells. CSR T cells bound to CAR T cells through cell-cell contacts (CSR to PD-L1 or CD19), promoted CAR T cells to differentiate to central memory-like T cells (Tcm), and inhibited the formation of Th2 cells in CAR T cells via the CD70-CD27 axis. Data of d and e are presented as mean ± SEM (N = 5 mice per group). p Values of b and d were calculated by two-way ANOVA with Tukey’s multiple comparisons test. *p < 0.05 and ***p < 0.001.

Similar articles

Cited by

References

    1. Wang J, et al. PD-1, PD-L1 (B7-H1) and tumor-site immune modulation therapy: The historical perspective. J. Hematol. Oncol. 2017;10:34. doi: 10.1186/s13045-017-0403-5. - DOI - PMC - PubMed
    1. Sharpe AH, Pauken KE. The diverse functions of the PD1 inhibitory pathway. Nat. Rev. Immunol. 2018;18:153–167.. doi: 10.1038/nri.2017.108. - DOI - PubMed
    1. Latchman Y, et al. PD-L2 is a second ligand for PD-1 and inhibits T cell activation. Nat. Immunol. 2001;2:261–268. doi: 10.1038/85330. - DOI - PubMed
    1. Freeman GJ, et al. Engagement of the PD-1 immunoinhibitory receptor by a novel B7 family member leads to negative regulation of lymphocyte activation. J. Exp. Med. 2000;192:1027–1034. doi: 10.1084/jem.192.7.1027. - DOI - PMC - PubMed
    1. Zak KM, et al. Structural biology of the immune checkpoint receptor PD-1 and its ligands PD-L1/PD-L2. Structure. 2017;25:1163–1174.. doi: 10.1016/j.str.2017.06.011. - DOI - PubMed

Publication types