. 2022 Nov;227(8):2821-2837.
doi: 10.1007/s00429-022-02578-8. Epub 2022 Oct 14.

Retrosplenial and subicular inputs converge on superficially projecting layer V neurons of medial entorhinal cortex

Affiliations

Retrosplenial and subicular inputs converge on superficially projecting layer V neurons of medial entorhinal cortex

Øyvind Wilsgård Simonsen et al. Brain Struct Funct. 2022 Nov.

Abstract

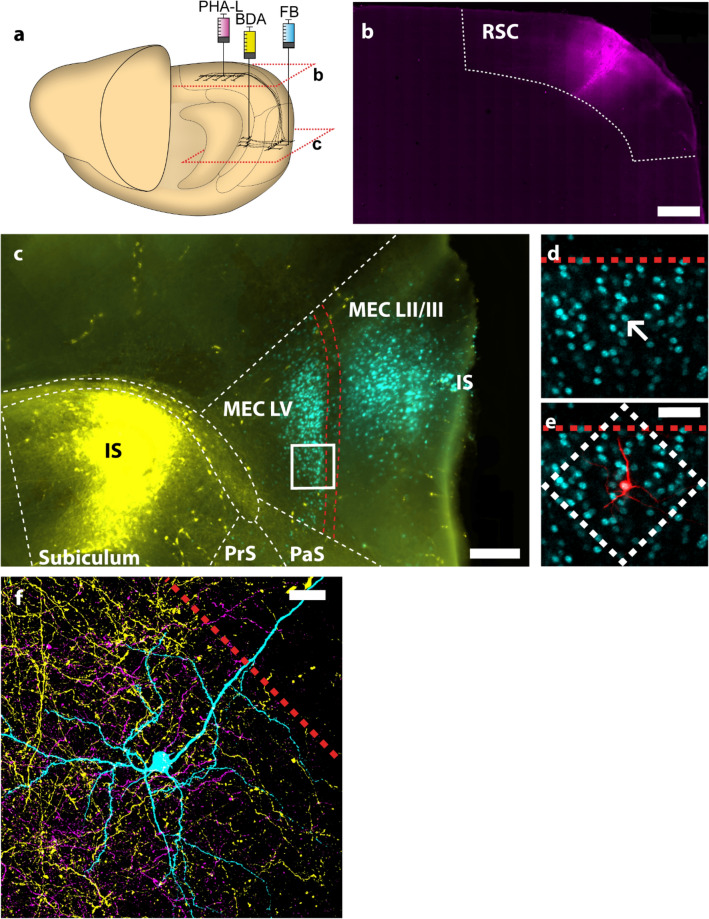
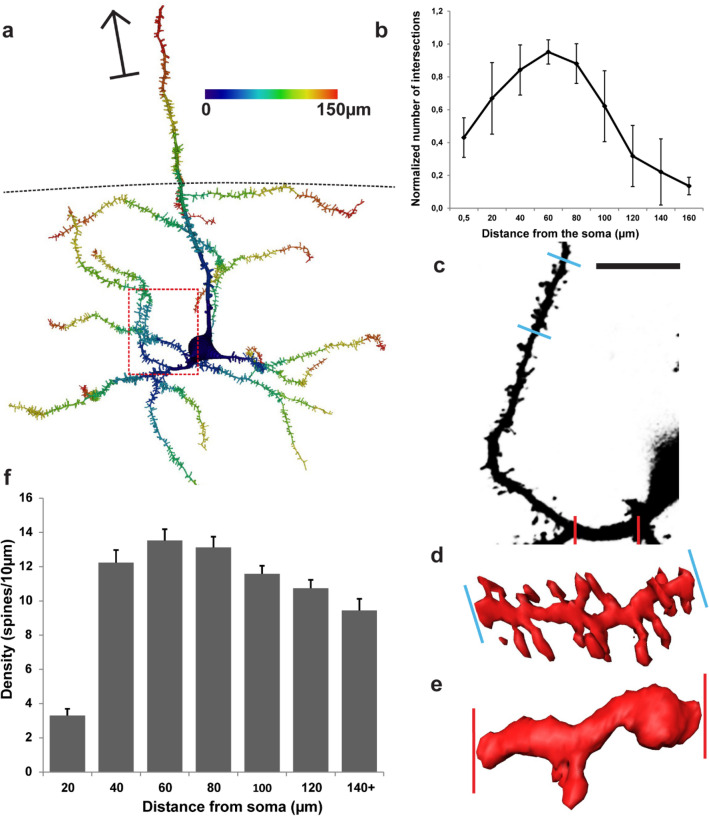
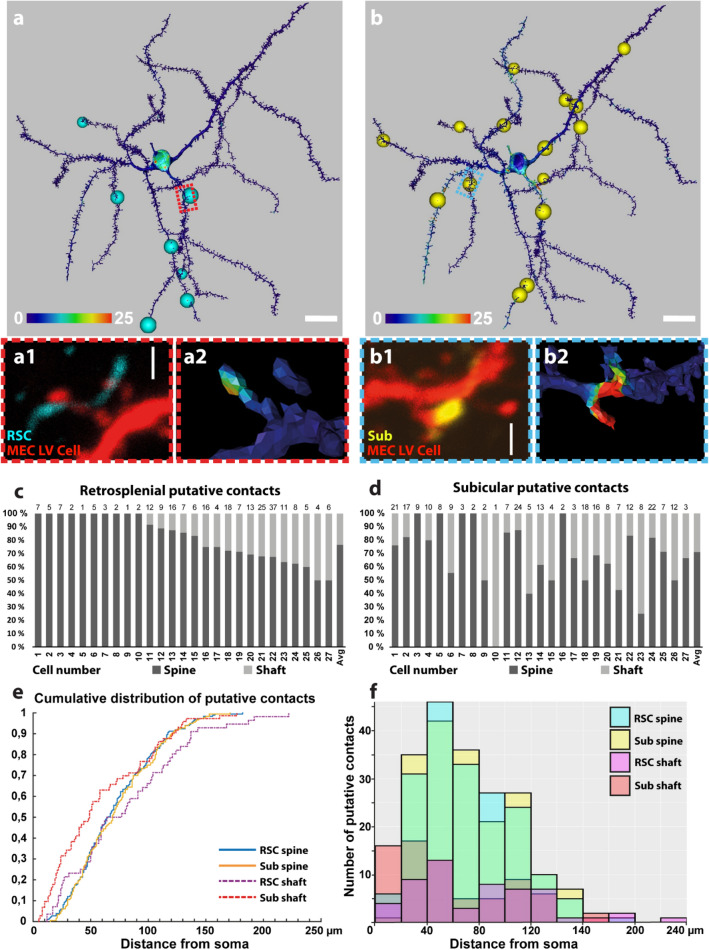
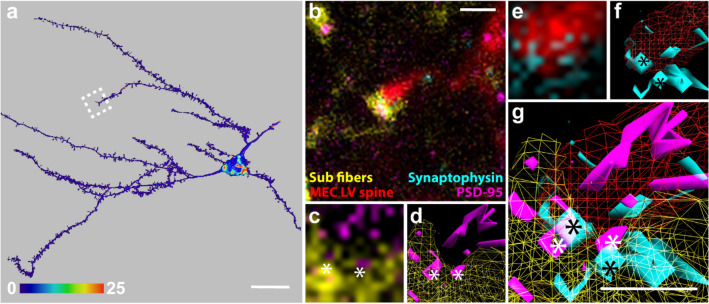
The medial entorhinal cortex (MEC) plays a pivotal role in spatial processing together with hippocampal formation. The retrosplenial cortex (RSC) is also implicated in this process, and it is thus relevant to understand how these structures interact. This requires precise knowledge of their connectivity. Projections from neurons in RSC synapse onto principal neurons in layer V of MEC and some of these neurons send axons into superficial layers of MEC. Layer V of MEC is also the main target for hippocampal efferents from the subiculum and CA1 field. The aim of this study was to assess whether the population of cells targeted by RSC projections also receives input from the hippocampal formation and to compare the distribution of synaptic contacts on target dendrites. We labeled the cells in layer V of MEC by injecting a retrograde tracer into superficial layers. At the same time, we labeled RSC and subicular projections with different anterograde tracers. 3D-reconstruction of the labeled cells and axons revealed likely synaptic contacts between presynaptic boutons of both origins and postsynaptic MEC layer V basal dendrites. Moreover, these contacts overlapped on the same dendritic segments without targeting specific domains. Our results support the notion that MEC layer V neurons that project to the superficial layers receive convergent input from both RSC and subiculum. These data thus suggest that convergent subicular and RSC information contributes to the signal that neurons in superficial layers of EC send to the hippocampal formation.

Keywords: Confocal microscopy; Entorhinal cortex; Hippocampal-entorhinal projections; Input convergence; Intrinsic circuitry; Neuroanatomical tracing.


Conflict of interest statement

The authors have no relevant financial or non-financial interests to disclose.

Figures

Fig. 1
Fig. 1
Experimental design. a Schematic illustration of a rat brain and the injection sites. FB (cyan) was injected into the superficial layers of MEC. One of the anterograde tracers BDA (yellow) or PHA-L (magenta) was injected into the RSC, whilst the other was injected into the subiculum. b and c indicate the levels of panels b and c. b PHA-L (magenta) injection site in RSC. Scale bar 1000 µm. (c) BDA injection site in subiculum (IS; yellow) and most ventral tip of FB injection site (IS) in superficial MEC. Red lines indicate lamina dissecans. Sections with a thickness of 100 µm were used to select 400 µm thick sections suitable for intracellular injection. The white rectangle indicates the zoomed region of the corresponding area in an adjacent 400 µm section depicted in d and e. Scale bar 500 µm. d FB-positive neurons in layer V of MEC. Target neuron for intracellular filling indicated (arrow). Lamina dissecans border indicated with a red line. e Filled neuron (red) overlapping with FB. White rectangle indicates the XY-plane limits of the confocal image stack maximum projection shown in f. Scale bar 20 µm. f Maximum projection image of confocal stack depicting filled neuron (cyan), BDA-positive axonal fibers (yellow) and PHA-L-positive axonal fibers (magenta). Scale bar 20 µm. 1a adapted from (Czajkowski et al. 2013)
Fig. 2
Fig. 2
Morphological properties of MEC LV neurons. a A representative example of a reconstructed LV principal neuron based on the image stack in Fig. 1f. Distance from soma is represented by blue to red coloring. Arrow points toward the pia. Dashed line indicates the border between LVa and LVb. Red dashed box indicates area depicted in panel c. b Sholl analysis illustrating the change of dendritic complexity in relation to distance from the soma (n = 27 from 8 animals). Sholl values were normalized to the number of first-order dendrites. Error bars show SEM. c–e Comparison of spine density between proximal and distal parts of the dendritic tree. c High-resolution representation of the dendrite taken from the boxed area in a, showing the selected proximal (red bars) and distal (blue bars) parts of the dendrite. Scale bar 10 µm. d Example of the distal part (60–70 µm from the soma). e Example of the proximal part (0–10 µm) from the soma). f Spine density along the length of the dendritic tree as measured by distance from the soma. Bin size 20 µm. Error bars show SEM
Fig. 3
Fig. 3
Convergence of putative RSC and Sub contacts onto single MEC LV neurons. a Surface rendering of RSC input mapping of the cell imaged in Fig. 1f and depicted in Fig. 2a (cell number 19). Staining intensity of anterograde tracer injected into RSC (in this case PHA-L) within 300 nm of the reconstructed surface shown color-coded as a heat map. Cyan spheres indicate points fulfilling the criteria for a putative synaptic contact. Red rectangular box indicates the region shown in a1–a2. Scale bar 20 µm. a1 Close-up example of a putative contact between PHAL-positive axonal bouton and a spine. Scale bar 1 µm. a2 Heat map surface rendering showing the proximity of PHA-L-positive axon and the reconstructed cell surface. b Surface rendering of subicular input mapping onto the same neuron (#19) depicted in a. Staining intensity of anterograde tracer injected into subiculum (in this case BDA) within 300 nm of the reconstructed surface shown color-coded as a heat map. Yellow spheres indicate points fulfilling the criteria for a putative synaptic contact. Cyan rectangular box indicates the region shown in b1b2. b1 Close-up example of a putative contact between BDA-positive axonal bouton and a spine. Scale bar 1 µm. b2 Heat map surface rendering depicting the proximity of BDA-positive bouton and the reconstructed cell surface. c Bar graph showing the proportion of putative spine and shaft contacts with axonal fibers stemming from anterograde tracer injection in RSC (Y-axis) for all individual reconstructed neurons (1–27) and the average proportion (X-axis). Absolute number of contacts displayed above each bar. (d) Bar graph showing the proportion of putative spine and shaft contacts with axonal fibers stemming from anterograde tracer injection in subiculum (Y-axis) for all individual reconstructed neurons (1–27) and the average number (X-axis). Absolute number of contacts displayed above each bar. e Cumulative fraction of putative contacts along the dendritic length of reconstructed neurons. RSC spine contacts represented in cyan, subicular spine contacts in yellow, RSC shaft contacts in dashed purple and subicular shaft contacts in dashed red lines. f Histogram showing number of putative synaptic contacts (Y-axis) along the dendritic length (X-axis). RSC spine contacts represented in cyan, subicular spine contacts in yellow, RSC shaft contacts in purple and subicular shaft contacts in red columns. Green colour is a result of histograms representing RSC and subicular spine contacts overlapping. Bin size 20 µm
Fig. 4
Fig. 4
Staining of subicular putative contacts for synaptic proteins synaptophysin and PSD-95. a Surface rendering of a reconstructed neuron. Staining intensity of anterograde tracer BDA, injected in the subiculum, within 300 nm of the reconstructed surface is shown color-coded as a heat map. Dashed white square shows the area depicted in b. Scale bar 20 µm. b One plane of a confocal image stack showing an Alexa 568-filled dendritic spine (red), BDA-positive axonal fibres with boutons (yellow), labelling for PSD-95 (magenta) and synaptophysin (cyan). Scale bar 1 µm. c Overlap between BDA-positive synaptic bouton and PSD-95. d 3D-reconstruction of the image in c. White asterisks show overlapping elements. e Overlap between Alexa-568 filled dendritic spine and synaptophysin. f 3D-reconstruction of the image shown in e. Black asterisks show overlapping elements. g Reconstructions d and f merged, showing two points of overlap where overlapping elements of PSD-95 and synaptophysin are located between an Alexa-568-filled dendritic spine and a BDA-positive synaptic bouton, which also show some degree of overlap. Scale bar 0.5 µm
Fig. 5
Fig. 5
Staining for Ctip2. a Cresyl violet stain and delineation of deep regions of MEC and adjacent areas, including parasubiculum (PaS). Red line shows the border between the lamina dissecans and LV. Scale bar 50 µm. b Ctip2-positive neurons forming a thick band of neurons in LVb, while LVa contains only a few, weakly positive neurons. Axonal fibers are seen as a result of DAB staining of BDA injection in subiculum. Red arrowheads indicate locations of AF568-filled neurons in c. The rightmost neuron is Ctip2 negative, whilst the other two are positive. The middle neuron is the same neuron featured in Figs. 1d–f, 2 and 3. d High-power view of Ctip-2-positive neuron indicated with a red rectangular box in 5c. Scale bar 10 µm

Similar articles

Cited by

References

    1. Alexander AS, Nitz DA. Retrosplenial cortex maps the conjunction of internal and external spaces. Nat Neurosci. 2015;18(8):1143–1151. doi: 10.1038/nn.4058. - DOI - PubMed
    1. Alexander AS, Nitz DA. Spatially periodic activation patterns of Retrosplenial Cortex encode route sub-spaces and distance traveled. Curr Biol. 2017;27(11):1551–1560.e1554. doi: 10.1016/j.cub.2017.04.036. - DOI - PubMed
    1. Aoki C, Miko I, Oviedo H, Mikeladze-Dvali T, Alexandre L, Sweeney N, Bredt DS. Electron microscopic immunocytochemical detection of PSD-95, PSD-93, SAP-102, and SAP-97 at postsynaptic, presynaptic, and nonsynaptic sites of adult and neonatal rat visual cortex. Synapse. 2001;40(4):239–257. doi: 10.1002/syn.1047. - DOI - PubMed
    1. Auger SD, Mullally SL, Maguire EA. Retrosplenial cortex codes for permanent landmarks. PLoS ONE. 2012;7(8):e43620. doi: 10.1371/journal.pone.0043620. - DOI - PMC - PubMed
    1. Balcerek E, Włodkowska U, Czajkowski R. Retrosplenial cortex in spatial memory: focus on immediate early genes mapping. Mol Brain. 2021;14(1):172. doi: 10.1186/s13041-021-00880-w. - DOI - PMC - PubMed

LinkOut - more resources