Clinical Trial
. 2022 Nov;28(11):2364-2373.
doi: 10.1038/s41591-022-02015-7. Epub 2022 Oct 13.

Clinical and molecular response to tebentafusp in previously treated patients with metastatic uveal melanoma: a phase 2 trial

Affiliations
Clinical Trial

Clinical and molecular response to tebentafusp in previously treated patients with metastatic uveal melanoma: a phase 2 trial

Richard D Carvajal et al. Nat Med. 2022 Nov.

Abstract

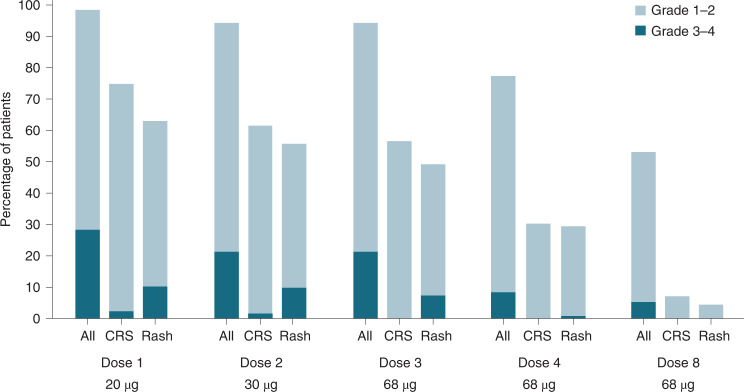
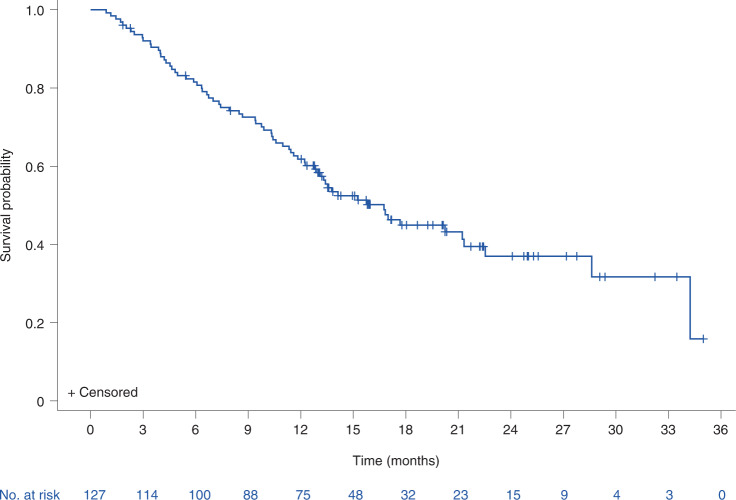
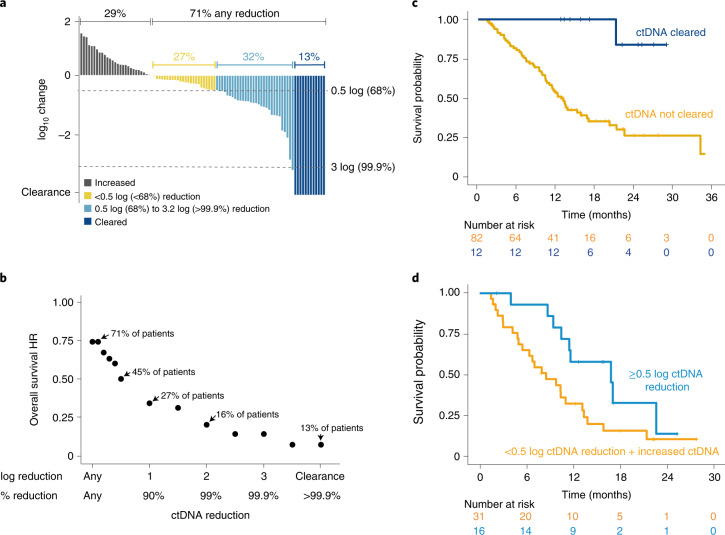
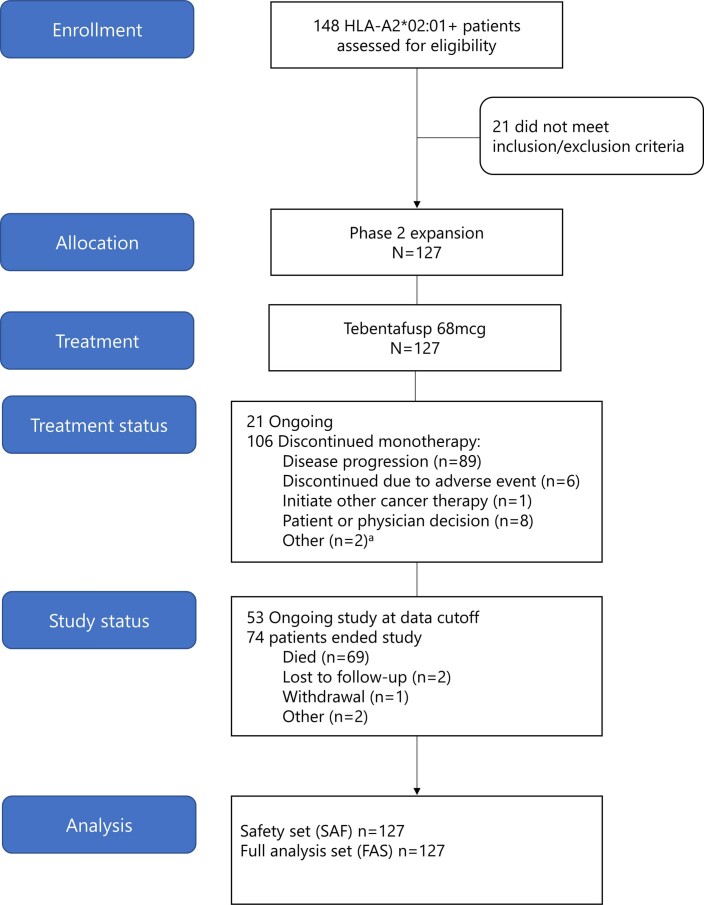
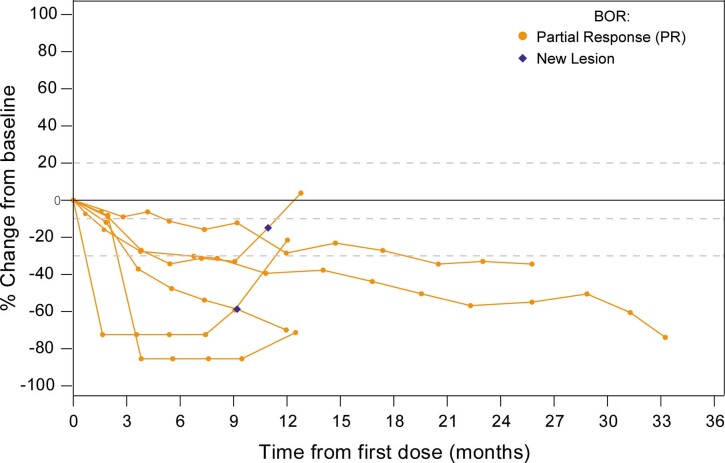
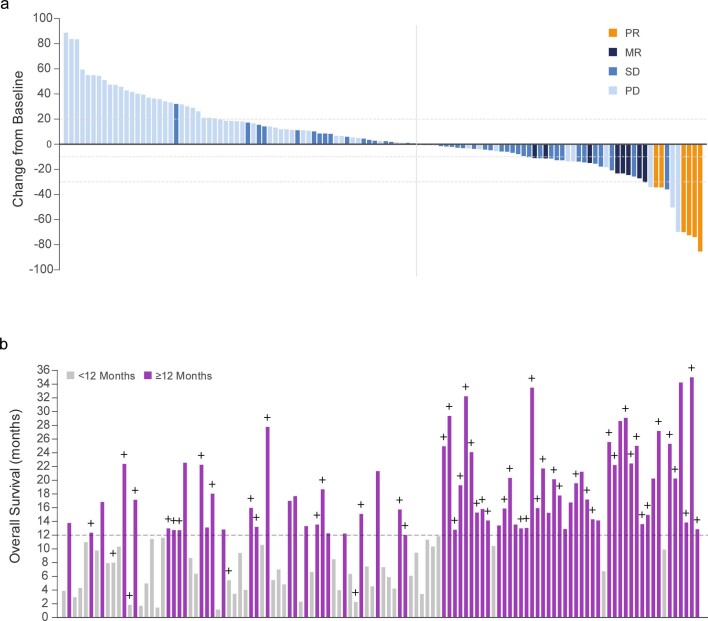
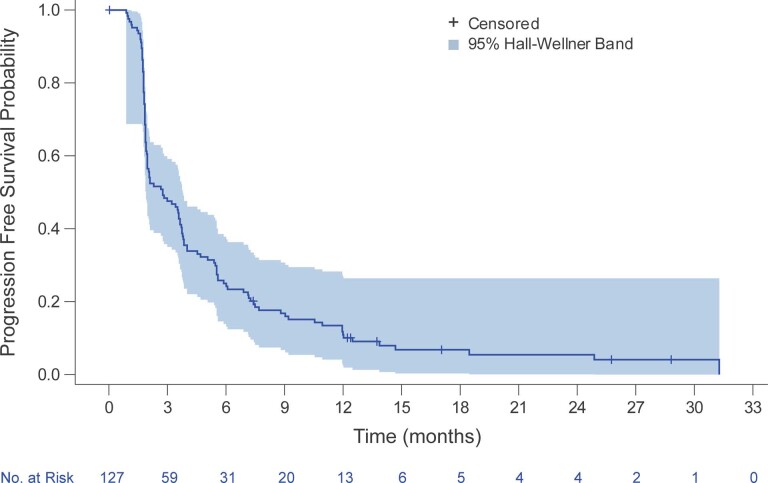
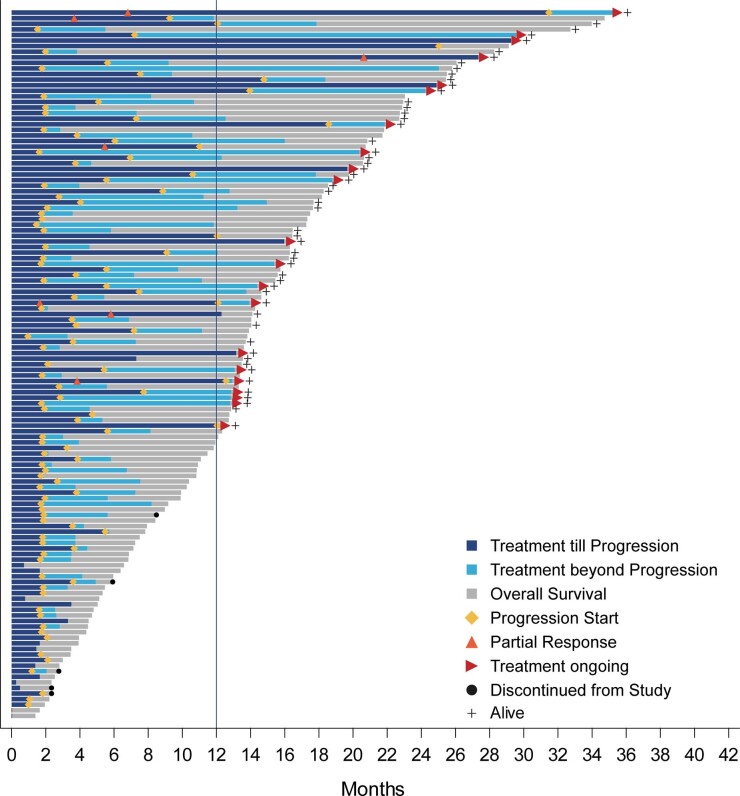
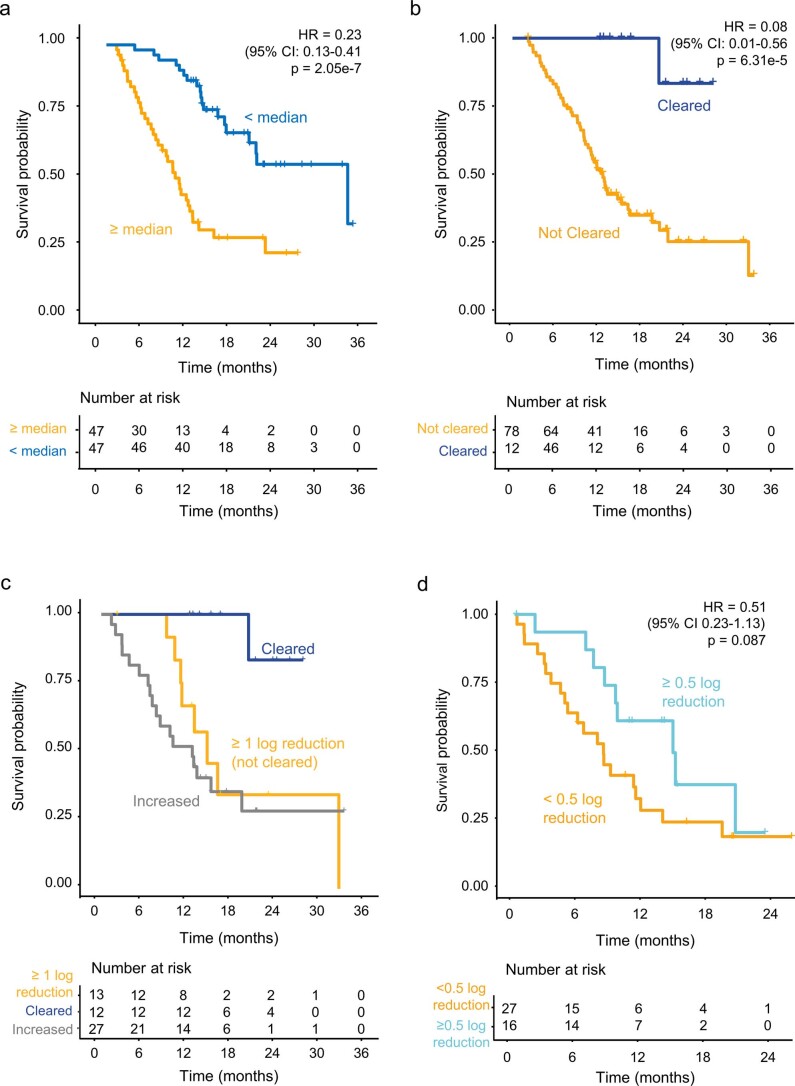
In patients with previously treated metastatic uveal melanoma, the historical 1 year overall survival rate is 37% with a median overall survival of 7.8 months. We conducted a multicenter, single-arm, open-label phase 2 study of tebentafusp, a soluble T cell receptor bispecific (gp100×CD3), in 127 patients with treatment-refractory metastatic uveal melanoma (NCT02570308). The primary endpoint was the estimation of objective response rate based on RECIST (Response Evaluation Criteria in Solid Tumours) v1.1. Secondary objectives included safety, overall survival, progression-free survival and disease control rate. All patients had at least one treatment-related adverse event, with rash (87%), pyrexia (80%) and pruritus (67%) being the most common. Toxicity was mostly mild to moderate in severity but was greatly reduced in incidence and intensity after the initial three doses. Despite a low overall response rate of 5% (95% CI: 2-10%), the 1 year overall survival rate was 62% (95% CI: 53-70%) with a median overall survival of 16.8 months (95% CI: 12.9-21.3), suggesting benefit beyond traditional radiographic-based response criteria. In an exploratory analysis, early on-treatment reduction in circulating tumour DNA was strongly associated with overall survival, even in patients with radiographic progression. Our findings indicate that tebentafusp has promising clinical activity with an acceptable safety profile in patients with previously treated metastatic uveal melanoma, and data suggesting ctDNA as an early indicator of clinical benefit from tebentafusp need confirmation in a randomized trial.


Conflict of interest statement

R.D.C. discloses consulting: Alkermes, BMS, Castle Biosciences, Delcath, Eisai, Hengrui, Ideaya, Immunocore, InxMed, Iovance, Merck, Novartis, Oncosec, Pierre Fabre, PureTech Health, Regeneron, Sanofi Genzyme, Sorrento Therapeutics, Trisalus; clinical/scientific advisory boards: Aura Biosciences, Chimeron, Rgenix. M.O.B. discloses advisory/consulting: Merck, BMS, Novartis, Sanofi, Pfizer, Adaptimmune, GSK, Immunocore, EMD Serono, Sun Pharma, Medison, Instil Bio, IOVANCE; research funding to self: Merck, Takara Bio; research funding to institution: Merck, BMS, Novartis, Sanofi, Adaptimmune, Immunocore, Regeneron, Lilly, Amgen, OncoSeq; Speaker: BMS, Merck, Pfizer, Novartis, Sanofi. A.N.S. discloses honoraria advisory board/personal fees: BMS, Castle Biosciences, Immunocore, Novartis; licensing/royalties: UpToDate; research funding to institution: BMS, Checkmate Pharmaceuticals, Foghorn Therapeutics, GSK, Immunocore, Novartis, Pfizer, Polaris, Targovax, Xcovery. J.C.H. discloses advisory boards (self): GSK, MSD, Pierre Fabre, Sun Pharma; advisory boards (institution): BMS, Immunocore, Novartis, Nektar, Philogen; contracted research: 4SC, BioNTech, BMS, Genentech/Roche, Idera, Immunocore, Iovance, Nektar, Novartis, Philogen, Pierre Fabre, Regeneron, Sanofi; honoraria: BMS, MSD, Novartis, Pierre Fabre, Roche, Sanofi, Sun Pharma; research funding to institution: BMS, Sun Pharma. A.I. discloses research funding to institution: Checkmate Pharmaceuticals, Dynavax, GSK/Sarah Cannon, Immunocore, Merck, Neon Therapeutics/Sarah Cannon. L.H.-A. discloses advisory/consulting: BMS, Castle Bioscience; research funding to institution: BMS, AstraZeneca, Merck, Amgen, Roche, Regeneron, Novartis, Immunocore, Merck-EMD, Corvus, Polynoma, Genentech, Foghorn. P.N. discloses advisory/consulting: BMS, Immunocore, Ipsen, Incyte, MSD, Merck, Novartis, Pfizer, 4SC; speaker’s bureau: BMS, Merck, Novartis, Pfizer; research funding to institution: Immunocore, Novartis. O.H. discloses contracted research (institute): Aduro, Akeso, Amgen, Bioatla, BMS, Genentech, GSK, Idera, Immunocore, Incyte, Merck, NextCure, Novartis, Pfizer, Sanofi/Regeneron, SeaGen, Zelluna; speaker’s bureau: BMS, Novartis, Pfizer, Sanofi/Regeneron; consulting/advisory board: Aduro, Akeso, Amgen, Beigene, Bioatla, BMS, Genentech, GSK, Idera, Immunocore, Incyte, Janssen, Merck, NextCure, Novartis, Pfizer, Sanofi/Regeneron, SeaGen, Tempus, Zelluna. J.M.P. discloses research funding: BeiGene, BMS, Immunocore, Mirati, MSD. M.R. discloses consulting: Health Advances. D.B.J. discloses consultancy: BMS, Catalyst, Iovance, Janssen, Mallinckrodt, Merck, Mosaic, Novartis, Oncosec, Pfizer, Targovax, Teiko; non-remunerated activities: Melanoma Guideline Committee (NCCN), Scientific Selection Committee (ASCO), Immunotherapy Toxicity Guidelines (SITC); research funding to self: BMS, Incyte; research funding to institution: Array Biopharma, Genentech, Immunocore, Nektar. J.J.L. discloses consulting: Abbvie, Bayer, BMS, Castle, Checkmate, Codiak, Crown, Day One, Duke St, EMD Serono, Endeavor, Flame, Genentech, Gilead, Glenmark, HotSpot, Kadmon, Janssen, Ikena, Immunocore, Incyte, IO Biotech, Macrogenics, Merck, Nektar, Novartis, Partner, Pfizer, Regeneron, Roivant, Servier, STINGthera, Synlogic, Synthekine; scientific advisory board (no stock): 7 Hills, Bright Peak, Exo, Fstar, Inzen, RefleXion, Xilio; scientific advisory board (stock): Actym, Alphamab Oncology, Arch Oncology, Kanaph, Mavu, NeoTx, Onc.AI, OncoNano, Pyxis, STipe, Tempest; Data and Safety Monitoring Board: Abbvie, Immutep, Evaxion; research funding to institution: Abbvie, Astellas, AstraZeneca, BMS, Corvus, Day One, EMD Serono, Fstar, Genmab, Ikena, Immatics, Incyte, Kadmon, KAHR, Macrogenics. Merck, Moderna, Nektar, NextCure, Numab, Palleon, Pfizer, Replimmune, Rubius, Servier, Scholar Rock, Synlogic, Takeda, Trishula, Tizona, Xencor; patents (provisional): serial no. 15/612,657 (Cancer Immunotherapy), PCT/US18/36052 (Microbiome Biomarkers for Anti-PD-1/PD-L1 Responsiveness: Diagnostic, Prognostic and Therapeutic Uses Thereof). E.E. discloses consulting: BMS, MSD, Novartis, Pierre Fabre; non-remunerated activities: Vice-President (Grupo Espanol Melanoma); speaker bureau: BMS, MSD, Novartis, Pierre Fabre. S.L. discloses consulting: Bayer, Immunocore; expenses: Bayer. L.C., H.M.G., K.R., C.H. and S.E.A. are employees and have stocks/shares or stock options in Immunocore, which could benefit from commercialization of these results. J.J.S. discloses advisory/consulting: Immunocore, BMS, MSD, Delcath, Amgen; speaker’s bureau: BMS, MSD, Pierre Fabre; research funding to institution: Immunocore, BMS, MSD, Amgen, AstraZeneca, Replimune. T.S. discloses advisory/consulting: Immunocore, Castle Biosciences; research funding to institution: Immunocore, Verastem.

Figures

Fig. 1
Fig. 1. Incidence and severity of treatment-related adverse events after the initial tebentafusp doses.
Percentage of treated patients with grade 1–2 grade 3–4 treatment-related adverse events after each dose of tebentafusp. A total of 127 patients received dose 1, 122 received dose 2, 122 received dose 3, 119 received dose 4 and 113 received dose 8. There were no treatment-related deaths. CRS, cytokine release syndrome.
Fig. 2
Fig. 2. Overall survival for tebentafusp-treated patients with metastatic uveal melanoma.
Kaplan–Meier plot of overall survival (n = 127). Events are deaths due to any cause. Patients not known to have died at the time of analysis are censored (+). The median overall survival was 16.8 months (95% CI: 12.9–21.3 months) with a 1 year overall survival rate of 62% (95% CI: 53–70%). The 1 year overall survival rate, median overall survival and corresponding two-sided, 95% confidence intervals were estimated using the Kaplan–Meier method.
Fig. 3
Fig. 3. On-treatment ctDNA reduction correlated with survival benefit.
a, Waterfall plot showing log10 change in ctDNA level by week 9 in all evaluable patients (n = 94). Percentages have been rounded to the nearest whole number. b, Correlation between ctDNA reduction in patients with metastatic uveal melanoma by week 9 with tebentafusp and the HR for death (R2 = 0.9, P = 8.89 × 10−7 by linear model (two sided); n = 94). Hazard ratios were derived by comparing subsets of patients with ctDNA above or below the thresholds given on the x axis. c,d, Kaplan–Meier comparison of overall survival in patients with ctDNA clearance (n = 12) versus patients without clearance (n = 82) by 9 weeks (HR 0.08, 95% CI: 0.01–0.54, P = 4.22 × 10−5) (c) and patients with best overall response of progressive disease with a reduction in ctDNA by ≥0.5 log fold change (n = 16) versus <0.5 log fold change (includes patients with increased ctDNA; n = 31) by week 9 (HR for death 0.47, 95% CI: 0.22–1.01, P = 0.042) (d). bd, Hazard ratios and confidence intervals were generated using a Cox proportional hazard model. P values were generated using a two-sided Cox likelihood ratio test.
Extended Data Fig. 1
Extended Data Fig. 1. CONSORT flowchart for a single-arm, open-label, phase 2 clinical trial with tebentafusp in patients with metastatic uveal melanoma.
All patients who received at least 1 full or partial dose of study drug are in the Safety Set. All patients assigned to treatment who received at least 1 full or partial dose of study drug are in the Full Analysis Set (FAS). aOne patient was classified as ‘Other – clinical disease progression’ rather than ‘Disease progression’ in error under reason for treatment discontinuation.
Extended Data Fig. 2
Extended Data Fig. 2. Tumour size change from baseline over time for patients with best overall response of partial response.
Spider plots showing change in tumour size over time for individual patients with a best overall response of partial response (PR) (n = 6). BOR = best overall response.
Extended Data Fig. 3
Extended Data Fig. 3. Clinical activity of tebentafusp.
(a) Waterfall plot showing the best change in tumour size (n = 116). 44% of patients had tumour reduction at any time. Tumour size was measured as the sum of longest diameters or short axis of the target lesions according to RECIST v1.1 by Independent Central Review. Best percent change in target lesion size was the maximum percent reduction from baseline or the minimum percent increase from baseline (in the absence of a reduction), up until disease progression or starting subsequent alternative cancer therapy. Complete response, partial response or minor response required confirmation at least 4 weeks later. Reference lines at 20%, -10%, and -30% mark target lesion response criteria for disease progression (PD), minor response (MR), and partial response (PR), respectively. SD, stable disease. (b) Overall survival in months is plotted for each patient (n = 116). 61.2% of patients survived more than 12 months. + denotes censored. (A-B) Only patients with at least one evaluable post-baseline target lesion scan were included. Eleven patients overall were not included due to non-measurable disease at baseline or no evaluable post-baseline target lesion scans. Evaluable post-baseline scans must be on or prior to disease progression or starting subsequent alternative cancer therapy to be considered.
Extended Data Fig. 4
Extended Data Fig. 4. Progression-Free Survival.
Kaplan–Meier estimate of progression-free survival for patients treated with tebentafusp. Tick marks represent patients who were known to be alive and without disease progression as assessed per Response Evaluation Criteria in Solid Tumours, version 1.1, by blinded, independent, central radiologic review. The median progression-free survival was 2.76 months (95% CI: 2-3.7) and was estimated by the Kaplan–Meier method.
Extended Data Fig. 5
Extended Data Fig. 5. Swimlane plot of overall survival and treatment beyond progression.
Swimlane plot showing overall survival, duration of treatment till progression and duration of treatment beyond initial progression (N = 127). The median duration of treatment beyond progression was 2.9 months (range: 0-23.1 months; n = 90).
Extended Data Fig. 6
Extended Data Fig. 6. Subgroup analysis of OS in the six major prognostic categories from this current study compared to a recent meta-analysis.
Digitized overlay of Kaplan–Meier estimates of overall survival for patients treated with tebentafusp in this study compared to curves from patients with the same negative baseline prognostic factor from a meta-analysis for ALP ≥ ULN, LDH ≥ ULN, ECOG > 0, Age ≥ 65, largest liver lesion ≥ 3 cm and male sex.
Extended Data Fig. 7
Extended Data Fig. 7. Tebentafusp OS in 2 L + population compared to meta-analysis and combination checkpoint inhibitors.
Digitized overlay of Kaplan–Meier estimates of overall survival for patients treated with tebentafusp in this study compared to 2 L + and 1 L populations from a meta-analysis (Rantala et al. 2019)18 and 1 L patients treated with combination ipilimumab and nivolumab in a single-arm phase 2 study (Piulats et al. 2021)16. Hazard ratios and 95% CIs calculated from a univariate Cox proportional hazards model. 1 L = first line, 2 L + = second line plus, IC = investigator’s choice, ipi = ipilimumab, nivo = nivolumab, OS = overall survival.
Extended Data Fig. 8
Extended Data Fig. 8. IPTW-Adjusted Kaplan–Meier Estimates of OS by Treatment Group.
Adjusted product-limit survival estimates with number of subjects at risk comparing OS from start of treatment of tebentafusp from this study (Study 102) (blue, n = 123) and Study 202 subsequent systemic therapy (red, n = 120). Using Propensity Scoring methods (IPTW), control patients in the IMCgp100-202 phase 3 study who received standard of care 2 L therapies were weighted so that, overall, they are similar with respect to their baseline prognostic factors to the tebentafusp-treated patients from this study (102). The primary analysis involving 2 L + patients from Study 102 compared to control patients in Study 202 who received any systemic therapy as their 2 L treatment resulted in an HR (95% CI) of 0.40 (0.29, 0.55). The hazard ratio was derived from a weighted Cox proportional hazards model and the 95% confidence interval was derived using robust sandwich estimation from the weighted Cox model. IPTW = inverse probability of treatment weights.
Extended Data Fig. 9
Extended Data Fig. 9. Baseline ctDNA level correlated with tumour burden.
(a-b) Correlation between level of ctDNA at baseline and (a) tumour size at baseline (n = 94; R = 0.6, p = 6e-10) and (b) LDH level at baseline (n = 91; R = 0.77, p = 6.76e-19). P-value and rho determined using two-sided Spearman rank correlation test. Tumour size was measured as the sum of longest diameters (mm) of the target lesions at first scan according to RECIST v1.1 by Independent Central Review. (c-e) Level of ctDNA at baseline was plotted for (c) patients who received prior IO therapy (n = 59) versus patients who did not (n = 35) (p = 0.42), (d) patients who experienced Rash in Week 1 (n = 60) versus patients who did not (n = 34) (0.043) and (e) patients who experienced CRS (n = 82) versus patients who did not (n = 9) (p = 0.28). Pairwise comparison between groups were conducted using two-sided Wilcoxon signed-rank test. The median is represented by the middle line while the upper and lower borders of the box identify the 75th and 25th percentiles, respectively. The whiskers correspond the minimum and maximal values that is within 1.5 times the interquartile range.
Extended Data Fig. 10
Extended Data Fig. 10. Baseline and on-treatment ctDNA level correlated with overall survival.
(a) Kaplan–Meier analysis of OS for patients with > median ctDNA levels at baseline versus patients with < median ctDNA levels at baseline (HR 0.23; 95% CI 0.13-0.41, p = 2.05e-7). (b) Kaplan–Meier analysis of OS landmarked to week 9 in patients with ctDNA clearance (n = 12) versus patients without clearance (n = 78) by 9 weeks (HR 0.08; 95% CI 0.01-0.56, p = 6.31e-5) and (c) Kaplan–Meier analysis of OS in patients with ctDNA clearance (n = 12) versus patients with ≥1 log ctDNA reduction (p = 0.001) and patients with increased ctDNA by 9 weeks (HR 0.74; 95% CI 0.32-1.71, p = 0.476). (d) Kaplan–Meier analysis of OS landmarked to week 9 in patients with best overall response of progressive disease with a reduction in ctDNA by ≥ 0.5 log fold change (n = 16) versus < 0.5 log fold change (n = 27) by week 9. Hazard ratio for death 0.51 (95% CI 0.23-1.13), p = 0.087. (a-d) Hazard ratio and confidence intervals were generated from Cox proportional hazard model. P values were generated from two-sided Cox likelihood ratio test.

References

    1. Milam, R. W. & Daniels, A. B. Uveal melanoma. In Melanoma (ed. Riker, A.) pp. 273–312 (Springer, 2018). 10.1007/978-3-319-78310-9_16
    1. Stang A, Parkin DM, Ferlay J, Jöckel K. International uveal melanoma incidence trends in view of a decreasing proportion of morphological verification. Int. J. Cancer. 2005;114:114–123. - PubMed
    1. Virgili G, et al. Incidence of uveal melanoma in Europe. Ophthalmology. 2007;114:2309–2315. - PubMed
    1. Kujala E, Makitie T, Kivela T. Very long-term prognosis of patients with malignant uveal melanoma. Invest. Ophthalmol. Vis. Sci. 2003;44:4651–4659. - PubMed
    1. Singh M, Durairaj P, Yeung J. Uveal melanoma: a review of the literature. Oncol. Ther. 2018;6:87–104. - PMC - PubMed

Publication types

Associated data