Cistanche tubulosa phenylethanoid glycosides suppressed adipogenesis in 3T3-L1 adipocytes and improved obesity and insulin resistance in high-fat diet induced obese mice
- PMID: 36229811
- PMCID: PMC9564091
- DOI: 10.1186/s12906-022-03743-6
Cistanche tubulosa phenylethanoid glycosides suppressed adipogenesis in 3T3-L1 adipocytes and improved obesity and insulin resistance in high-fat diet induced obese mice
Abstract
Background: Cistanche tubulosa is an editable and medicinal traditional Chinese herb and phenylethanoid glycosides are its major components, which have shown various beneficial effects such as anti-tumor, anti-oxidant and neuroprotective activities. However, the anti-obesity effect of C. tubulosa phenylethanoid glycosides (CTPG) and their regulatory effect on gut microbiota are still unclear. In the present study, we investigated its anti-obesity effect and regulatory effect on gut microbiota by 3T3-L1 cell model and obesity mouse model.
Methods: 3T3-L1 adipocytes were used to evaluate CTPG effects on adipogenesis and lipids accumulation. Insulin resistant 3T3-L1 cells were induced and used to measure CTPG effects on glucose consumption and insulin sensitivity. High-fat diet (HFD)-induced C57BL/6 obese mice were used to investigate CTPG effects on fat deposition, glucose and lipid metabolism, insulin resistance and intestinal microorganism.
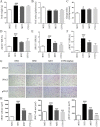
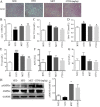
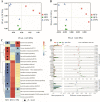
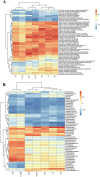
Results: In vitro data showed that CTPG significantly decreased the triglyceride (TG) and non-esterified fatty acid (NEFA) contents of the differentiated 3T3-L1 adipocytes in a concentration-dependent manner without cytotoxicity, and high concentration (100 µg/ml) of CTPG treatment dramatically suppressed the level of monocyte chemoattractant protein-1 (MCP-1) in 3T3-L1 mature adipocytes. Meanwhile, CTPG increased glucose consumption and decreased NEFA level in insulin resistant 3T3-L1 cells. We further found that CTPG protected mice from the development of obesity by inhibiting the expansion of adipose tissue and adipocyte hypertrophy, and improved hepatic steatosis by activating AMPKα to reduce hepatic fat accumulation. CTPG ameliorated HFD-induced hyperinsulinemia, hyperglycemia, inflammation and insulin resistance by activating IRS1/Akt/GLUT4 insulin signaling pathway in white adipose tissue. Moreover, gut microbiota structure and metabolic functions in HFD-induced obese mice was changed by CTPG, especially short chain fatty acids-producing bacteria including Blautia, Roseburia, Butyrivibrio and Bacteriodes were significantly increased by CTPG treatment.
Conclusions: CTPG effectively suppressed adipogenesis and lipid accumulation in 3T3-L1 adipocytes and ameliorated HFD-induced obesity and insulin resistance through activating AMPKα and IRS1/AKT/GLUT4 signaling pathway and regulating the composition and metabolic functions of gut microbiota.
Keywords: Adipocyte; Cistanche tubulosa phenylethanoid glycosides; Gut microbiota; Insulin resistance; Obesity.
© 2022. The Author(s).
Conflict of interest statement
The authors declare no conflict of interest.
Figures


Similar articles
-
Blueberry peel extracts inhibit adipogenesis in 3T3-L1 cells and reduce high-fat diet-induced obesity.PLoS One. 2013 Jul 25;8(7):e69925. doi: 10.1371/journal.pone.0069925. Print 2013. PLoS One. 2013. PMID: 23936120 Free PMC article.
-
Annual Wormwood Leaf Inhibits the Adipogenesis of 3T3-L1 and Obesity in High-Fat Diet-Induced Obese Rats.Nutrients. 2017 May 28;9(6):554. doi: 10.3390/nu9060554. Nutrients. 2017. PMID: 28555033 Free PMC article.
-
Fargesin improves lipid and glucose metabolism in 3T3-L1 adipocytes and high-fat diet-induced obese mice.Biofactors. 2012 Jul-Aug;38(4):300-8. doi: 10.1002/biof.1022. Epub 2012 Jun 2. Biofactors. 2012. PMID: 22674784
-
The anti-obesity effects of resveratrol on the 3T3-L1 adipocytes.Int J Vitam Nutr Res. 2024 Jun;94(3-4):252-263. doi: 10.1024/0300-9831/a000784. Epub 2023 May 30. Int J Vitam Nutr Res. 2024. PMID: 37248954 Review.
-
Metabolic Insights into Caffeine's Anti-Adipogenic Effects: An Exploration through Intestinal Microbiota Modulation in Obesity.Int J Mol Sci. 2024 Feb 2;25(3):1803. doi: 10.3390/ijms25031803. Int J Mol Sci. 2024. PMID: 38339081 Free PMC article. Review.
Cited by
-
β-Elemene inhibits adipogenesis in 3T3-L1 cells by regulating AMPK pathway.J Clin Biochem Nutr. 2025 Mar;76(2):125-130. doi: 10.3164/jcbn.24-179. Epub 2024 Dec 24. J Clin Biochem Nutr. 2025. PMID: 40151406 Free PMC article.
-
Variations in the Relative Abundance of Gut Bacteria Correlate with Lipid Profiles in Healthy Adults.Microorganisms. 2023 Oct 28;11(11):2656. doi: 10.3390/microorganisms11112656. Microorganisms. 2023. PMID: 38004667 Free PMC article.
-
A Novel Approach to Serving Plant-Based Confectionery-The Employment of Spray Drying in the Production of Carboxymethyl Cellulose-Based Delivery Systems Enriched with Teucrium montanum L. Extract.Foods. 2024 Jan 23;13(3):372. doi: 10.3390/foods13030372. Foods. 2024. PMID: 38338507 Free PMC article.
References
MeSH terms
Substances
Grants and funding
LinkOut - more resources
Full Text Sources
Medical
Research Materials
Miscellaneous

