

Classification accuracy of blood-based and neurophysiological markers in the differential diagnosis of Alzheimer's disease and frontotemporal lobar degeneration
- PMID: 36229847
- PMCID: PMC9558959
- DOI: 10.1186/s13195-022-01094-5
Classification accuracy of blood-based and neurophysiological markers in the differential diagnosis of Alzheimer's disease and frontotemporal lobar degeneration
Abstract
Background: In the last decade, non-invasive blood-based and neurophysiological biomarkers have shown great potential for the discrimination of several neurodegenerative disorders. However, in the clinical workup of patients with cognitive impairment, it will be highly unlikely that any biomarker will achieve the highest potential predictive accuracy on its own, owing to the multifactorial nature of Alzheimer's disease (AD) and frontotemporal lobar degeneration (FTLD).
Methods: In this retrospective study, performed on 202 participants, we analysed plasma neurofilament light (NfL), glial fibrillary acidic protein (GFAP), and tau phosphorylated at amino acid 181 (p-Tau181) concentrations, as well as amyloid β42 to 40 ratio (Aβ1-42/1-40) ratio, using the ultrasensitive single-molecule array (Simoa) technique, and neurophysiological measures obtained by transcranial magnetic stimulation (TMS), including short-interval intracortical inhibition (SICI), intracortical facilitation (ICF), long-interval intracortical inhibition (LICI), and short-latency afferent inhibition (SAI). We assessed the diagnostic accuracy of combinations of both plasma and neurophysiological biomarkers in the differential diagnosis between healthy ageing, AD, and FTLD.
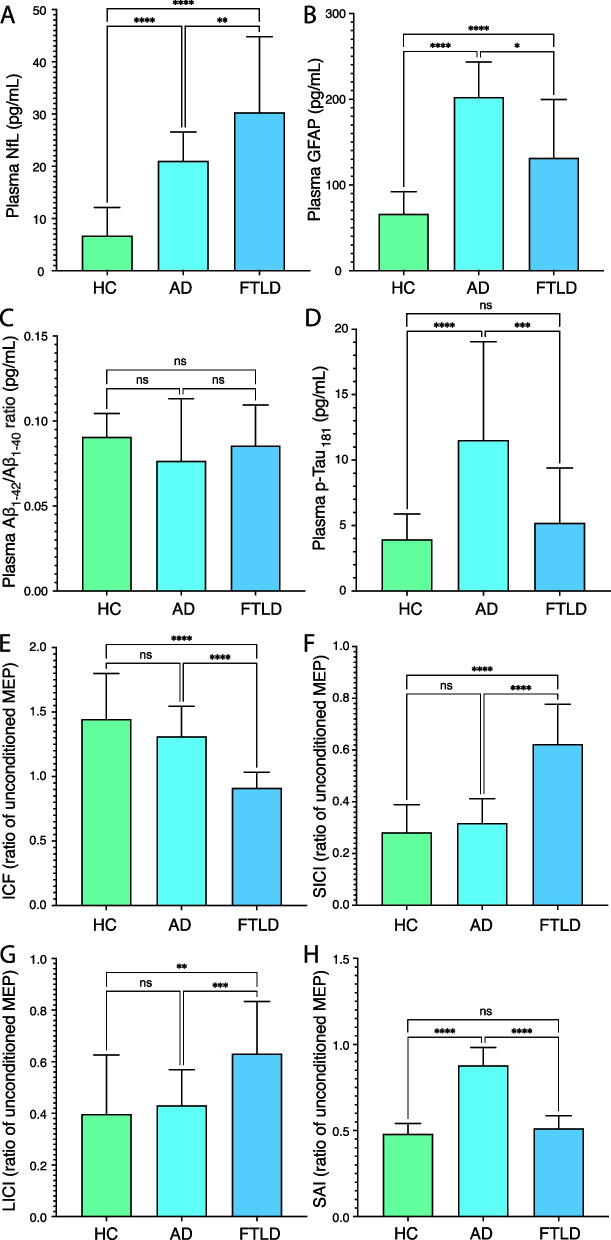
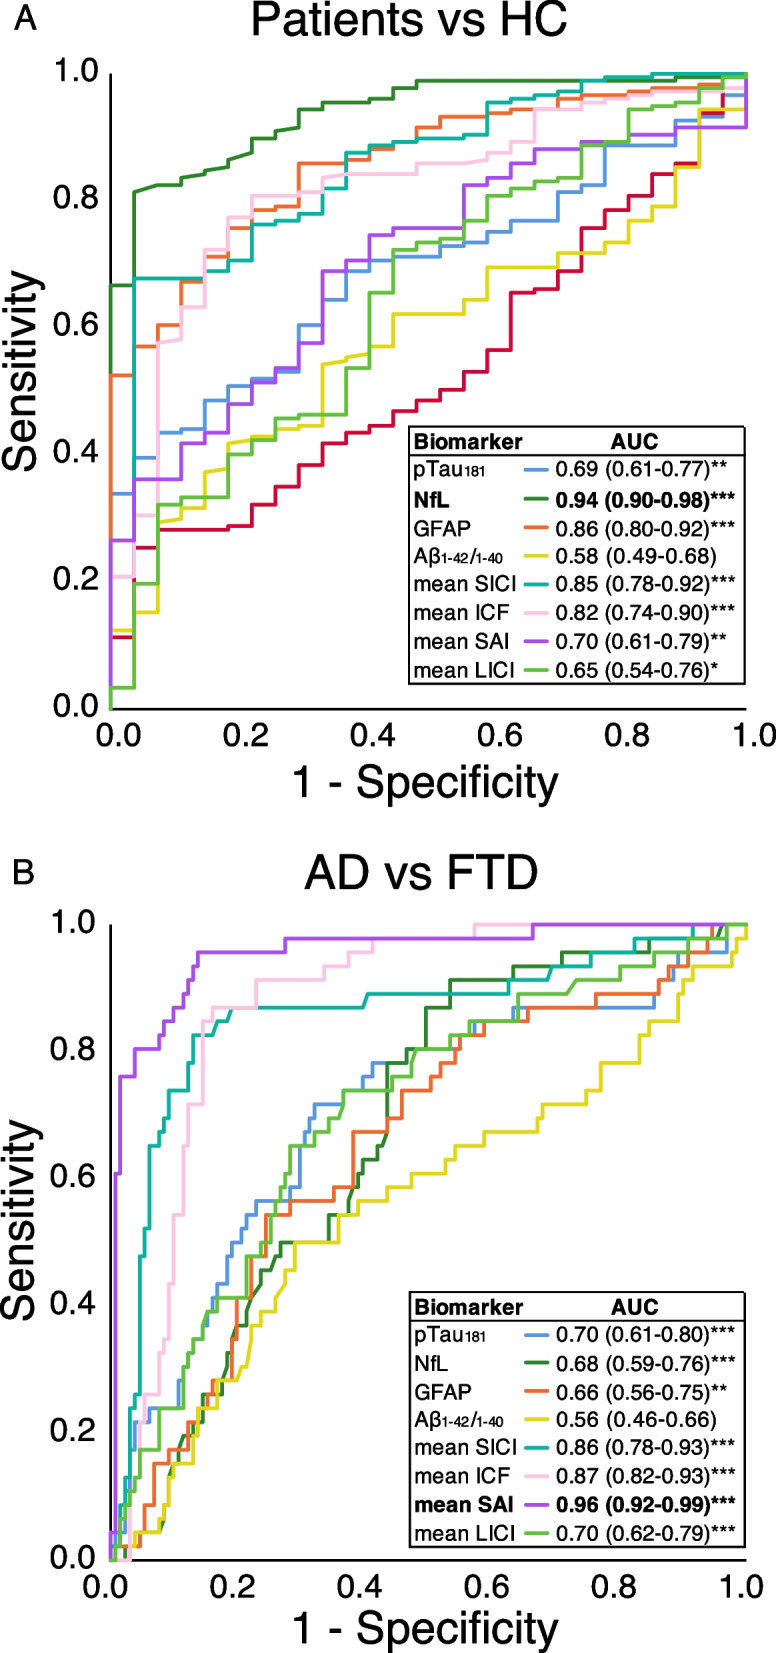
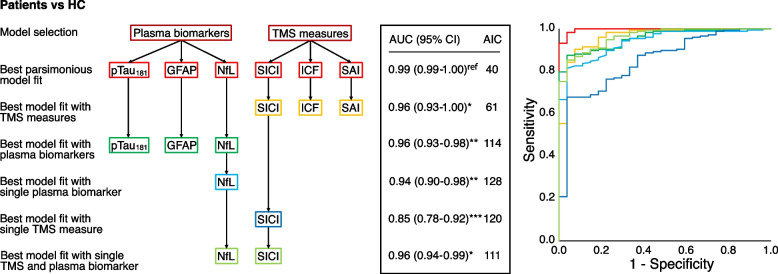
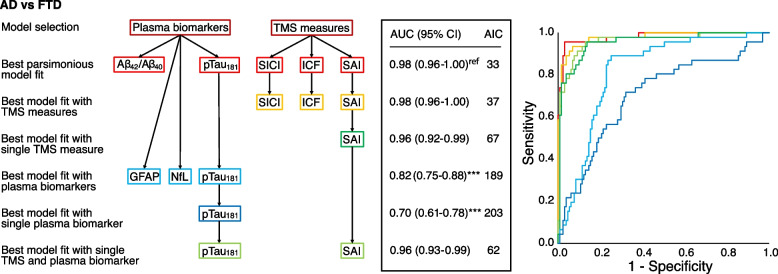
Results: We observed significant differences in plasma NfL, GFAP, and p-Tau181 levels between the groups, but not for the Aβ1-42/Aβ1-40 ratio. For the evaluation of diagnostic accuracy, we adopted a two-step process which reflects the clinical judgement on clinical grounds. In the first step, the best single biomarker to classify "cases" vs "controls" was NfL (AUC 0.94, p < 0.001), whilst in the second step, the best single biomarker to classify AD vs FTLD was SAI (AUC 0.96, p < 0.001). The combination of multiple biomarkers significantly increased diagnostic accuracy. The best model for classifying "cases" vs "controls" included the predictors p-Tau181, GFAP, NfL, SICI, ICF, and SAI, resulting in an AUC of 0.99 (p < 0.001). For the second step, classifying AD from FTD, the best model included the combination of Aβ1-42/Aβ1-40 ratio, p-Tau181, SICI, ICF, and SAI, resulting in an AUC of 0.98 (p < 0.001).
Conclusions: The combined assessment of plasma and neurophysiological measures may greatly improve the differential diagnosis of AD and FTLD.
Keywords: Alzheimer’s disease; Amyloid; Biomarkers; Frontotemporal dementia; GFAP; Neurofilament light; Serum; Transcranial magnetic stimulation; p-tau.
© 2022. The Author(s).
Conflict of interest statement
HZ has served at scientific advisory boards and/or as a consultant for Abbvie, Alector, Annexon, Artery Therapeutics, AZTherapies, CogRx, Denali, Eisai, Nervgen, Novo Nordisk, Pinteon Therapeutics, Red Abbey Labs, Passage Bio, Roche, Samumed, Siemens Healthineers, Triplet Therapeutics, and Wave; has given lectures in symposia sponsored by Cellectricon, Fujirebio, Alzecure, Biogen, and Roche; and is a co-founder of Brain Biomarker Solutions in Gothenburg AB (BBS), which is a part of the GU Ventures Incubator Program (outside submitted work). KB has served as a consultant at advisory boards or at data monitoring committees for Abcam, Axon, BioArctic, Biogen, JOMDD/Shimadzu. Julius Clinical, Lilly, MagQu, Novartis, Roche Diagnostics, and Siemens Healthineers and is a co-founder of Brain Biomarker Solutions in Gothenburg AB (BBS), which is a part of the GU Ventures Incubator Program. BB has served at scientific boards for Denali, Wave, Alector, and Aviadobio.
Figures
References
-
- Nichols E, Vos T. The estimation of the global prevalence of dementia from 1990–2019 and forecasted prevalence through 2050: an analysis for the Global Burden of Disease (GBD) study 2019. Alzheimer’s Assoc Int Conf. The Author(s). Published by Elsevier Ltd. This is an Open Access article under the CC BY 4.0 license; 2021;2667:1–21. Available from: https://alz.confex.com/alz/2021/meetingapp.cgi/Paper/51496
-
- Frisoni GB, Boccardi M, Barkhof F, Blennow K, Cappa S, Chiotis K, et al. Strategic roadmap for an early diagnosis of Alzheimer’s disease based on biomarkers. Lancet Neurol. Elsevier Ltd; 2017;16:661–76. Available from: http://linkinghub.elsevier.com/retrieve/pii/S147444221730159X - PubMed
-
- The Ronald and Nancy Reagan Research Institute of the Alzheimer’s Association and National Institute on Aging Working Group. Consensus report of the working group on: “Molecular and biochemical markers of Alzheimer’s disease.” Neurobiol Aging. Elsevier; 1998;19:109–16. Available from: https://www.sciencedirect.com/science/article/pii/S0197458098000220?via%... cited 2019 Apr 30 - PubMed
-
- Palmqvist S, Tideman P, Cullen N, Zetterberg H, Blennow K, Dage JL, et al. Prediction of future Alzheimer’s disease dementia using plasma phospho-tau combined with other accessible measures. Nat Med. Springer US; 2021;27. Available from: 10.1038/s41591-021-01348-z - PubMed
Publication types
MeSH terms
Substances
Grants and funding
LinkOut - more resources
Full Text Sources
Medical
Miscellaneous
