. 2022 Oct 13;14(1):119.
doi: 10.1186/s13073-022-01118-7.

Mendelian gene identification through mouse embryo viability screening

Collaborators, Affiliations

Mendelian gene identification through mouse embryo viability screening

Pilar Cacheiro et al. Genome Med. .

Abstract

Background: The diagnostic rate of Mendelian disorders in sequencing studies continues to increase, along with the pace of novel disease gene discovery. However, variant interpretation in novel genes not currently associated with disease is particularly challenging and strategies combining gene functional evidence with approaches that evaluate the phenotypic similarities between patients and model organisms have proven successful. A full spectrum of intolerance to loss-of-function variation has been previously described, providing evidence that gene essentiality should not be considered as a simple and fixed binary property.

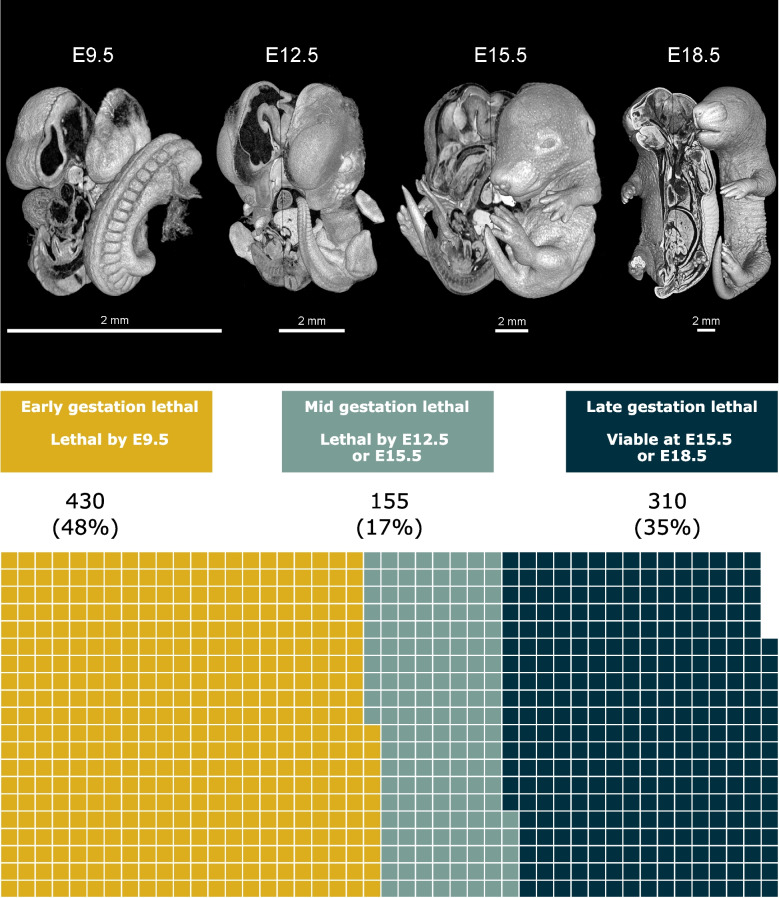
Methods: Here we further dissected this spectrum by assessing the embryonic stage at which homozygous loss-of-function results in lethality in mice from the International Mouse Phenotyping Consortium, classifying the set of lethal genes into one of three windows of lethality: early, mid, or late gestation lethal. We studied the correlation between these windows of lethality and various gene features including expression across development, paralogy and constraint metrics together with human disease phenotypes. We explored a gene similarity approach for novel gene discovery and investigated unsolved cases from the 100,000 Genomes Project.

Results: We found that genes in the early gestation lethal category have distinct characteristics and are enriched for genes linked with recessive forms of inherited metabolic disease. We identified several genes sharing multiple features with known biallelic forms of inborn errors of the metabolism and found signs of enrichment of biallelic predicted pathogenic variants among early gestation lethal genes in patients recruited under this disease category. We highlight two novel gene candidates with phenotypic overlap between the patients and the mouse knockouts.

Conclusions: Information on the developmental period at which embryonic lethality occurs in the knockout mouse may be used for novel disease gene discovery that helps to prioritise variants in unsolved rare disease cases.


Conflict of interest statement

The authors declare that they have no competing interests.

Figures

Fig. 1
Fig. 1
Description of WoL and distribution of lethal genes across these windows. Three-dimensional microCT images of wild-type mouse embryos corresponding to E9.5, E12.5, E15.5 and E18.5. The waffle chart shows the total number of lethal genes characterised through the secondary viability screening and their distribution by WoL. EL genes, where the embryo dies before E9.5 constitute nearly 50% of all the lethal genes in this dataset. This stage broadly correlates with the pre-organogenesis phase of embryonic development. Non-early lethal genes are divided into ML (17%) and LL (35%). The complete set of genes associated with each WoL is available in File S1 [33]. WoL, windows of lethality; E, embryonic day; EL, early gestation lethal; ML, mid gestation lethal; LL, late gestation lethal
Fig. 2
Fig. 2
WoL and gene features. a Distribution of mean CERES depletion scores. Histograms represent the probability distribution of mean CERES scores across cell lines for each WoL. b WoL and cellular essential genes. Percentage of EL, ML and LL genes considered cellular essential when a mean CERES depletion score across cell lines of −0.45 is considered as threshold. c Gene expression in brain. Boxplots show the distribution of human gene expression values for genes within each WoL across selected developmental stages for human brain. d SCoNeS scores. Boxplots show the distribution of SCoNeS scores, the predicted probability of a given gene being AR. The dashed grey line represents a threshold (SCoNeS > 0.75) used to identify genes underlying AR disorders. e LOEUF scores. Boxplots show the distribution of LOEUF scores across WoL. Low LOEUF scores indicate strong selection against predicted loss-of-function (pLoF) variation in a gene. The dashed grey line represents a threshold (LOEUF <0.35) used to identify genes that are constrained against pLoF variation. f WoL and paralogues. Barplots represent the percentage of genes with no paralogues (singletons) across WoL, with the proportion of genes with no duplicates decreasing across development stages. Tests for differences between WoL available in Additional file 1: Table S1-S3. For plots a–f, the data shown correspond to gene annotations for the human orthologues. WoL, windows of lethality; EL, early gestation lethal; ML, mid gestation lethal; LL, late gestation lethal; LOEUF, LoF observed/expected upper bound fraction; SCoNeS, supervised consensus negative selection; AR, autosomal recessive
Fig. 3
Fig. 3
WoL and human disease. a Mendelian disease genes. Barplots represent the percentage of rare disease associated genes in each WoL according to PanelApp, only ‘green’ genes with a high level of evidence for the gene-disease association were included. b Mode of inheritance. Barplots represent the percentage of Mendelian genes by associated allelic requirement across WoL, only monoallelic or biallelic genes were included. c Disease category. Mendelian genes by disease type according to PanelApp level 2 disease categories, with the bars indicating the percentage of PanelApp genes mapping each disease class for the 3 WoL. For plots ac, the dashed grey line represents the baseline percentage for the entire set of protein coding genes (19,197 genes according to HGNC, a) or PanelApp ‘green’ genes (3384 genes, b, c). d Disease categories OR and BH adjusted P values for EL genes compared to ANEL genes: this included mid and late gestation lethal genes as well as subviable and viable categories. e Disease category overlap. Overlap between genes associated with the most frequent disease categories across WoL for EL, ML and LL genes respectively. Tests for differences between WoL are available in Additional file 1: Table S4. WoL, windows of lethality; EL, early gestation lethal; ML, mid gestation lethal; LL, late gestation lethal; HGNC, HUGO Gene Nomenclature Committee; ANEL, all non-early gestation lethal genes; OR, odds ratio; BH, Benjamini-Hochberg
Fig. 4
Fig. 4
Gene similarity approach. a Genes sharing features with BIEM genes for each category of EL genes based on evidence for the gene-disease association. Each set of EL genes in the mouse (assessed and predicted) is broken down into 3 sub-categories based on PanelApp evidence: genes associated with inborn errors of the metabolism, Mendelian disease genes in other disease categories and non-disease genes. For genes in PanelApp panels, the genes are also subdivided into those with strong evidence for the gene-disease association (green) and those with more limited evidence to date (red or amber). The percentage of genes sharing one of the 5 features (paralogue, protein family, ppi, pathway, protein complex) with known BIEM genes is shown for potential novel genes absent from PanelApp as well as those with more limited evidence (red or amber). For each sub-category, those genes sharing ≥4 features with known BIEM genes are shown. Nine assessed and 5 predicted EL genes that are included in this figure as amber/red genes in the IEM panel are also green genes in other disease panels (see Files S3-S4 [33]). b PRMT1 IMPC mouse evidence. Mouse phenotypes and phenotypic similarity with human disorders. Heterozygous knockout phenotypes include several metabolic and neurological abnormalities. When computing the similarity between the mouse and human disease phenotypes associated with known disorders, we find phenotypic overlap with several early onset conditions, including defects of the metabolism coenzyme Q10 deficiency, primary, 8 and hypoxanthine guanine phosphoribosyltransferase partial deficiency. EL, early gestation lethal; BIEM, biallelic inborn errors of the metabolism; ppi, protein-protein interaction; IMPC, International Mouse Phenotyping Consortium
Fig. 5
Fig. 5
Candidate genes with biallelic inheritance involving LoF or (missense) predicted pathogenic variants in undiagnosed patients. a Mouse evidence. Genes with homozygous LoF or missense variants found in patients recruited under the ‘undiagnosed metabolic disorder’ and ‘mitochondrial disorders’ disease categories with an OE ratio > 1, observed in ≤ 2 controls and with the IMPC heterozygous knockout mouse displaying abnormal phenotypes in the relevant physiological systems, partially mimicking the phenotypes observed in patients. b COQ3 and CDK12 belong to families and pathways with several genes associated with Mendelian disorders. The corresponding mode of inheritance and related/overlapping phenotypes for these known disease associated genes and evidence on viability from the IMPC are shown. Information on prioritised genes available in File S4 [33]. LoF, loss-of-function; OE, observed vs expected; IMPC, International Mouse Phenotyping Consortium; AD, autosomal dominant; AR, autosomal recessive

References

    1. Fung JLF, et al. A three-year follow-up study evaluating clinical utility of exome sequencing and diagnostic potential of reanalysis. NPJ Genom Med. 2020;5:37. doi: 10.1038/s41525-020-00144-x. - DOI - PMC - PubMed
    1. Posey JE. Genome sequencing and implications for rare disorders. Orphanet J Rare Dis. 2019;14:153. doi: 10.1186/s13023-019-1127-0. - DOI - PMC - PubMed
    1. Seaby EG, Rehm HL, O'Donnell-Luria A. Strategies to uplift novel Mendelian gene discovery for improved clinical outcomes. Front Genet. 2021;12:674295. doi: 10.3389/fgene.2021.674295. - DOI - PMC - PubMed
    1. Chong JX, et al. The genetic basis of Mendelian phenotypes: discoveries, challenges, and opportunities. Am J Hum Genet. 2015;97:199–215. doi: 10.1016/j.ajhg.2015.06.009. - DOI - PMC - PubMed
    1. Seaby EG, Ennis S. Challenges in the diagnosis and discovery of rare genetic disorders using contemporary sequencing technologies. Brief Funct Genomics. 2020;19:243–258. doi: 10.1093/bfgp/elaa009. - DOI - PubMed

Publication types