. 2022 Oct 5;14(19):4864.
doi: 10.3390/cancers14194864.

Novel Insights into Redox-Based Mechanisms for Auranofin-Induced Rapid Cancer Cell Death

Affiliations

Novel Insights into Redox-Based Mechanisms for Auranofin-Induced Rapid Cancer Cell Death

Elie Hatem et al. Cancers (Basel). .

Abstract

Auranofin (Ridaura®, AUF) is a gold complex originally approved as an antirheumatic agent that has emerged as a potential candidate for multiple repurposed therapies. The best-studied anticancer mechanism of AUF is the inhibition of thioredoxin reductase (TrxR). However, a number of reports indicate a more complex and multifaceted mode of action for AUF that could be cancer cell type- and dose-dependent. In this study, we observed that AUF displayed variable cytotoxicity in five triple-negative breast cancer cell lines. Using representative MDA-MB-231 cells treated with moderate and cytotoxic doses of AUF, we evidenced that an AUF-mediated TrxR inhibition alone may not be sufficient to induce cell death. Cytotoxic doses of AUF elicited rapid and drastic intracellular oxidative stress affecting the mitochondria, cytoplasm and nucleus. A "redoxome" proteomics investigation revealed that a short treatment with a cytotoxic dose AUF altered the redox state of a number of cysteines-containing proteins, pointing out that the cell proliferation/cell division/cell cycle and cell-cell adhesion/cytoskeleton structure were the mostly affected pathways. Experimentally, AUF treatment triggered a dose-dependent S-phase arrest and a rapid disintegration of the actin cytoskeleton structure. Our study shows a new spectrum of AUF-induced early effects and should provide novel insights into the complex redox-based mechanisms of this promising anticancer molecule.

Keywords: auranofin; cancer; oxidative stress; redox regulation.


Conflict of interest statement

The authors declare no conflict of interest.

Figures
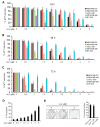
Figure 1
Figure 1
Cytotoxicity following AUF treatments. (AC) Five TNBC cell lines were treated with AUF at indicated concentrations for 24 h (A), 48 h (B) and 72 h (C), and cytotoxicity was measured with the MTT assay. Bar graphs show the mean ± SD of at least three independent experiments. The percentage of MTT reduction was calculated relative to AUF non-treated cells (set as 100%). (D) MDA-MB-231 cells were treated with AUF at indicated concentrations for 24 h and stained with PI before proceeding to the cytometric analysis. Bar graphs show mean ± SD of at least three independent experiments. (E) Colony formation of MDA-MB-231 cells following treatment with AUF 1 μM and 6 μM for 24 h. The percentage of surviving fraction was calculated relative to non-treated cells.
Figure 2
Figure 2
Inhibition of TrxR activity following AUF treatments. (A) Total TrxR activity of the cells with indicated treatments was measured, and one out of three independent experiments is presented. The time course of DTNB reduction was monitored at 412 nm over 20 min. OD at 412 nm of the first reading for each sample is set to be 0. (B) MDA-MB-231 cells were treated with 6 µM AUF alone or were pre-treated with 2 mM NAC for 1 h before adding 6 µM AUF. Cytotoxicity was measured with the MTT assay (left panel) and PI assay (right panel). Bar graphs show means ± SD of three independent experiments.
Figure 3
Figure 3
AUF-induced intracellular oxidative stress. (A) Redox state of PRDX3 was assessed using redox Western blot in non-treated (NT) and cells treated with indicated concentrations of AUF for 30 min. Treatment with 100 μM H2O2 for 30 min was used as a positive control. ox, oxidized form; red, reduced form. A representative image is presented. Graphs show the quantification of oxidized (%) versus total PRDX3 protein. Bar graphs show mean ± SD of three independent experiments. (B) Redox state of cyto- and nuc-HyPer sensors in MDA-MB-231 cells treated with 6 μM AUF for indicated time. Treatment with 100 µM H2O2 for 30 min was used as a positive control. Graphs show the quantification of oxidized (%) versus total HyPer protein. ox, oxidized form; red, reduced form. All bar graphs show mean ± SD of three independent experiments. (C) Representative confocal live cell images of a MDA-MB-231 cell expressing cyto-HyPer. AUF (6 μM) was added between the first and second frames shown and time of treatment is indicated. Stacks of images were taken with excitation at 405 and 491 nm, respectively. Maximum projections of these stacks were used for the calculation of the ratio images. The color scale for the ratio values indicates maximal reduced HyPer in blue and maximal oxidized HyPer in yellow. Scale bar = 10 µm. Original blots/gels can be found at supplementary figures.
Figure 4
Figure 4
Analysis of the 161 proteins which exhibited an increased or decreased oxidation over 1.5-fold with a p value < 0.05 following 6 µM AUF treatment for 30 min compared with the basal redoxome of non-treated cells using the PANTHER classification system. These proteins were classified in terms of their Molecular function (A), Biological process (B) and Protein class (C).
Figure 5
Figure 5
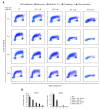
Effect of AUF on BrdU incorporation and on intracellular dTTP and dGTP levels. (A) MDA-MB-231 cells, non-treated (NT) or treated with 1, 2, 3, or 6 µM AUF for 1 h, were released in fresh medium. At 4 time points of post-treatment recovery (0, 2, 6, 24 h), these cells were labeled with BrdU for 1 h followed by PI staining and flow cytometry analysis. Representative graphs of three experiments are shown. (B) Intracellular dTTP and dGTP in MDA-MB-231 cells treated under indicated conditions. Bar graphs show mean ± SD of two independent experiments.
Figure 6
Figure 6
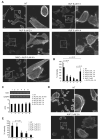
Effect of AUF on actin cytoskeleton structure. (A) Non-treated (NT) and 6 µM AUF-treated MDA-MB-231 cells were stained with rhodamine–phalloidin to visualize the actin cytoskeleton. Z-stack images were obtained using a Leica SP8 upright confocal microscope and merged using ImageJ software. Representative images of NT and cells treated for 1, 2, and 4 h alone or in the presence of 2 mM NAC (4 h) are presented. Adjustments were applied only in the zoom images of cell treated by AUF for 4 h to better visualize actin cytoskeleton modifications. Scale bars = 10 µm. (B) Change in F-actin staining intensity was measured as a percentage of NT control (set as 100%). Data points represent the measurement of at least 30 cells with the same image acquisition conditions. (C) Immunoblot of actin of MDA-MB-231 cells treated with indicated conditions. GADPH was used as a loading control. Protein levels quantified using ImageJ are expressed as fold change over NT control (set as 1). Original blots/gels can be found at supplementary files. (D) MDA-MB-231 cells, NT or treated with 1, 2, 3 and 6 μM AUF for 3 h, were stained with rhodamine–phalloidin to visualize the actin cytoskeleton. Images were obtained as (A). Representative images of NT and 2 μM AUF-treated cells are presented. (E) Change in F-actin staining intensity of the experiment described in (D) was measured and analyzed as in (B).

References

    1. Gorrini C., Harris I.S., Mak T.W. Modulation of oxidative stress as an anticancer strategy. Nat. Rev. Drug Discov. 2013;12:931–947. doi: 10.1038/nrd4002. - DOI - PubMed
    1. Hatem E., El Banna N., Huang M.E. Multifaceted Roles of Glutathione and Glutathione-Based Systems in Carcinogenesis and Anticancer Drug Resistance. Antioxid. Redox Signal. 2017;27:1217–1234. doi: 10.1089/ars.2017.7134. - DOI - PubMed
    1. Kean W.F., Kean I.R. Clinical pharmacology of gold. Inflammopharmacology. 2008;16:112–125. doi: 10.1007/s10787-007-0021-x. - DOI - PubMed
    1. Roder C., Thomson M.J. Auranofin: Repurposing an old drug for a golden new age. Drugs R D. 2015;15:13–20. doi: 10.1007/s40268-015-0083-y. - DOI - PMC - PubMed
    1. Madeira J.M., Gibson D.L., Kean W.F., Klegeris A. The biological activity of auranofin: Implications for novel treatment of diseases. Inflammopharmacology. 2012;20:297–306. doi: 10.1007/s10787-012-0149-1. - DOI - PubMed

LinkOut - more resources