. 2022 Oct 7;14(19):4918.
doi: 10.3390/cancers14194918.

Inhibition of Mitochondrial Redox Signaling with MitoQ Prevents Metastasis of Human Pancreatic Cancer in Mice

Affiliations

Inhibition of Mitochondrial Redox Signaling with MitoQ Prevents Metastasis of Human Pancreatic Cancer in Mice

Tania Capeloa et al. Cancers (Basel). .

Abstract

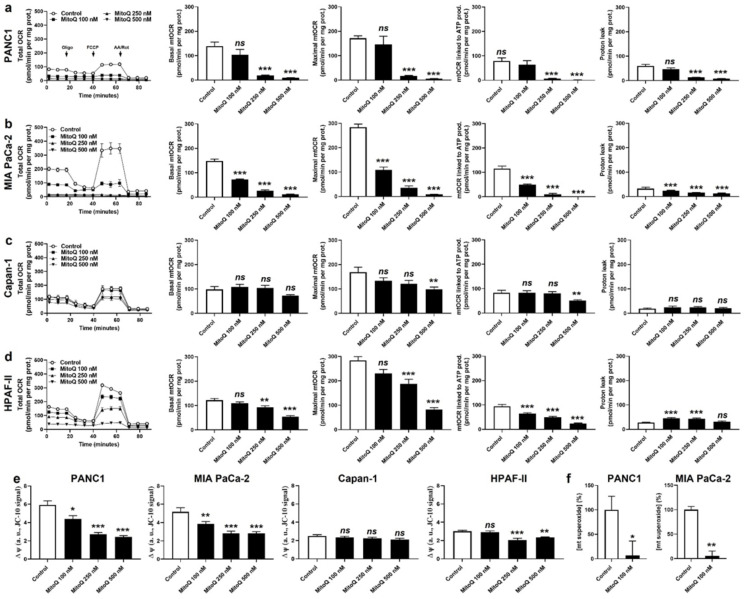
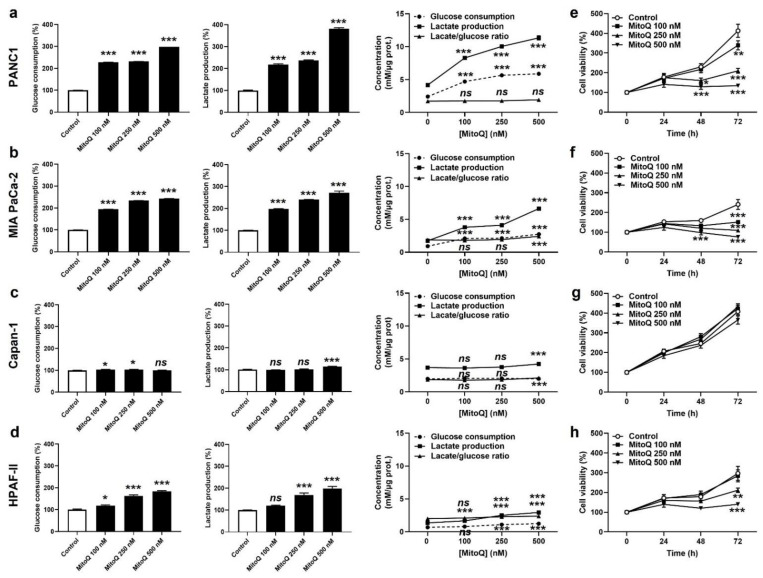
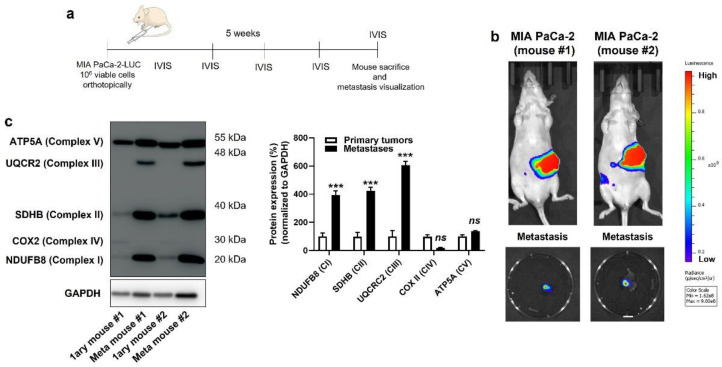
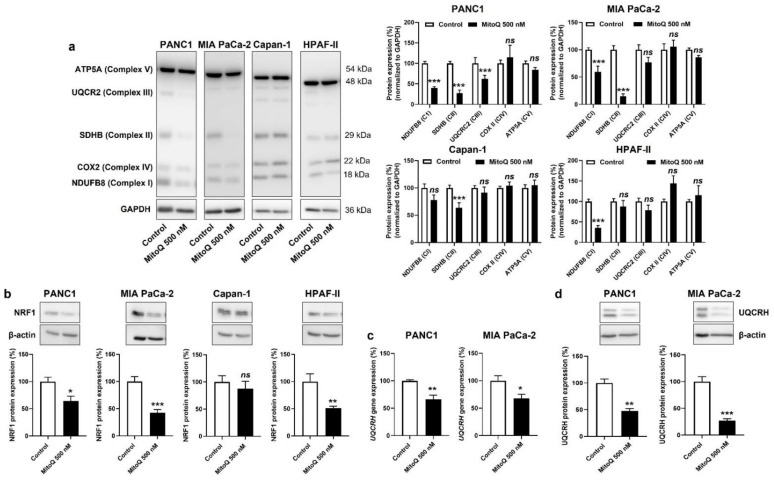
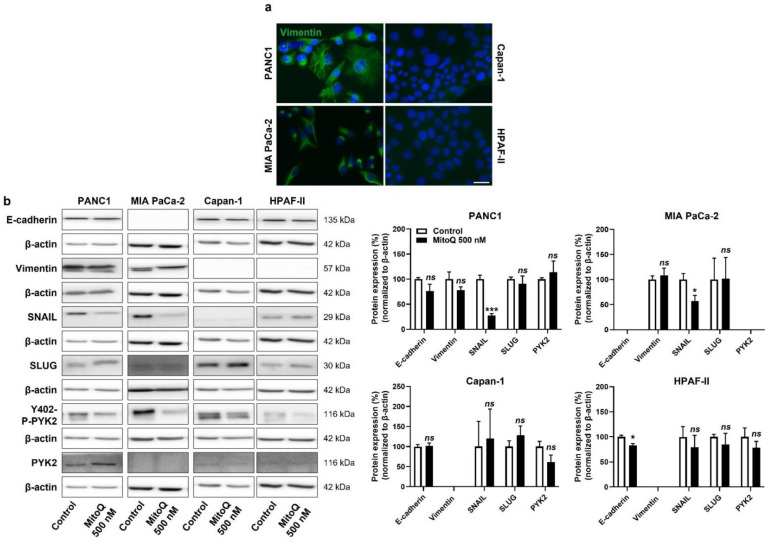
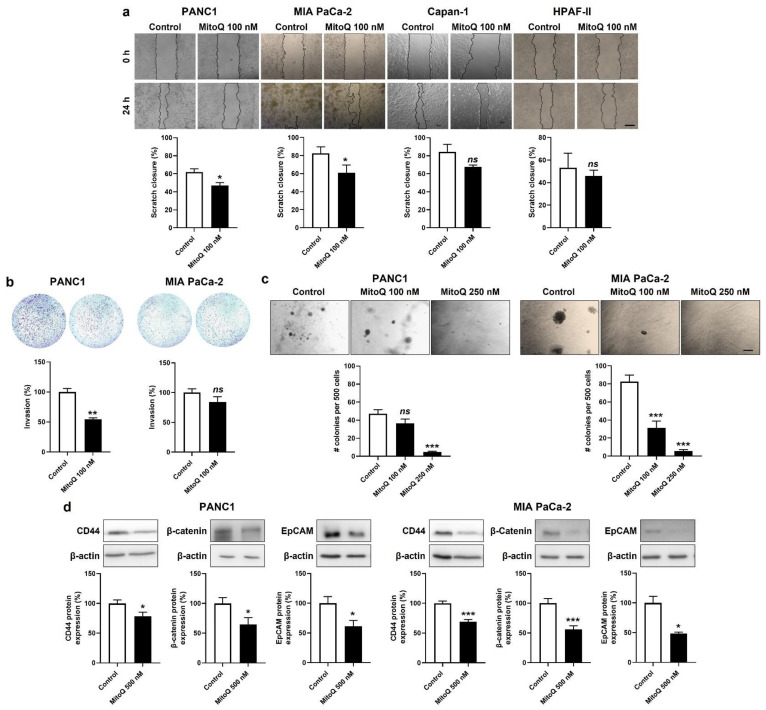
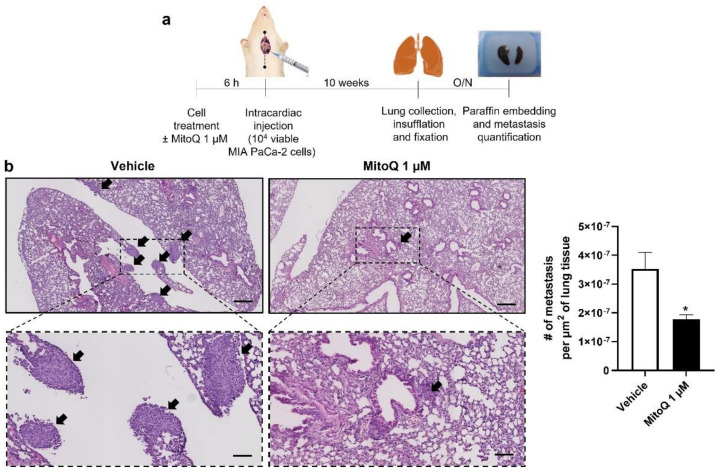
At diagnosis, about 35% of pancreatic cancers are at the locally invasive yet premetastatic stage. Surgical resection is not a treatment option, leaving patients with a largely incurable disease that often evolves to the polymetastatic stage despite chemotherapeutic interventions. In this preclinical study, we hypothesized that pancreatic cancer metastasis can be prevented by inhibiting mitochondrial redox signaling with MitoQ, a mitochondria-targeted antioxidant. Using four different cancer cell lines, we report that, at clinically relevant concentrations (100-500 nM), MitoQ selectively repressed mesenchymal pancreatic cancer cell respiration, which involved the inhibition of the expression of PGC-1α, NRF1 and a reduced expression of electron-transfer-chain complexes I to III. MitoQ consequently decreased the mitochondrial membrane potential and mitochondrial superoxide production by these cells. Phenotypically, MitoQ further inhibited pancreatic cancer cell migration, invasion, clonogenicity and the expression of stem cell markers. It reduced by ~50% the metastatic homing of human MIA PaCa-2 cells in the lungs of mice. We further show that combination treatments with chemotherapy are conceivable. Collectively, this study indicates that the inhibition of mitochondrial redox signaling is a possible therapeutic option to inhibit the metastatic progression of pancreatic cancer.

Keywords: MitoQ; cancer metabolism; cancer metastasis; mitochondria; pancreatic ductal adenocarcinoma (PDAC); reactive oxygen species (ROS); redox signaling.


Conflict of interest statement

T.C. and P.S. are inventors of patent application EP21175397.5 “Molecular signature for assessing the responsiveness of cancer to mitochondria-targeted antioxidants”. P.S., F.D. and F.P.D. are involved in a clinical collaboration with Antipodean Pharmaceuticals Inc. for the prevention of breast cancer metastasis. M.P.M. consults for MitoQ Inc. and holds patents in mitochondria-targeted therapies. Authors declare no other conflict of interest. In particular, Antipodean Pharmaceuticals Inc. and MitoQ Inc., who possess patent rights on the MitoQ molecule, did not fund the study. Neither them nor the funders were involved in the design of the study; in the collection, analyses, or interpretation of data; in the writing of the manuscript, or in the decision to publish the results.

Figures

Figure 1
Figure 1
MitoQ represses mitochondrial respiration in human pancreatic cancer cells. (af) Cells were treated ± MitoQ for 48 h. (a) The oxygen consumption rate (OCR) of PANC1 cells was measured using Seahorse oximetry. The graph represents total OCR measurements over time with the sequential addition of oligomycin, FCCP, and rotenone (Rot) together with antimycin A (AA). From Seahorse traces, basal, maximal and ATP-linked mitochondrial OCRs (mtOCRs) and proton leak were calculated (n = 11–12). (b) Seahorse oximetry as in (a), but using MIA PaCa-2 cells (n =15–18). (c) Seahorse oximetry as in (a) but using Capan-1 cells (n = 9–12). (d) Seahorse oximetry as in (a), but using HPAF-II cells (n = 15–18). (e) The mitochondrial potential (∆ψ) was measured using JC-10 in PANC1, MIA PaCa-2, Capan-1 and HPAF-II cells (n = 12–18). (f) Mitochondrial superoxide (mtO2●−) levels were measured using electron paramagnetic resonance (EPR) with MitoTEMPO-H as a selective mtO2●− sensor ± PEG-SOD2 in PANC1 (left; n = 9) and MIA PaCa-2 (right; n = 3) cells treated ± MitoQ 100 nM. All data are shown as means ± SEM. * p < 0.05, ** p < 0.01, *** p < 0.005, ns: p > 0.05, compared to control; by one-way ANOVA followed by Dunnett’s post hoc test (ae) or Student’s t-test (f).
Figure 2
Figure 2
MitoQ is cytostatic for human pancreatic cancer cells. (a) PANC1 cells were treated ± MitoQ for 48 h. Glucose consumption (left), lactate production (middle) and the lactate/glucose ratio (right) were then determined using enzymatic assays on a CMA600 enzymatic analyzer (n = 3). (b) Enzymatic measurements of glucose consumption and lactate release as in (a), but using MIA PaCa-2 cells (n = 3). (c) Enzymatic measurements of glucose consumption and lactate release as in (a), but using Capan-1 cells (n = 3). (d) Enzymatic measurements of glucose consumption and lactate release as in (a), but using HPAF-II cells (n = 3). (e) PANC1 cell viability was determined using crystal violet staining (n = 12). (f) MIA PaCa-2 cell viability was determined as in (e) (n = 12). (g) Capan-1 cell viability was determined as in (e) (n = 11–12). (h) HPAF-II cell viability was determined as in (e) (n = 12). All data are shown as means ± SEM. * p < 0.05, ** p < 0.01, *** p < 0.005, ns: p > 0.05, compared to control; by one-way ANOVA followed by Dunnett’s post hoc test (ad) or two-way ANOVA with Tukey’s post hoc test (eh).
Figure 3
Figure 3
Compared to their respective primary tumors, human pancreatic cancer metastases in mice have an increased expression of key components of mitochondrial electron transport chain Complexes I, II and III. (a) Experimental protocol for spontaneous metastasis in NMRI nude mice bearing orthotopic MIA PaCa-2 human pancreatic tumors. (b) On the top are representative IVIS images of two mice bearing bioluminescent pancreatic primary tumors with constitutive luciferase expression. Images on the bottom show ex vivo bioluminescence signals of peritoneal lymph node metastases from the same 2 mice (bar = 500 µm). A scale bar is provided (arbitrary units). (c) Primary tumors and lymph node metastases from 2 independent MIA PaCa-2-bearing mice were microdissected and analyzed for protein expression in whole lysates. On the left, a representative Western blot shows the expression of NUDFB8, SDHB, UQCR2, COX2 and ATP5A, key components of mitochondrial electron transport chain Complex I (CI), Complex II (CII), Complex III (CIII), Complex VI (CIV), and Complex V (CV), respectively. GAPDH expression was used as a loading control. Data are quantified in the graph on the right (n = 4 all). *** p < 0.005, ns: p > 0.05, compared to control; by Student’s t-test (c).
Figure 4
Figure 4
Inhibition of mitochondrial redox signaling by MitoQ decreases NRF1 expression and the expression of electron transport chain complexes in human pancreatic cancer cells. (ad) PANC1, MIA PaCa-2, Capan-1 and HPAF-II cells were treated ± MitoQ for 48 h. (a) On the left, representative Western blots show the expression of NUDFB8, SDHB, UQCR2, COX2 and ATP5A, key components of mitochondrial electron transport chain Complex I (CI), Complex II (CII), Complex III (CIII), Complex VI (CIV), and Complex V (CV), respectively. GAPDH expression was used as a loading control. Data are quantified in the graphs on the right (n = 6–9). (b) Representative Western blots and graphs showing NRF1 protein expression in the cancer cells (n = 7 all). β-actin expression was used as a loading control. (c) UQCRH gene expression determined using RT-qPCR in PANC1 (left; n = 5–6) and MIA PaCa-2 (right; n = 4) cells. (d) Representative Western blots and graphs show UQCRH protein expression in the cancer cells (n = 4 all). β-actin expression was used as a loading control. All data are shown as means ± SEM. * p < 0.05, ** p < 0.01, *** p < 0.005, ns: p > 0.05, compared to control; by Student’s t-test (ad).
Figure 5
Figure 5
Inhibition of mitochondrial redox signaling partially represses EMT and the expression of EMT markers in human pancreatic cancer cells. (a) Representative immunocytofluorescence pictures show vimentin (green) and cell nuclei (DAPI, blue) staining in PANC1, MIA PaCa-2, Capan-1 and HPAF-II cell lines. Bar = 20 µm. (b) Cells were treated ± 500 nM of MitoQ for 48 h. Representative Western blots show the expression of EMT markers, as well as PYK2 and Y402-phospho-PYK2 (Y402-P-PYK2) in PANC1 (n = 3–5), MIA PaCa-2 (n = 4–5), Capan-1 (n = 5) and HPAF-II (n = 5) cells, and their expression is quantified on the graphs on the right. β-actin expression was used as a loading control. * p < 0.05, *** p < 0.005, ns: p > 0.05, compared to control; by Student’s t-test (b).
Figure 6
Figure 6
Inhibition of mitochondrial redox signaling represses migration, invasion, clonogenicity and the expression of stem cell markers by mesenchymal human pancreatic cancer cells. (a,b) Cells were treated ± 500 nM of MitoQ for 48 h. (a) PANC1 (n = 5), MIA PaCa-2 (n = 6), Capan-1 (n = 3) and HPAF-II (n = 3) cancer cell migration over 24 h was determined using a scratch assay. Representative pictures are shown on top and quantification graphs on the bottom. Bar = 50 µm. (b) PANC1 (n = 3) and MIA PaCa-2 (n = 7–8) cancer cell invasion was assayed in transwells with 1% FBS as chemoattractant. Representative images are shown together with overnight invasion data. Bar = 50 µm. (c) PANC1 (n = 16) and MIA PaCa-2 (n = 16) cancer cells were treated ± MitoQ for 20 days, followed by a clonogenic assay on soft agar. Representative images are shown together with quantification graphs. Bar = 50 µm. (d) Representative Western blots and graphs show the expression of stem cell markers CD44, β-catenin and epithelial cell adhesion molecule (EpCAM) in PANC1 (n = 16) and MIA PaCa-2 (n = 16) cancer cell treated ± 500 nM of MitoQ for 48 h. β-actin expression was used as a loading control. All data are shown as means ± SEM. * p < 0.05, ** p < 0.01, *** p < 0.005, ns: p > 0.05, compared to control; by Student’s t-test (a,b,d) or one-way ANOVA followed by Dunnett’s post hoc test (c).
Figure 7
Figure 7
Inhibition of mitochondrial redox signaling by MitoQ inhibits the homing of circulating pancreatic cancer cells to mouse lungs. (a) Experimental protocol for MIA PaCa-2 metastasis to NMRI nude mouse lungs. (b) At the end of the protocol depicted in (a), mouse lungs were collected, sliced, stained with hematoxylin and eosin (H&E), and analyzed for the presence of metastases. Representative pictures are on the left at two different magnifications (bars = 400 µm for pictures on the top and 100 µm for insets), where metastases are indicated by black arrows. Quantification of the number of metastases per surface area is shown on the right (n = 4 mice in each condition). All data are shown as means ± SEM. * p < 0.05 compared to control, by Student’s t-test (b).

Similar articles

Cited by

References

    1. Siegel R.L., Miller K.D., Fuchs H.E., Jemal A. Cancer statistics, 2021. CA Cancer J. Clin. 2021;71:7–33. doi: 10.3322/caac.21654. - DOI - PubMed
    1. Rahib L., Smith B.D., Aizenberg R., Rosenzweig A.B., Fleshman J.M., Matrisian L.M. Projecting cancer incidence and deaths to 2030: The unexpected burden of thyroid, liver, and pancreas cancers in the United States. Cancer Res. 2014;74:2913–2921. doi: 10.1158/0008-5472.CAN-14-0155. - DOI - PubMed
    1. Park W., Chawla A., O’Reilly E.M. Pancreatic cancer: A review. JAMA. 2021;326:851–862. doi: 10.1001/jama.2021.13027. - DOI - PMC - PubMed
    1. Zeng S., Pottler M., Lan B., Grutzmann R., Pilarsky C., Yang H. Chemoresistance in pancreatic cancer. Int. J. Mol. Sci. 2019;20:4504. doi: 10.3390/ijms20184504. - DOI - PMC - PubMed
    1. Porporato P.E., Payen V.L., Perez-Escuredo J., De Saedeleer C.J., Danhier P., Copetti T., Dhup S., Tardy M., Vazeille T., Bouzin C., et al. A mitochondrial switch promotes tumor metastasis. Cell Rep. 2014;8:754–766. doi: 10.1016/j.celrep.2014.06.043. - DOI - PubMed

LinkOut - more resources