Hypoxia and ERα Transcriptional Crosstalk Is Associated with Endocrine Resistance in Breast Cancer
- PMID: 36230857
- PMCID: PMC9563995
- DOI: 10.3390/cancers14194934
Hypoxia and ERα Transcriptional Crosstalk Is Associated with Endocrine Resistance in Breast Cancer
Abstract
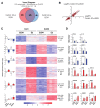
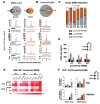
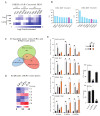
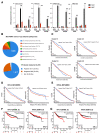
Estrogen receptor-alpha (ERα) is the driving transcription factor in 70% of breast cancers and its activity is associated with hormone dependent tumor cell proliferation and survival. Given the recurrence of hormone resistant relapses, understanding the etiological factors fueling resistance is of major clinical interest. Hypoxia, a frequent feature of the solid tumor microenvironment, has been described to promote endocrine resistance by triggering ERα down-regulation in both in vitro and in vivo models. Yet, the consequences of hypoxia on ERα genomic activity remain largely elusive. In the present study, transcriptomic analysis shows that hypoxia regulates a fraction of ERα target genes, underlying an important regulatory overlap between hypoxic and estrogenic signaling. This gene expression reprogramming is associated with a massive reorganization of ERα cistrome, highlighted by a massive loss of ERα binding sites. Profiling of enhancer acetylation revealed a hormone independent enhancer activation at the vicinity of genes harboring hypoxia inducible factor (HIFα) binding sites, the major transcription factors governing hypoxic adaptation. This activation counterbalances the loss of ERα and sustains hormone-independent gene expression. We describe hypoxia in luminal ERα (+) breast cancer as a key factor interfering with endocrine therapies, associated with poor clinical prognosis in breast cancer patients.
Keywords: breast cancer; endocrine resistance; estrogen receptor alpha; hypoxia.
Conflict of interest statement
The authors declare no competing interest.
Figures


Similar articles
-
Nuclear accumulation of MKL1 in luminal breast cancer cells impairs genomic activity of ERα and is associated with endocrine resistance.Biochim Biophys Acta Gene Regul Mech. 2020 May;1863(5):194507. doi: 10.1016/j.bbagrm.2020.194507. Epub 2020 Feb 27. Biochim Biophys Acta Gene Regul Mech. 2020. PMID: 32113984
-
The proteasome inhibitor Bortezomib (Velcade) as potential inhibitor of estrogen receptor-positive breast cancer.Int J Cancer. 2015 Aug 1;137(3):686-97. doi: 10.1002/ijc.29404. Epub 2015 Jan 8. Int J Cancer. 2015. PMID: 25530422
-
FGF2 induces breast cancer growth through ligand-independent activation and recruitment of ERα and PRBΔ4 isoform to MYC regulatory sequences.Int J Cancer. 2019 Oct 1;145(7):1874-1888. doi: 10.1002/ijc.32252. Epub 2019 Mar 28. Int J Cancer. 2019. PMID: 30843188
-
Estrogen Receptor on the move: Cistromic plasticity and its implications in breast cancer.Mol Aspects Med. 2021 Apr;78:100939. doi: 10.1016/j.mam.2020.100939. Epub 2020 Dec 24. Mol Aspects Med. 2021. PMID: 33358533 Review.
-
Estrogen Receptor β as a Possible Double-Edged Sword Molecule in Breast Cancer: A Mechanism of Alteration of Its Role by Exposure to Endocrine-Disrupting Chemicals.Biol Pharm Bull. 2021;44(11):1594-1597. doi: 10.1248/bpb.b21-00468. Biol Pharm Bull. 2021. PMID: 34719637 Review.
Cited by
-
Targeting EPAS-1/HIF-2α Pathway to Address Endocrine Resistance in Luminal A Type Breast Cancer.Transl Oncol. 2025 Jul;57:102415. doi: 10.1016/j.tranon.2025.102415. Epub 2025 May 19. Transl Oncol. 2025. PMID: 40393248 Free PMC article.
-
The signature of extracellular vesicles in hypoxic breast cancer and their therapeutic engineering.Cell Commun Signal. 2024 Oct 21;22(1):512. doi: 10.1186/s12964-024-01870-w. Cell Commun Signal. 2024. PMID: 39434182 Free PMC article. Review.
-
Intracranial outcomes following neurosurgical resection in patients with brain metastases secondary to HER2-positive breast cancer versus other subtypes.Breast Cancer Res Treat. 2025 Jan;209(2):303-314. doi: 10.1007/s10549-024-07493-6. Epub 2024 Oct 5. Breast Cancer Res Treat. 2025. PMID: 39367951
-
Dissecting tumor cell programs through group biology estimation in clinical single-cell transcriptomics.Nat Commun. 2025 Mar 1;16(1):2090. doi: 10.1038/s41467-025-57377-6. Nat Commun. 2025. PMID: 40025015 Free PMC article.
-
Unexpected nuclear hormone receptor and chromatin dynamics regulate estrous cycle dependent gene expression.Nucleic Acids Res. 2024 Oct 14;52(18):10897-10917. doi: 10.1093/nar/gkae714. Nucleic Acids Res. 2024. PMID: 39166489 Free PMC article.
References
-
- Arnal J.-F., Lenfant F., Metivier R., Flouriot G., Henrion D., Adlanmerini M., Fontaine C., Gourdy P., Chambon P., Katzenellenbogen B., et al. Membrane and Nuclear Estrogen Receptor Alpha Actions: From Tissue Specificity to Medical Implications. Physiol. Rev. 2017;97:1045–1087. doi: 10.1152/physrev.00024.2016. - DOI - PubMed
-
- Jeselsohn R., Yelensky R., Buchwalter G., Frampton G., Meric-Bernstam F., Gonzalez-Angulo A.M., Ferrer-Lozano J., Perez-Fidalgo J.A., Cristofanilli M., Gómez H., et al. Emergence of Constitutively Active Estrogen Receptor-α Mutations in Pretreated Advanced Estrogen Receptor-Positive Breast Cancer. Clin. Cancer Res. 2014;20:1757–1767. doi: 10.1158/1078-0432.CCR-13-2332. - DOI - PMC - PubMed
-
- Giltnane J.M., Hutchinson K.E., Stricker T.P., Formisano L., Young C.D., Estrada M.V., Nixon M.J., Du L., Sanchez V., Ericsson P.G., et al. Genomic Profiling of ER+ Breast Cancers after Short-Term Estrogen Suppression Reveals Alterations Associated with Endocrine Resistance. Sci. Transl. Med. 2017;9:eaai7993. doi: 10.1126/scitranslmed.aai7993. - DOI - PMC - PubMed
Grants and funding
LinkOut - more resources
Full Text Sources
Molecular Biology Databases

