. 2022 Oct 10;14(19):4961.
doi: 10.3390/cancers14194961.

Gene Regulatory Network Characterization of Gastric Cancer's Histological Subtypes: Distinctive Biological and Clinically Relevant Master Regulators

Affiliations

Gene Regulatory Network Characterization of Gastric Cancer's Histological Subtypes: Distinctive Biological and Clinically Relevant Master Regulators

Sabino Russi et al. Cancers (Basel). .

Abstract

Gastric cancer (GC) molecular heterogeneity represents a major determinant for clinical outcomes, and although new molecular classifications have been introduced, they are not easy to translate from bench to bedside. We explored the data from GC public databases by performing differential gene expression analysis (DEGs) and gene network reconstruction to identify master regulators (MRs), as well as a gene set analysis (GSA) to reveal their biological features. Moreover, we evaluated the association of MRs with clinicopathological parameters. According to the GSA, the Diffuse group was characterized by an epithelial-mesenchymal transition (EMT) and inflammatory response, while the Intestinal group was associated with a cell cycle and drug resistance pathways. In particular, the regulons of Diffuse MRs, such as Vgll3 and Ciita, overlapped with the EMT and interferon-gamma response, while the regulons Top2a and Foxm1 were shared with the cell cycle pathways in the Intestinal group. We also found a strict association between MR activity and several clinicopathological features, such as survival. Our approach led to the identification of genes and pathways differentially regulated in the Intestinal and Diffuse GC histotypes, highlighting biologically interesting MRs and subnetworks associated with clinical features and prognosis, suggesting putative actionable candidates.

Keywords: gastric cancer; gene expression profile; master regulator; molecular classification; prognostic biomarkers.


Conflict of interest statement

The authors declare no conflict of interest.

Figures

Figure 1
Figure 1
(A) Venn diagram showing the intersection among the genes differentially upregulated in Diffuse or Intestinal samples and in GC (tumor) samples from TGCA, STAD or normal ones from GTEx datasets, respectively. The number of genes in bold indicates distinctive Diffuse tumors and Intestinal tumors as compared with normal tissues. (B,C) Bar plot of hallmark categories enriched with upregulated genes in the Diffuse or Intestinal subtypes. N is the number of samples.
Figure 2
Figure 2
(A,B) Intestinal and Diffuse top master regulators. Each network is indicated by its MR. The genes in each network are shown in a barcode-like diagram showing all transcriptome genes from most downregulated (left) to most upregulated (right). Positively (red) and negatively (blue) correlated targets are overlaid on the differential expression signature as bars of different colors. Normalized enrichment score (NESes) and p-values are also indicated. To the right, the twelve highest-likelihood network putative targets of each MR are shown in red if upregulated or in blue if downregulated and with a pointed arrow if predicted to be activated by the centroid protein or with a blunt arrow if predicted to be repressed. (C,D) Heatmaps of the biological characterization of the top MRs in Diffuse and Intestinal subgroups. The intensity of the red color is proportional to the overlap between the genes in the regulon of the MR and the ones in the hallmark gene set.
Figure 3
Figure 3
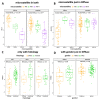
Boxplots of selected significant associated ssMRs NES and clinical features. (AC) Relationships among microsatellite, histotype and different MRs. (D) Highlight of a gender-associated MR in the Diffuse subgroup. NES on the y-axis examples is how much regulon is active. Wilcoxon test informs the association of the clinical feature with MR.
Figure 4
Figure 4
Venn diagrams showing the overlap between the TCGA and the validation dataset data. (A) The overlap of the DEGs between Diffuse vs. Intestinal subgroups in TCGA and ACRG dataset. (B) The overlap of the DEGs between Diffuse vs. Intestinal subgroups in TCGA and GSE15459 dataset. (C) The overlap of the MRs between Diffuse vs. Intestinal subgroups in TCGA and ACRG dataset. (D) The overlap of the MRs between Diffuse vs. Intestinal subgroups in TCGA and GSE15459 dataset. All overlaps in bold are statistically significant (p-vaule < 0.01).

References

    1. Sung H., Ferlay J., Siegel R.L., Laversanne M., Soerjomataram I., Jemal A., Bray F. Global cancer statistics 2020: GLOBOCAN estimates of incidence and mortality worldwide for 36 cancers in 185 countries. CA Cancer J. Clin. 2021;71:209–249. doi: 10.3322/caac.21660. - DOI - PubMed
    1. Knight W.R., Allum W.H. Gastric tumours. Medicine. 2019;47:309–313. doi: 10.1016/j.mpmed.2019.02.002. - DOI
    1. Cisło M., Filip A.A., Arnold Offerhaus G.J., Ciseł B., Rawicz-Pruszyński K., Skierucha M., Polkowski W.P. Distinct molecular subtypes of gastric cancer: From Laurén to molecular pathology. Oncotarget. 2018;9:19427–19442. doi: 10.18632/oncotarget.24827. - DOI - PMC - PubMed
    1. Lauren P. The two histological main types of gastric carcinoma: Diffuse and so-called intestinal-type carcinoma. An attempt at a histo-clinical classification. Acta Pathol. Microbiol. Scand. 1965;64:31–49. doi: 10.1111/apm.1965.64.1.31. - DOI - PubMed
    1. Fléjou J.-F. [WHO Classification of digestive tumors: The fourth edition] Ann. Pathol. 2011;31:S27–S31. doi: 10.1016/j.annpat.2011.08.001. - DOI - PubMed

LinkOut - more resources