. 2022 Sep 30;11(19):3080.
doi: 10.3390/cells11193080.

Morphology of Phagophore Precursors by Correlative Light-Electron Microscopy

Affiliations

Morphology of Phagophore Precursors by Correlative Light-Electron Microscopy

Sigurdur Runar Gudmundsson et al. Cells. .

Abstract

Autophagosome biogenesis occurs in the transient subdomains of the endoplasmic reticulum that are called omegasomes, which, in fluorescence microscopy, appear as small puncta, which then grow in diameter and finally shrink and disappear once the autophagosome is complete. Autophagosomes are formed by phagophores, which are membrane cisterns that elongate and close to form the double membrane that limits autophagosomes. Earlier electron-microscopy studies showed that, during elongation, phagophores are lined by the endoplasmic reticulum on both sides. However, the morphology of the very early phagophore precursors has not been studied at the electron-microscopy level. We used live-cell imaging of cells expressing markers of phagophore biogenesis combined with correlative light-electron microscopy, as well as electron tomography of ATG2A/B-double-deficient cells, to reveal the high-resolution morphology of phagophore precursors in three dimensions. We showed that phagophores are closed or nearly closed into autophagosomes already at the stage when the omegasome diameter is still large. We further observed that phagophore precursors emerge next to the endoplasmic reticulum as bud-like highly curved membrane cisterns with a small opening to the cytosol. The phagophore precursors then open to form more flat cisterns that elongate and curve to form the classically described crescent-shaped phagophores.

Keywords: ATG13; ATG2; DFCP1; autophagy; correlative light-electron microscopy; isolation membrane; omegasome; phagophore.


Conflict of interest statement

The authors declare no conflict of interest.

Figures

Figure 1
Figure 1
CLEM of an omegasome and a nascent phagophore/autophagosome. (A) HEK293 cells expressing GFP-tagged DFCP1 were time-lapse imaged to trace omegasomes. After fixation, the same cell and omegasome were imaged with electron tomography. (B) One slice of the tomogram overlaid with the DFCP1 fluorescence. (C) The phagophore, ER, lysosomes and mitochondria were traced to create a 3D model, using the color code shown in the top right corner of the figure. Panel (C) shows one tomography slice overlayed with part of the 3D model. (D) The 3D model shows the relationships of the phagophore, ER, mitochondria and lysosomes with each other. (E) The DFCP1 fluorescence from live-cell imaging overlaid with the 3D model. Note that the DFCP1 localization overlaps the ER in the 3D model. (FH) Slices through the tomogram. Panels (F’H’) show the boxed areas at higher magnification. (F,F’) The phagophore/autophagosome (green arrows) has MCSs (red arrows in (F’)) with the ER (yellow arrows) inside and outside of the phagophore. (G,G’) The phagophore/autophagosome (green arrows) has MCSs with a lysosome (Ly). (H,H’) The phagophore/autophagosome (green arrows) also has an MCS (white arrow in (H’)) with a mitochondrion (mi). In panels (D,E), ER, mitochondria and lysosomes are shown as volume rendered according to their grey-level values. See also Supplementary Figure S1.
Figure 2
Figure 2
Electron tomography of a mouse embryonic fibroblast deficient in ATG2A and ATG2B. (AC) Tomography slices of a ribosome-free area containing a double-membrane vesicle (a putative phagophore precursor (green arrows)), cup-shaped vesicles (purple arrows), ferritin particles (black arrows) and surrounded by ER (yellow arrows) and mitochondria (mi). The red arrow in panel (B) indicates an MCS between the phagophore precursor and the ER, and the white arrows in panel (C) point to an MCS between the ER and a mitochondrion. (D) Organelles in the tomogram were traced with different colors, as indicated by the overlay, as well as the bottom panel of the figure. (E,F) Details of the 3D model. Ferritin particles are shown in black. Note the MCS between the phagophore precursor and ER (red arrow), also visible in panel (B). The phagophore precursor contains ferritin and two vesicles.
Figure 3
Figure 3
CLEM of a phagophore precursor. (A) HEK293 cells expressing GFP-tagged ATG13 were time-lapse imaged to trace ATG13 puncta. The cells were fixed 60 s after the appearance of the ATG13 punctum. After fixation, the same cell and punctum were imaged with electron tomography. (B) One slice of the tomogram overlaid with the ATG13 fluorescence. (CH) Tomography slices showing the phagophore precursor (green arrows), ER (yellow arrows) and cup-shaped vesicles (purple arrows). The white arrows in panels (D,E,J) indicate a small opening in the phagophore precursor. Note the phagophore precursor contains ribosomes, similar to the cytoplasm around it. (I) Organelles in the tomogram were traced with different colors, as indicated by the overlay, as well as the top right panel of the figure. (J,K) Tomography slice showing the phagophore precursor and ER from a different angle compared with panels (BI). Note the MCS between the phagophore precursor and ER (red arrow in panel (J)), and the small opening in the phagophore precursor (white arrow in panel (J)). (LN) Views of the 3D model from different angles, demonstrating the close apposition of the phagophore precursor and ER, as well as the vesicles. See also Supplementary Figure S1.
Figure 4
Figure 4
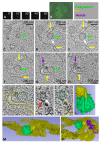
CLEM of a phagophore precursor. (A) HEK293 cells expressing GFP-tagged ATG13 were time-lapse imaged to trace ATG13 puncta. The cells were fixed 90 s after the appearance of the ATG13 punctum. After fixation, the same cell and punctum were imaged with electron tomography. (B) One slice of the tomogram overlaid with the ATG13 fluorescence. (CH) Tomography slices showing the phagophore precursor (green arrows), ER (yellow arrows) and cup-shaped vesicles (purple arrows). The white arrow in panel (G) indicates a small opening in the phagophore precursor. (I,J) Organelles in the tomogram were traced with different colors, as indicated by the overlay, as well as the top right panel of the figure. (K,L) Tomography slice showing the phagophore precursor, ER and one vesicle from a different angle compared with panels (CJ). (M,N) Views of the 3D model from different angles, demonstrating the close apposition of the phagophore precursor and ER, as well as the vesicles. See also Supplementary Figure S1.
Figure 5
Figure 5
CLEM of a phagophore. (A) HEK293 cells expressing GFP-tagged ATG13 were time-lapse imaged to trace ATG13 puncta. The cells were fixed 4 min 45 s after the appearance of the ATG13 punctum. After fixation, the same cell and punctum were imaged with electron tomography. (B) One slice of the tomogram overlaid with the ATG13 fluorescence. (CF) Tomography slices showing the phagophore (green arrows), ER (yellow arrows), vesicles (purple arrows) and a bundle of putative actin filaments (pink arrows). The white arrow in panel (C) indicates an MCS between a mitochondrion (mi) and ER close to the phagophore. (G) Organelles in the tomogram were traced with different colors, as indicated by the overlay, as well as the bottom right panel of the figure. Panels (C’,E’,F’) show enlarged details from panels (C,E,F), respectively. The red arrows in panels (E’,F’) indicate MCSs between the phagophore and ER. (HJ) Views of the 3D model from different angles, demonstrating the close apposition of the phagophore, ER and vesicles, as well as the location of the actin filament bundle. See also Supplementary Figure S1.

References

    1. Mizushima N., Komatsu M. Autophagy: Renovation of cells and tissues. Cell. 2011;147:728–741. doi: 10.1016/j.cell.2011.10.026. - DOI - PubMed
    1. Hosokawa N., Hara T., Kaizuka T., Kishi C., Takamura A., Miura Y., Iemura S., Natsume T., Takehana K., Yamada N., et al. Nutrient-dependent mTORC1 association with the ULK1-Atg13-FIP200 complex required for autophagy. Mol. Biol. Cell. 2009;20:1981–1991. doi: 10.1091/mbc.e08-12-1248. - DOI - PMC - PubMed
    1. Jung C.H., Jun C.B., Ro S.H., Kim Y.M., Otto N.M., Cao J., Kundu M., Kim D.H. ULK-Atg13-FIP200 Complexes Mediate mTOR Signaling to the Autophagy Machinery. Mol. Biol. Cell. 2009;20:1992–2003. doi: 10.1091/mbc.e08-12-1249. - DOI - PMC - PubMed
    1. Karanasios E., Stapleton E., Manifava M., Kaizuka T., Mizushima N., Walker S.A., Ktistakis N.T. Dynamic association of the ULK1 complex with omegasomes during autophagy induction. Pt 22J. Cell Sci. 2013;126:5224–5238. doi: 10.1242/jcs.132415. - DOI - PubMed
    1. Axe E.L., Walker S.A., Manifava M., Chandra P., Roderick H.L., Habermann A., Griffiths G., Ktistakis N.T. Autophagosome formation from membrane compartments enriched in phosphatidylinositol 3-phosphate and dynamically connected to the endoplasmic reticulum. J. Cell Biol. 2008;182:685–701. doi: 10.1083/jcb.200803137. - DOI - PMC - PubMed

Publication types

LinkOut - more resources