. 2022 Oct 6;11(19):3142.
doi: 10.3390/cells11193142.

Hierarchical Clustering and Trajectory Analyses Reveal Viremia-Independent B-Cell Perturbations in HIV-2 Infection

Affiliations

Hierarchical Clustering and Trajectory Analyses Reveal Viremia-Independent B-Cell Perturbations in HIV-2 Infection

Emil Johansson et al. Cells. .

Abstract

Time to AIDS in HIV-2 infection is approximately twice as long compared to in HIV-1 infection. Despite reduced viremia, HIV-2-infected individuals display signs of chronic immune activation. In HIV-1-infected individuals, B-cell hyperactivation is driven by continuous antigen exposure. However, the contribution of viremia to B-cell perturbations in HIV-2-infected individuals remains largely unexplored. Here, we used polychromatic flow cytometry, consensus hierarchical clustering and pseudotime trajectory inference to characterize B-cells in HIV-1- or HIV-2-infected and in HIV seronegative individuals. We observed increased frequencies of clusters containing hyperactivated T-bethighCD95highCD27int and proliferating T-bet+CD95highCD27+CD71+ memory B-cells in viremic HIV-1 (p < 0.001 and p < 0.001, respectively), viremic HIV-2 (p < 0.001 and p = 0.014, respectively) and in treatment-naïve aviremic HIV-2 (p = 0.004 and p = 0.020, respectively)-infected individuals, compared to seronegative individuals. In contrast, these expansions were not observed in successfully treated HIV-1-infected individuals. Finally, pseudotime trajectory inference showed that T-bet-expressing hyperactivated and proliferating memory B-cell populations were located at the terminal end of two trajectories, in both HIV-1 and HIV-2 infections. As the treatment-naïve aviremic HIV-2-infected individuals, but not the successfully ART-treated HIV-1-infected individuals, showed B-cell perturbations, our data suggest that aviremic HIV-2-infected individuals would also benefit from antiretroviral treatment.

Keywords: B-cell phenotype; CD95; HIV-1; HIV-2; T-bet; immune perturbations; viremia.


Conflict of interest statement

The authors declare that the research was conducted in the absence of any commercial or financial relationships that could be construed as a potential conflict of interest.

Figures
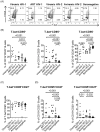
Figure 1
Figure 1
Both HIV-1 and HIV-2 infection induces T-bet expression in CD19+CD20+ B-cells. (A) Representative flow cytometry plots depicting CD95 and T-bet expression on CD19+CD20+ B-cells in treatment-naïve or sub-optimally ART-treated HIV-1 (viremic HIV-1, n=8), successfully ART-treated HIV-1 (ART HIV-1, n = 7), viremic HIV-2 (viremic HIV-2, n = 8), treatment-naïve aviremic HIV-2 (aviremic HIV-2, n = 12)-infected individuals and HIV seronegative (seronegative, n = 25) individuals. (B) Scatter plots illustrating the percentage of T-bet+CD95+, T-bet+CD95+ and T-bet+CD95+ among B-cells in the different study groups. (C) Scatter plots illustrating the percentage of T-bet+CD95+CD27- among T-bet+CD95+ B-cells (CD19+CD20+). (D) Scatter plots illustrating percentage of T-bet+CD95+CD27- and T-bet+CD95+CD27+ cells among CD19+CD20+ B-cells. Nonparametric Kruskal–Wallis test followed by Dunn’s post hoc was performed to compare groups. Medians are depicted in scatter plots.
Figure 2
Figure 2
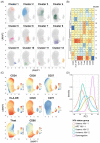
FlowSOM analysis showed alterations in B-cell phenotypes among HIV-1- and HIV-2-infected individuals. B-cells from all study participants were clustered according to CD24, CD38, CD27, HLA-DR, CD20, CD71, T-bet and CD95 expression using the FlowSOM algorithm. (A) FlowSOM clusters projected on a UMAP plot, generated using an equal number of cells from each HIV status group, based on the expression of the above mentioned eight markers. (B) Heatmap displaying scaled marker expression values within each FlowSOM cluster, and the color coding is based on marker expression centered and scaled by column (C) Expression of the eight markers is visualized on individual UMAP plots. (D) A principal component analysis (PCA) was performed on FlowSOM cluster frequency. The density plot display PC1 values, for treatment-naïve or sub-optimally ART-treated HIV-1 (viremic HIV-1, n = 8), successfully ART-treated HIV-1 (ART HIV-1, n = 7), viremic HIV-2 (viremic HIV-2, n = 8), treatment-naïve aviremic HIV-2 (aviremic HIV-2, n = 12)-infected individuals and HIV seronegative (seronegative, n = 25) individuals.
Figure 3
Figure 3
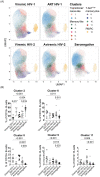
Specific B-cell perturbations within HIV-1- and HIV-2-infected individuals were identified by consensus hierarchical clustering. (A) FlowSOM clusters projected on UMAP plots faceted by HIV status group. (B) FlowSOM cluster frequency in treatment-naïve or sub-optimally ART-treated HIV-1 (viremic HIV-1, n = 8), successfully ART-treated HIV-1 (ART HIV-1, n = 7), viremic HIV-2 (viremic HIV-2, n = 8), treatment-naïve aviremic HIV-2 (aviremic HIV-2, n = 12)-infected individuals and HIV seronegative (seronegative, n = 25) individuals. Nonparametric Kruskal–Wallis test followed by Dunn’s post hoc was performed to compare groups. Medians and IQR are depicted in scatter plots.
Figure 4
Figure 4
HIV-1 and HIV-2 infection promotes differentiation of B-cells into T-bethigh activated memory B-cells. (A) Pseudotime projected on UMAP plots faceted by identified lineage. The pseudotime trajectory inference analysis, based on FlowSOM clusters, was performed using the Slingshot method. Fifty thousand cells from each HIV status group were included in the analysis. (B) Jitterplots colored by FlowSOM clusters along pseudotime in each lineage. (C) Lineage faceted density plots displaying the distribution of cells along pseudotime, from treatment-naïve or sub-optimally ART-treated HIV-1 (viremic HIV-1, n = 8), successfully ART-treated HIV-1 (ART HIV-1, n = 7), viremic HIV-2 (viremic HIV-2, n = 8), aviremic HIV-2 (aviremic HIV-2, n = 12)-infected individuals and HIV seronegative (seronegative, n = 25) individuals.

References

    1. Kanki P.J., Travers K.U., Mboup S., Hsieh C.C., Marlink R.G., Gueye N.A., Siby T., Thior I., Avila M.H., Sankale J.L., et al. Slower heterosexual spread of HIV-2 than HIV-1. Lancet. 1994;343:943–946. doi: 10.1016/S0140-6736(94)90065-5. - DOI - PubMed
    1. Esbjornsson J., Mansson F., Kvist A., da Silva Z.J., Andersson S., Fenyo E.M., Isberg P.-E., Biague A.J., Lindman J., Palm A.A., et al. Long-term follow-up of HIV-2-related AIDS and mortality in Guinea-Bissau: A prospective open cohort study. Lancet HIV. 2018;6:e25–e31. doi: 10.1016/S2352-3018(18)30254-6. - DOI - PubMed
    1. Nyamweya S., Hegedus A., Jaye A., Rowland-Jones S., Flanagan K.L., Macallan D.C. Comparing HIV-1 and HIV-2 infection: Lessons for viral immunopathogenesis. Rev. Med. Virol. 2013;23:221–240. doi: 10.1002/rmv.1739. - DOI - PubMed
    1. Marlink R., Kanki P., Thior I., Travers K., Eisen G., Siby T., Traore I., Hsieh C.C., Dia M.C., Gueye E.H., et al. Reduced rate of disease development after HIV-2 infection as compared to HIV-1. Science. 1994;265:1587–1590. doi: 10.1126/science.7915856. - DOI - PubMed
    1. van der Loeff M.F., Larke N., Kaye S., Berry N., Ariyoshi K., Alabi A., Tienen C.V., Leligdowicz A., Sarge-Njie R., Siliva Z.D., et al. Undetectable plasma viral load predicts normal survival in HIV-2-infected people in a West African village. Retrovirology. 2010;7:46. doi: 10.1186/1742-4690-7-46. - DOI - PMC - PubMed

Publication types