. 2022 Sep 21;19(19):11899.
doi: 10.3390/ijerph191911899.

Evaluating the Impact of the COVID-19 Pandemic on Accessing HIV Services in South Africa: A Systematic Review

Affiliations

Evaluating the Impact of the COVID-19 Pandemic on Accessing HIV Services in South Africa: A Systematic Review

Claudia Goncalves Rebelo Jardim et al. Int J Environ Res Public Health. .

Abstract

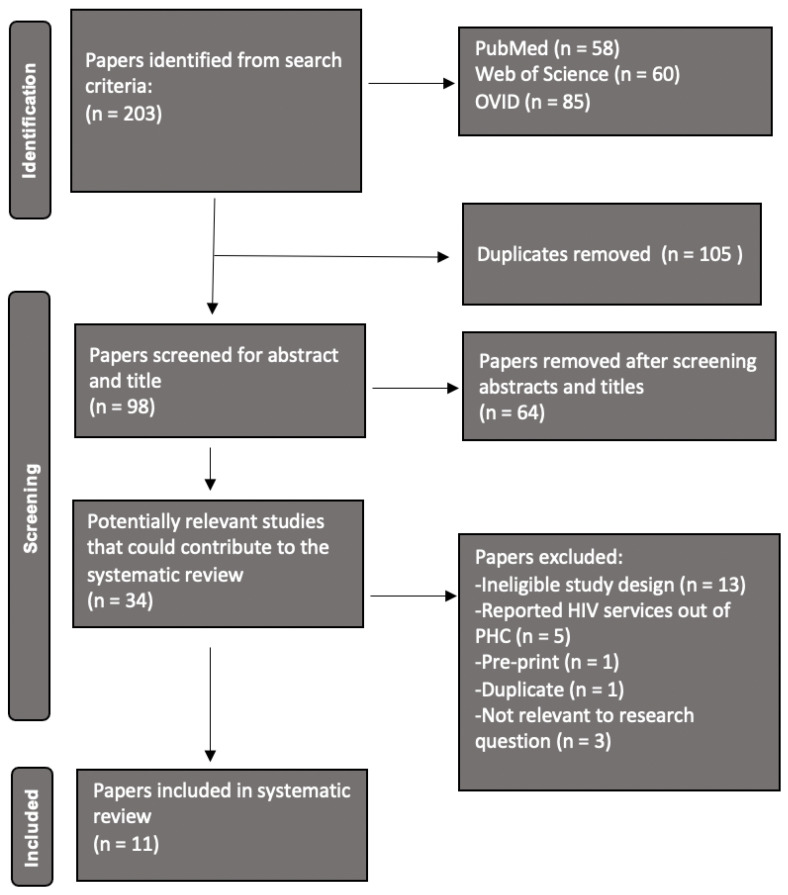
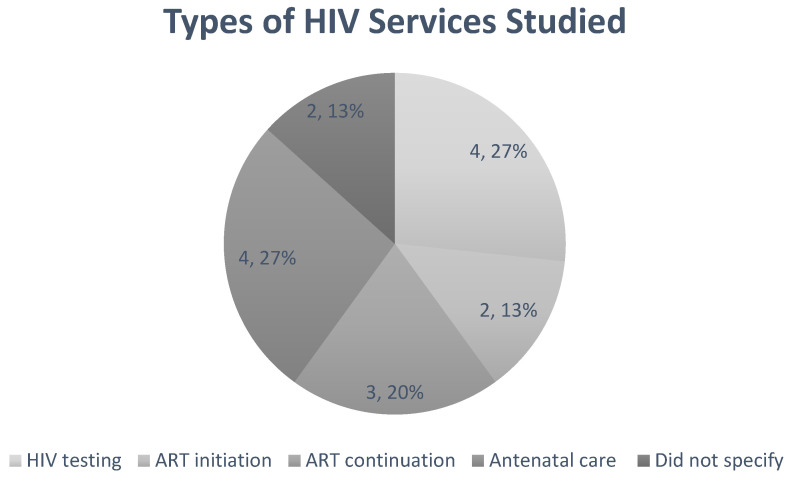
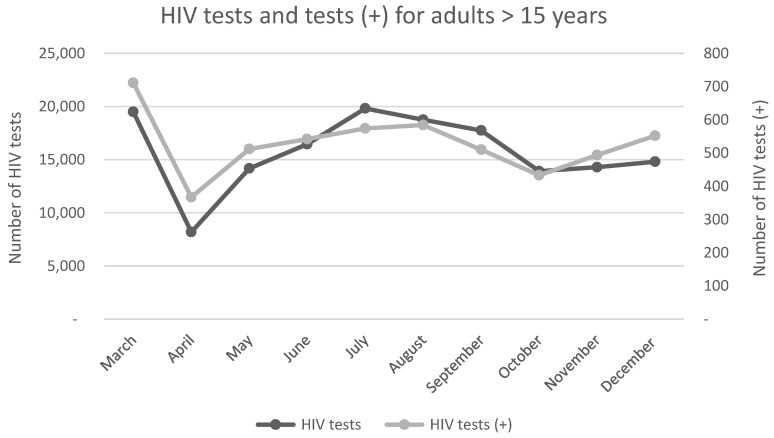
Progress has been made towards controlling the Human Immunodeficiency Virus (HIV) epidemic in South Africa. However, the emergence of coronavirus disease 2019 (COVID-19) has disrupted access to health care. This systematic review aims to evaluate the impact of the pandemic on accessing HIV services at a primary health care (PHC) level in South Africa. HIV services that have been significantly impacted are highlighted, and recommendations for future public health emergencies are made. Three databases were searched in January 2022. The studies included were those that reported on HIV services at a PHC level in South Africa. From the searches, 203 papers were identified, of which 34 full texts were screened. Eleven studies met the inclusion criteria and were included in this review. Overall, decreases in HIV testing, positive HIV tests, and initiation of antiretroviral therapy (ART) were reported. Resilience of ART provision was reported, meaning that adherence to treatment was sustained throughout the pandemic. The findings showed that HIV services at private PHC facilities were unaffected, however, an overall decrease in HIV services at public PHC facilities was reported, excluding antenatal care which showed resilience.

Keywords: ART; COVID-19 pandemic; HIV services; South Africa; access; epidemiology; primary health care; public health; systematic review.


Conflict of interest statement

The authors declare no conflict of interest.

Figures

Figure A1
Figure A1
The process of study screening and selection, including the numbers of results from the database searches and numbers and reasons for study exclusion at each stage of the process [19].
Figure 1
Figure 1
A line graph illustrating the annual number of HIV tests conducted in each province of South Africa, from 2018 to the end of 2020. Data was collected from the National Department of Health website, and represents HIV testing trends in the public health sector [17]. Each point represents the number of HIV tests conducted in the province for that specified year. The trend lines show that between 2018 and 2020, HIV testing in every province increased. In contrast, the trend line for 2020–2021 fell much lower than previous years. No significant change in HIV testing was observed for Free State and the North West, while Gauteng experienced the most drastic decline between 2019–2020 and 2020–2021. This graph has been adapted from Pillay et al. [18].
Figure 2
Figure 2
A pie chart representing the distribution of data on HIV services. Approximately 36% of the studies reported on HIV testing, 36% reported on antenatal care, and 27% reported on ART initiation. Only two studies reported on ART initiation. This shows that there is not enough data available for ART initiation, which should be considered as an area of future observation. Two studies did not specify the type of HIV service being reported. (HIV = Human Immunodeficiency Virus; ART = Antiretroviral therapy).
Figure 3
Figure 3
Line graph presenting the monthly numbers of HIV tests and positive HIV tests (+) for adults over 15 years of age in 2020. The number of positive HIV tests follows the trend of the number of HIV tests being conducted. A significant decrease in both testing and positive tests was seen for the month of April, coinciding with the start of lockdown level five. A monthly increase in testing and positive tests was seen throughout the year, however, it did not increase to the pre-lockdown level. This figure was created using data from Mutyambizi et al., 2021 [26]. (HIV = Human Immunodeficiency Virus).
Figure 4
Figure 4
Line graph presenting the monthly number of HIV tests and positive HIV tests (+) for children under 15 years of age in 2020. The number of positive HIV tests followed the trend of the number of HIV tests being conducted. A significant decrease in testing and positive tests was seen for the months of April and May, coinciding with the start of the first wave of COVID-19 cases in South Africa. A monthly increase in testing and positive tests was seen throughout the year, however, it did not increase pre-lockdown levels. The number of children < 15 years of age testing positive for HIV significantly increased between November and December. This figure was created using data from Mutyambizi et al., 2021 [26]. (HIV = Human Immunodeficiency Virus).
Figure 5
Figure 5
Line graph illustrating the annual number of HIV tests conducted in each province of South Africa, from 2018 until the end of 2020. Data was collected from the National Department of Health website, and represents HIV testing trends in the public health sector [17]. Each point represents the number of HIV tests conducted in the province for that specified year. The trend lines show that between 2018 and 2020, HIV testing in every province increased. In contrast, the trend line for 2020–2021 fell much lower than previous years. No significant change in HIV testing can be seen for Free State and the North West, however, Gauteng experienced the most drastic decline between 2019–2020 and 2020–2021.

References

    1. World Health Organisation HIV/AIDS. [(accessed on 3 November 2021)]. Available online: https://www.who.int/data/gho/data/themes/hiv-aids.
    1. Bain L.E., Nkoke C., Noubiap J.J.N. UNAIDS 90–90–90 targets to end the AIDS epidemic by 2020 are not realistic: Comment on Can the UNAIDS 90–90–90 target be achieved? A systematic analysis of national HIV treatment cascades. BMJ Glob. Health. 2017;2:e000227. doi: 10.1136/bmjgh-2016-000227. - DOI - PMC - PubMed
    1. Kim H., Tanser F., Tomita A., Vandormael A., Cuadros D.F. Beyond HIV prevalence: Identifying people living with HIV within underserved areas in South Africa. BMJ Glob. Health. 2021;6:e004089. doi: 10.1136/bmjgh-2020-004089. - DOI - PMC - PubMed
    1. UNAIDS Global HIV & AIDS Statistics: 2020 Fact Sheet. 2020. [(accessed on 3 November 2021)]. Available online: https://www.unaids.org/en/resources/fact-sheet.
    1. Hodes R. Oxford Research Encyclopedia of African History. Oxford University Press; Oxford, UK: 2018. HIV/AIDS in South Africa.

Publication types