

Examining the Indirect Death Surveillance System of The Great East Japan Earthquake and Tsunami
- PMID: 36231645
- PMCID: PMC9566299
- DOI: 10.3390/ijerph191912351
Examining the Indirect Death Surveillance System of The Great East Japan Earthquake and Tsunami
Abstract
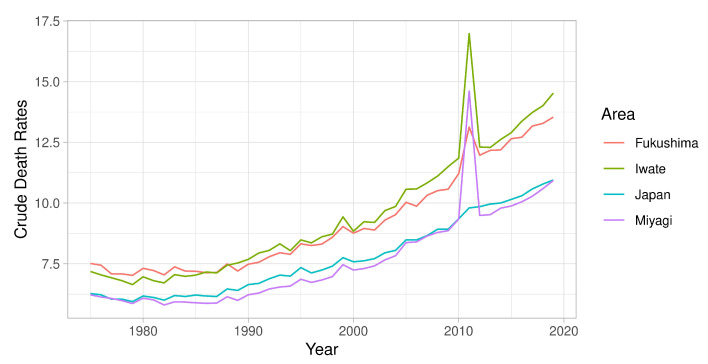
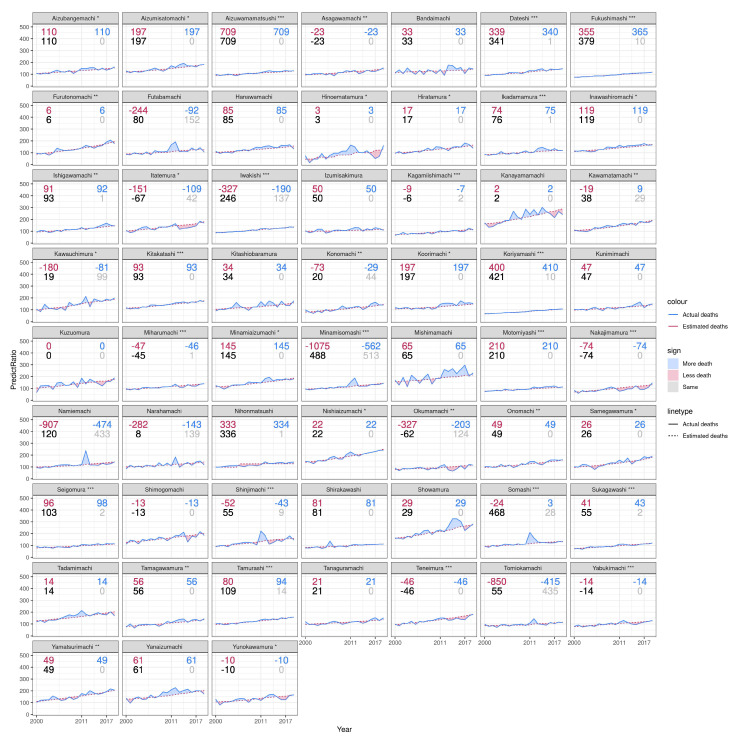
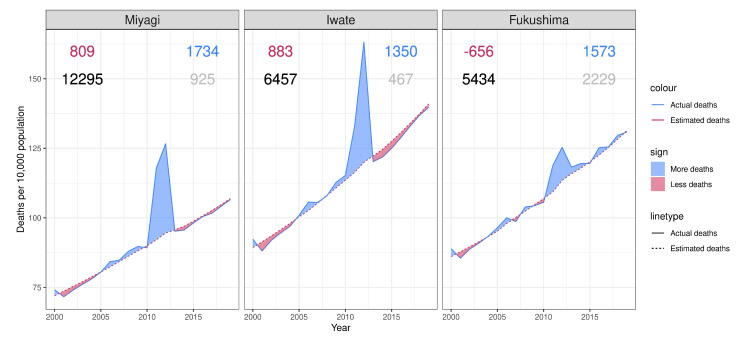
The long-term mortality risk of natural disasters is a key threat to disaster resilience improvement, yet an authoritative certification and a reliable surveillance system are, unfortunately, yet to be established in many countries. This study aimed to clarify the mechanism of post-disaster indirect deaths in Japan, to improve the existing disaster recovery evaluation system and support decision making in public policy. This study first investigated the definition of indirect deaths via a literature review before examining the observed number of indirect deaths via case study, census data from the Population Demographic and Household Surveys, other social surveys, and reports in the case of the Great East Japan Earthquake and Tsunami, which severely damaged northeastern Japan, especially the three prefectures, which are the target areas in this context (i.e., Fukushima, Iwate, and Miyagi). It was found that the reported number of indirect deaths was significantly underestimated. In total, 4657 indirect deaths were estimated to have occurred in the target prefectures. This was higher than the reported number, which was 3784. The overall statistics established via collaboration between local administrations and governments can be improved to provide better reference for researchers and policymakers to investigate the long-term effects of natural disaster.
Keywords: earthquake fatalities; excess mortality; indirect death; long-term effects; surveillance system.
Conflict of interest statement
The authors declare no conflict of interest.
Figures
Similar articles
-
Characteristics of pneumonia deaths after an earthquake and tsunami: an ecological study of 5.7 million participants in 131 municipalities, Japan.BMJ Open. 2016 Feb 23;6(2):e009190. doi: 10.1136/bmjopen-2015-009190. BMJ Open. 2016. PMID: 26908515 Free PMC article.
-
Fukushima after the Great East Japan Earthquake: lessons for developing responsive and resilient health systems.J Glob Health. 2017 Jun;7(1):010501. doi: 10.7189/jogh.07.010501. J Glob Health. 2017. PMID: 28400956 Free PMC article.
-
[The number of deaths by suicide after the Great East Japan Earthquake based on demographic statistics in the coastal and non-coastal areas of Iwate, Miyagi, and Fukushima prefectures].Nihon Koshu Eisei Zasshi. 2018;65(4):164-169. doi: 10.11236/jph.65.4_164. Nihon Koshu Eisei Zasshi. 2018. PMID: 29731482 Japanese.
-
Measuring Personal Damage in a Large-Scale Disaster: A Review of the Reports Published by the Japanese Fire and Disaster Management Agency on the Great East Japan Earthquake and Tsunami.Disaster Med Public Health Prep. 2022 Oct;16(5):2056-2064. doi: 10.1017/dmp.2021.144. Disaster Med Public Health Prep. 2022. PMID: 36307943 Review.
-
[Cooperation and support activities of infection control after the Great East Japan Earthquake].Rinsho Byori. 2013 Dec;61(12):1160-5. Rinsho Byori. 2013. PMID: 24605551 Review. Japanese.
Cited by
-
Special Issue "Disaster Risk Reduction and Climate Change Adaptation: An Interdisciplinary Approach".Int J Environ Res Public Health. 2023 Feb 1;20(3):2641. doi: 10.3390/ijerph20032641. Int J Environ Res Public Health. 2023. PMID: 36768006 Free PMC article.
-
Medical perspective on the systemic challenges involving indirect disaster-related deaths in Japan.Sci Rep. 2025 Feb 12;15(1):5225. doi: 10.1038/s41598-025-89349-7. Sci Rep. 2025. PMID: 39939351 Free PMC article.
References
-
- General Assembly . Resolution Adopted by the General Assembly on 3 June 2015. United Nations; New York, NY, USA: 2016.
-
- United Nations . The Sendai Framework for Disaster Risk Reduction. United Nations; New York, NY, USA: 2015.
-
- Wirtz A., Kron W., Löw P., Steuer M. The need for data: Natural disasters and the challenges of database management. Nat. Hazards. 2014;70:135–157. doi: 10.1007/s11069-012-0312-4. - DOI
Publication types
MeSH terms
LinkOut - more resources
Full Text Sources
Medical
