. 2022 Sep 26;23(19):11327.
doi: 10.3390/ijms231911327.

Sox6 Differentially Regulates Inherited Myogenic Abilities and Muscle Fiber Types of Satellite Cells Derived from Fast- and Slow-Type Muscles

Affiliations

Sox6 Differentially Regulates Inherited Myogenic Abilities and Muscle Fiber Types of Satellite Cells Derived from Fast- and Slow-Type Muscles

Zihao Zhang et al. Int J Mol Sci. .

Abstract

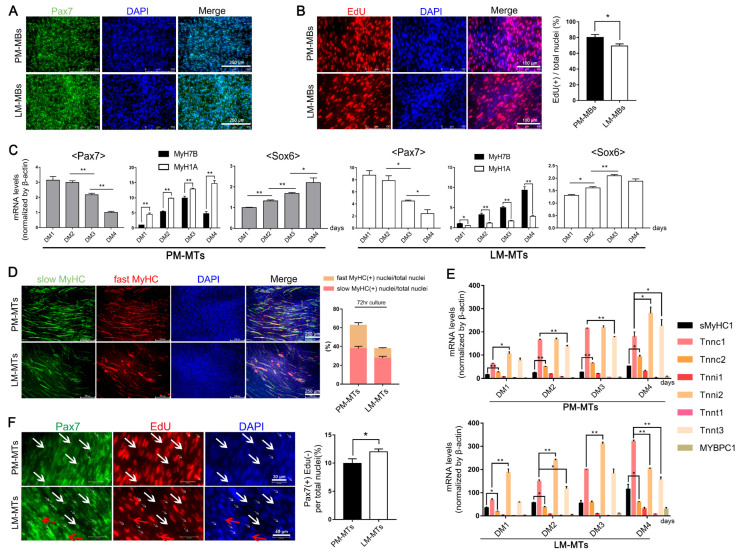
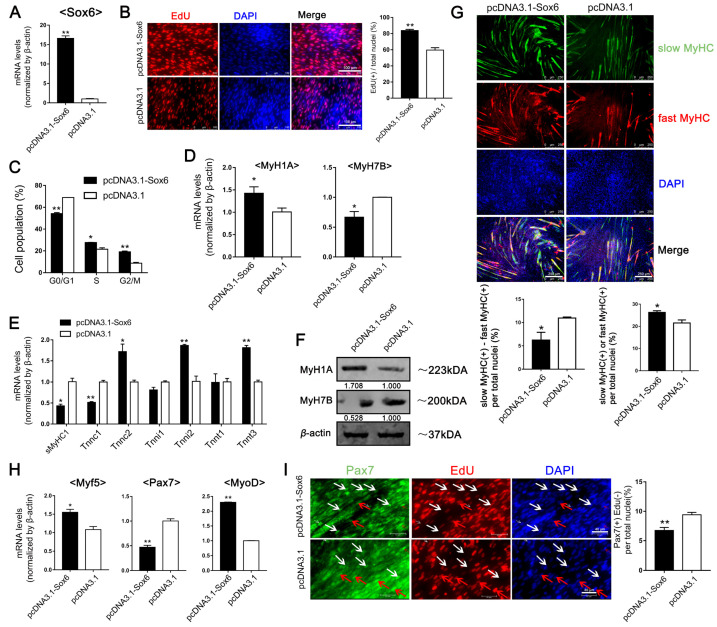
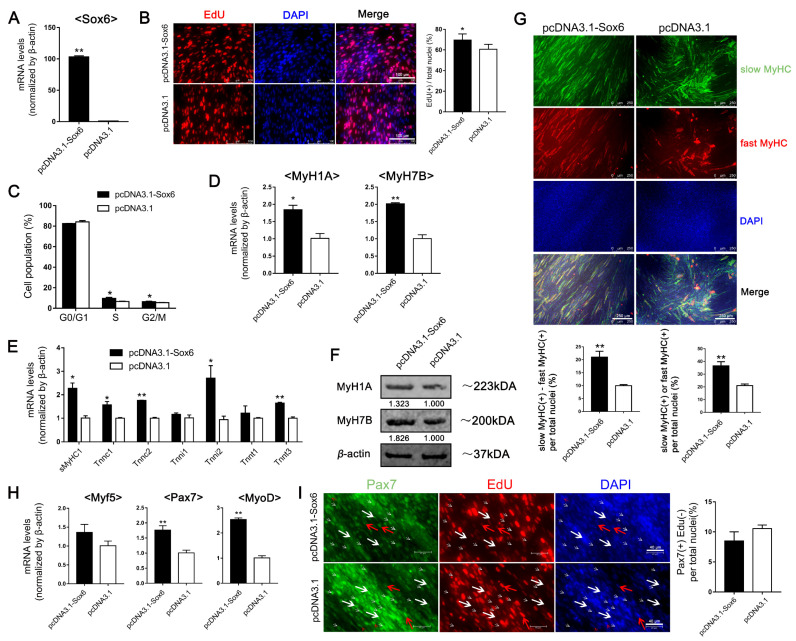
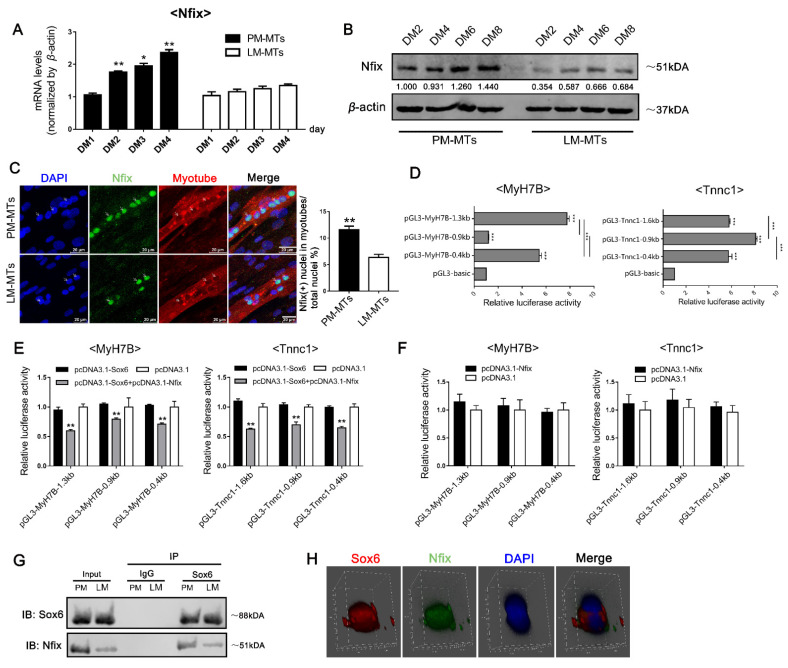
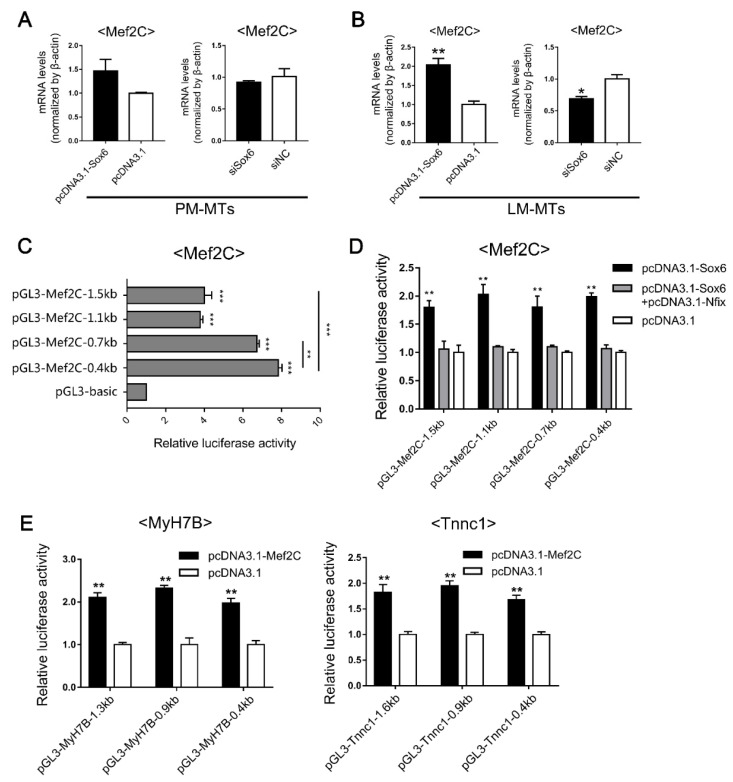
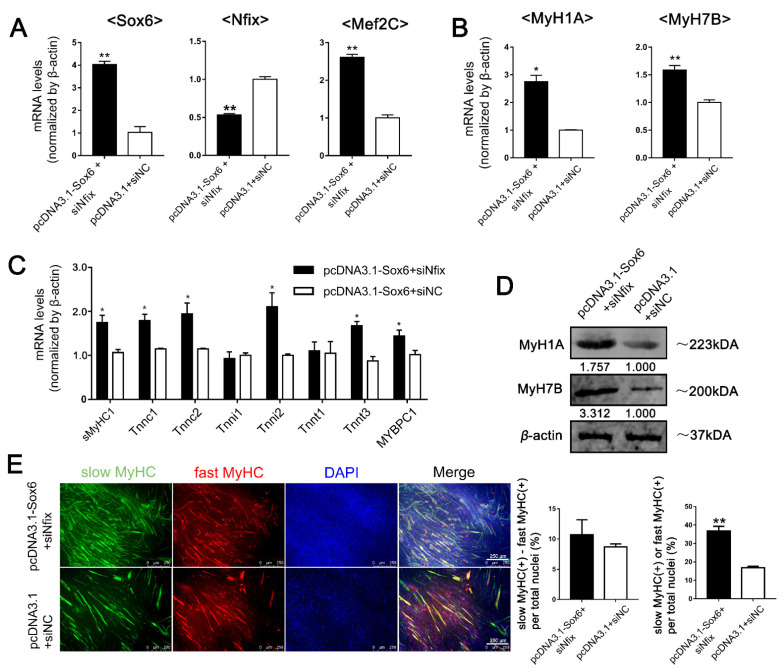
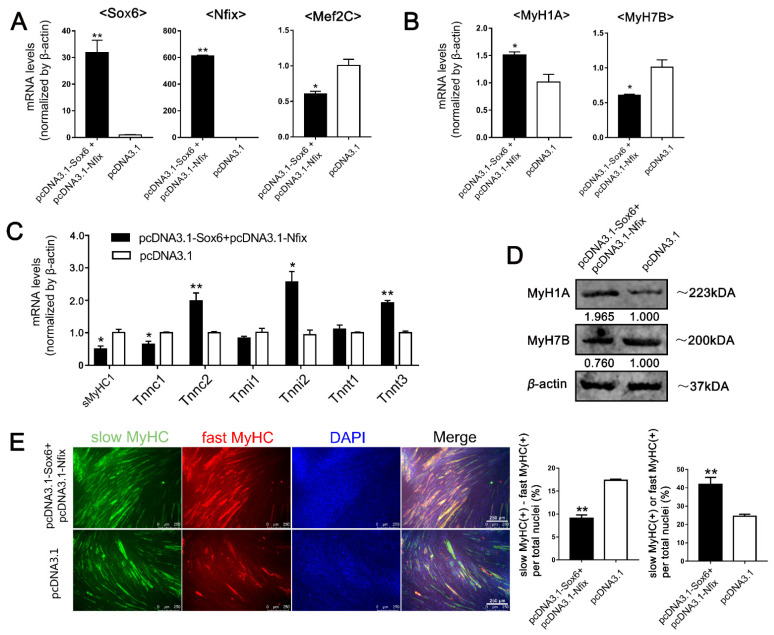
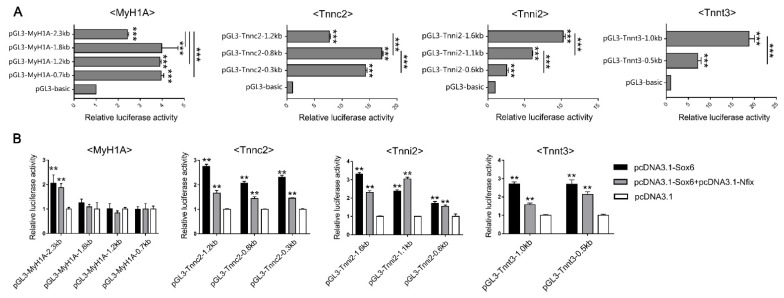
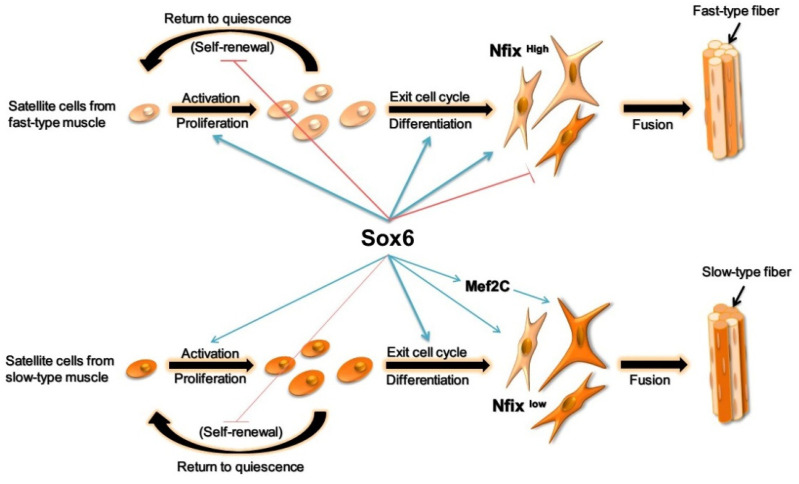
Adult skeletal muscle is primarily divided into fast and slow-type muscles, which have distinct capacities for regeneration, metabolism and contractibility. Satellite cells plays an important role in adult skeletal muscle. However, the underlying mechanisms of satellite cell myogenesis are poorly understood. We previously found that Sox6 was highly expressed in adult fast-type muscle. Therefore, we aimed to validate the satellite cell myogenesis from different muscle fiber types and investigate the regulation of Sox6 on satellite cell myogenesis. First, we isolated satellite cells from fast- and slow-type muscles individually. We found that satellite cells derived from different muscle fiber types generated myotubes similar to their origin types. Further, we observed that cells derived from fast muscles had a higher efficiency to proliferate but lower potential to self-renew compared to the cells derived from slow muscles. Then we demonstrated that Sox6 facilitated the development of satellite cells-derived myotubes toward their inherent muscle fiber types. We revealed that higher expression of Nfix during the differentiation of fast-type muscle-derived myogenic cells inhibited the transcription of slow-type isoforms (MyH7B, Tnnc1) by binding to Sox6. On the other hand, Sox6 activated Mef2C to promote the slow fiber formation in slow-type muscle-derived myogenic cells with Nfix low expression, showing a different effect of Sox6 on the regulation of satellite cell development. Our findings demonstrated that satellite cells, the myogenic progenitor cells, tend to develop towards the fiber type similar to where they originated. The expression of Sox6 and Nfix partially explain the developmental differences of myogenic cells derived from fast- and slow-type muscles.

Keywords: Sox6; developmental differences; muscle fiber types; muscle satellite cells.


Conflict of interest statement

The authors declare no conflict of interest.

Figures

Figure 1
Figure 1
Differences in the myogenic capacity of the satellite cells from fast- and slow-type muscles. (A) Freshly isolated satellite cells from PM and LM were stained with satellite cell marker Pax7 (green) and DAPI (blue). (B) Satellite cells isolated from PM and LM were cultured in the growth medium with EdU for 6 h. The proliferating cells were stained with Edu (red) and nuclei were stained with DAPI (blue) (mean ± SEM; * p < 0.05; n = 3; two-tailed Student’s t-test). (C) PM-MBs and LM-MBs were cultured in DM for 4 days, the relative expression levels of Pax7, MyH1A, MyH7B and Sox6 in myotubes in DM in different days were quantified by qPCR (mean ± SEM; * p < 0.05; ** p < 0.01; n = 3; two-tailed Student’s t-test or one-way analysis of variance with Tukey’s multiple comparison test). (D) After inducing differentiation for 3 days, myotubes in PM-MTs and LM-MTs were performing double immunofluorescence staining with S58 (slow-type MyHC, green) and F59 (fast-type MyHC, red) and nuclei were stained with DAPI (blue). The slow MyHC(+) nuclei or fast MyHC(+) nuclei were counted and the proportion of slow MyHC(+) cells or fast MyHC(+) cells relative to the total nuclei was quantified (mean ± SEM; n = 3). (E) The relative expression levels of the slow-type fiber isoforms sMyHC1, Tnnc1, Tnni1, Tnnt1, MYBPC1 and the fast-type fiber isoforms Tnnc2, Tnni2, Tnnt3 in PM-MTs and LM-MTs in DM in different days were quantified by qPCR (mean ± SEM; * p < 0.05; ** p < 0.01; n = 3; one-way analysis of variance with Tukey’s multiple comparison test). (F) PM-MBs and LM-MBs were cultured in DM for 5 days and EdU was added to the culture medium 24 h prior to harvest. In the end, the cells were stained with Pax7 (green) and EdU (red) (mean ± SEM; * p < 0.05; n = 3; two-tailed Student’s t-test). White arrows represent part of the typical Pax7(+)EdU(−) cells and red arrows represent part of the typical Pax7(+)EdU(+) cells.
Figure 2
Figure 2
Sox6 in PM-derived satellite cell promotes cell proliferation and fast-type fiber formation, but decreases slow-type fiber formation and cell self-renewal potential. (A) The relative expression levels of Sox6 in Sox6-overexpressing PM-MBs were quantified by qPCR (mean ± SEM; ** p < 0.01; n = 3; two-tailed Student’s t-test). (B) Proliferation of Sox6-overexpressing PM-MBs were assessed by Edu (mean ± SEM; ** p < 0.01; n = 3; two-tailed Student’s t-test). (C) Cell cycle analysis of Sox6-overexpressing PM-MBs (mean ± SEM; * p < 0.05; ** p < 0.01; n = 3; two-tailed Student’s t-test). (D) After inducing differentiation for 3 days, the relative expression levels of MyH1A and MyH7B in Sox6-overexpressing PM-MTs were quantified by qPCR (mean ± SEM; * p < 0.05; n = 3; two-tailed Student’s t-test). (E) After inducing differentiation for 3 days, the relative expression levels of fast- and slow-type fiber isoforms in Sox6-overexpressing PM-MTs were quantified by qPCR (mean ± SEM; * p < 0.05; ** p < 0.01; n = 3; two-tailed Student’s t-test). (F) Western blot on lysates from Sox6-overexpressing PM-MTs and control groups myotubes after inducing differentiation for 3 days. β-actin was used to normalize. (G) After inducing differentiation for 3 days, myotubes derived from Sox6-overexpressing PM-MTs were stained against S58 (slow-type MyHC, green) and F59 (fast-type MyHC, red) and nuclei were counterstained with DAPI. The slow MyHC(+) nuclei or fast MyHC(+) nuclei were counted. The proportion of slow MyHC(+) cells − fast MyHC(+) cells among total nuclei and the proportion of cells in slow MyHC(+) myotubes or fast MyHC(+) myotubes among total nuclei are presented as mean ± SEM (* p < 0.05; n = 3; two-tailed Student’s t-test). (H) After inducing differentiation for 3 days, the relative expression levels of Myf5, Pax7 and MyoD in Sox6-overexpressing PM-MBs were quantified by qPCR (mean ± SEM; * p < 0.05; ** p < 0.01; n = 3; two-tailed Student’s t-test). (I) Sox6-overexpressing PM-MBs were cultured in DM for 5 days and EdU was added to the culture medium 24 h prior to harvest. In the end, the cells were stained against Pax7 (green) and EdU (red) and the numbers were counted (mean ± SEM; ** p < 0.01; n = 3; two-tailed Student’s t-test). White arrows represented part of the typical Pax7(+)EdU(−) cells and red arrows represented part of the typical Pax7(+)EdU(+) cells.
Figure 3
Figure 3
Sox6 in LM-derived satellite cells promotes cell proliferation, fast-type and slow-type fibers’ formation. (A) The relative expression levels of Sox6 in Sox6-overexpressing LM-MBs were quantified by qPCR (mean ± SEM; ** p < 0.01; n = 3; two-tailed Student’s t-test). (B) Proliferation of Sox6-overexpressing LM-MBs were assessed by Edu (mean ± SEM; * p < 0.05; n = 3; two-tailed Student’s t-test). (C) Cell cycle analysis of Sox6-overexpressing LM-MBs (mean ± SEM; * p < 0.05; n = 3; two-tailed Student’s t-test). (D) After inducing differentiation for 3 days, the relative expression levels of MyH1A and MyH7B in Sox6-overexpressing LM-MTs were quantified by qPCR (mean ± SEM; * p < 0.05; ** p < 0.01; n = 3; two-tailed Student’s t-test). (E) After inducing differentiation for 3 days, the relative expression levels of fast- and slow-type fiber isoforms in Sox6-overexpressing LM-MTs were quantified by qPCR (mean ± SEM; * p < 0.05; ** p < 0.01; n = 3; two-tailed Student’s t-test). (F) Western blot on lysates from Sox6-overexpressing LM-MTs and control groups myotubes after inducing differentiation for 3 days. β-actin was used to normalize. (G) After inducing differentiation for 3 days, myotubes derived from Sox6-overexpressing LM-MTs were stained against S58 (slow-type MyHC, green) and F59 (fast-type MyHC, red) and nuclei were counterstained with DAPI. The slow MyHC(+) nuclei or fast MyHC(+) nuclei were counted. The proportion of slow MyHC(+) cells − fast MyHC(+) cells among total nuclei and the proportion of cells in slow MyHC(+) myotubes or fast MyHC(+) myotubes among total nuclei are presented as mean ± SEM (** p < 0.01; n = 3; two-tailed Student’s t-test). (H) After inducing differentiation for 3 days, the relative expression levels of Myf5, Pax7 and MyoD in Sox6-overexpressing LM-MBs were quantified by qPCR (mean ± SEM; ** p < 0.01; n = 3; two-tailed Student’s t-test). (I) Sox6-overexpressing LM-MBs were cultured in DM for 5 days and EdU was added to the culture medium 24 h prior to harvest. In the end, the cells were stained against Pax7 (green) and EdU (red) and the numbers were counted (mean ± SEM; n = 3; two-tailed Student’s t-test). White arrows represented part of the typical Pax7(+)EdU(−) cells and red arrows represented part of the typical Pax7(+)EdU(+) cells.
Figure 4
Figure 4
Differential expression patterns of Nfix between PM-MTs and LM-MTs modulate the Sox6 down-regulation of slow-type fibers. (A) The relative expression levels of Nfix in PM-MTs and LM-MTs in DM for different days were quantified by qPCR (mean ± SEM; * p < 0.05; ** p < 0.01; n = 3; one-way analysis of variance with Tukey’s multiple comparison test). (B) Western blot on lysates from myotubes of PM-MTs and LM-MTs in DM for different days. β-actin was used to normalize. (C) After inducing differentiation for 5 days, myotubes derived from PM and LM were performing double immunofluorescence staining against Nfix (green) and MyHC (red) and nuclei were counterstained with DAPI (mean ± SEM; ** p < 0.01; n = 3; two-tailed Student’s t-test). (D) Dual-Luciferase report assay on DF-1 transfected with reporter vectors containing different lengths of 5′-upstream region of MyH7B and Tnnc1 (mean ± SEM; *** p < 0.001; n = 6; one-way analysis of variance with Tukey’s multiple comparison test). (E) Dual-Luciferase report assay on DF-1 transfected with reporter vectors containing different lengths of 5′-upstream region of MyH7B and Tnnc1 after overexpressing Sox6 or Sox6 and Nfix (mean ± SEM; ** p < 0.01; n = 6; one-way analysis of variance with Tukey’s multiple comparison test). (F) Dual-Luciferase report assay on DF-1 transfected with reporter vectors containing different lengths of 5′-upstream region of MyH7B and Tnnc1 after overexpressing Nfix (mean ± SEM; n = 6; two-tailed Student’s t-test). (G) Lysates of PM-MTs and LM-MTs overexpressing Sox6 were immunoprecipitated with Sox6 antibody and then western blotted with Nfix antibody. IgG, negative control; IP, immunoprecipitated; IB, immunoblotting. (H) Myotubes derived from PM-MTs were performing double immunofluorescence staining against Sox6 (red) and Nfix (green). The three-dimensional view of Sox6 and Nfix localization in PM-MTs was presented through confocal microscopy.
Figure 5
Figure 5
Sox6 indirectly improves the slow-type isoforms through the activation of Mef2C. (A) After inducing differentiation for 3 days, the relative expression levels of Mef2C in PM-MTs or (B) LM-MTs after overexpression or inhibition of Sox6 were quantified by qPCR (mean ± SEM; * p < 0.05; ** p < 0.01; n = 3; two-tailed Student’s t-test). (C) Dual-Luciferase report assay on DF-1 transfected with reporter vectors containing different lengths of 5′-upstream region of Mef2C (mean ± SEM; ** p < 0.01; *** p < 0.001; n = 6; one-way analysis of variance with Tukey’s multiple comparison test). (D) Dual-Luciferase report assay on DF-1 overexpressing Sox6 and Nfix and transfected with reporter vectors containing different lengths of Mef2C 5′-upstream region (mean ± SEM; ** p < 0.01; n = 6; one-way analysis of variance with Tukey’s multiple comparison test). (E) Dual-Luciferase report assay on DF-1 overexpressing Mef2C and transfected with reporter vectors containing different lengths of 5′-upstream region of MyH7B and Tnnc1 (mean ± SEM; ** p < 0.01; n = 6; two-tailed Student’s t-test).
Figure 6
Figure 6
Overexpression of Sox6 in Nfix-inhibited PM-MTs promotes the expression of Mef2C and slow-type fibers. (A) After inducing differentiation for 3 days, the relative expression levels of Sox6, Nfix and Mef2C in Sox6-overexpressing PM-MTs with Nfix inhibition were quantified by qPCR (mean ± SEM; ** p < 0.01; n = 3; two-tailed Student’s t-test). (B) After inducing differentiation for 3 days, the relative expression levels of MyH1A and MyH7B in Sox6-overexpressing PM-MTs with Nfix inhibition were quantified by qPCR (mean ± SEM; * p < 0.05; ** p < 0.01; n = 3; two-tailed Student’s t-test). (C) After inducing differentiation for 3 days, the relative expression levels of fast- and slow-type fiber isoforms in Sox6-overexpressing PM-MTs with Nfix inhibition were quantified by qPCR (mean ± SEM; * p < 0.05; n = 3; two-tailed Student’s t-test). (D) Western blot on lysates from Sox6-overexpressing PM-MTs with Nfix inhibition and control group myotubes after inducing differentiation for 3 days. β-actin was used to normalize. (E) After inducing differentiation for 3 days, myotubes derived from Sox6-overexpressing PM-MTs with Nfix inhibition were performing immunofluorescence double staining against S58 (slow-type MyHC, green) and F59 (fast-type MyHC, red) and nuclei were counterstained with DAPI. The slow MyHC(+) nuclei or fast MyHC(+) nuclei were counted. The proportion of slow MyHC(+) cells − fast MyHC(+) cells among total nuclei and the proportion of cells in slow MyHC(+) myotubes or fast MyHC(+) myotubes among total nuclei are presented as mean ± SEM (** p < 0.01; n = 3; two-tailed Student’s t-test).
Figure 7
Figure 7
Overexpression of Sox6 in Nfix-overexpressing LM-MTs inhibits the expression of Mef2C and slow-type fiber isoforms. (A) After inducing differentiation for 3 days, the relative expression levels of Sox6, Nfix and Mef2C in Sox6-overexpressing LM-MTs with Nfix overexpression were quantified by qPCR (mean ± SEM; * p < 0.05; ** p < 0.01; n = 3; two-tailed Student’s t-test). (B) After inducing differentiation for 3 days, the relative expression levels of MyH1A and MyH7B in Sox6-overexpressing LM-MTs with Nfix overexpression were quantified by qPCR (mean ± SEM; * p < 0.05; n = 3; two-tailed Student’s t-test). (C) After inducing differentiation for 3 days, the relative expression levels of fast- and slow-type fiber isoforms in Sox6-overexpressing LM-MTs with Nfix overexpression were quantified by qPCR (mean ± SEM; * p < 0.05; ** p < 0.01; n = 3; two-tailed Student’s t-test). (D) Western blot on lysates from Sox6-overexpressing LM-MTs with Nfix overexpression and control group myotubes after inducing differentiation for 3 days. β-actin was used to normalize. (E) After inducing differentiation for 3 days, myotubes derived from Sox6-overexpressing LM-MTs with Nfix overexpression were performing immunofluorescence double staining against S58 (slow-type MyHC, green) and F59 (fast-type MyHC, red) and nuclei were counterstained with DAPI. The slow MyHC(+) nuclei or fast MyHC(+) nuclei were counted. The proportion of slow MyHC(+) cells − fast MyHC(+) cells among total nuclei and the proportion of cells in slow MyHC(+) myotubes or fast MyHC(+) myotubes among total nuclei are presented as mean ± SEM (** p < 0.01; n = 3; two-tailed Student’s t-test).
Figure 8
Figure 8
Sox6 directly promotes the transcription of fast-type isoforms. (A) Dual-Luciferase report assays on DF-1 transfected with reporter vectors containing different lengths of 5′-upstream region of MyH1A, Tnnc2, Tnni2 and Tnnt3 (mean ± SEM; *** p < 0.001; n = 6; one-way analysis of variance with Tukey’s multiple comparison test). (B) Dual-Luciferase report assays on DF-1 overexpressing Sox6 and Nfix and transfected with reporter vectors containing different lengths of 5′-upstream region of MyH1A, Tnnc2, Tnni2 and Tnnt3 (mean ± SEM; ** p < 0.01; n = 6; one-way analysis of variance with Tukey’s multiple comparison test).
Figure 9
Figure 9
The regulation mechanism of Sox6 in satellite cells from fast-type and slow-type muscles. In brief, Sox6 promotes the proliferation and differentiation of PM-MBs and LM-MBs, improves the fast-type fiber formation. The upregulation of Nfix in PM-MTs inhibits the slow-type fiber formation via the collaboration with Sox6. In LM-MTs, Sox6 activates Mef2C transcription to promote the slow-type fiber formation.

References

    1. Schiaffino S., Reggiani C. Fiber Types in Mammalian Skeletal Muscles. Physiol. Rev. 2011;91:1447–1531. doi: 10.1152/physrev.00031.2010. - DOI - PubMed
    1. Bassel-Duby R., Olson E.N. Signaling Pathways in Skeletal Muscle Remodeling. Annu. Rev. Biochem. 2006;75:19–37. doi: 10.1146/annurev.biochem.75.103004.142622. - DOI - PubMed
    1. Chargé S.B.P., Rudnicki M.A. Cellular and Molecular Regulation of Muscle Regeneration. Physiol. Rev. 2004;84:209–238. doi: 10.1152/physrev.00019.2003. - DOI - PubMed
    1. Relaix F., Rocancourt D., Mansouri A., Buckingham M. A Pax3/Pax7-dependent population of skeletal muscle progenitor cells. Nature. 2005;435:948–953. doi: 10.1038/nature03594. - DOI - PubMed
    1. Cheung T.H., Quach N.L., Charville G.W., Ling L., Lidia P., Abdolhossein E., Bryan Y., Phuong H., Rando T.A. Maintenance of muscle stem-cell quiescence by microRNA-489. Nature. 2012;482:524–528. doi: 10.1038/nature10834. - DOI - PMC - PubMed

MeSH terms

Substances