. 2022 Sep 29;23(19):11521.
doi: 10.3390/ijms231911521.

Tumor-Informed Approach Improved ctDNA Detection Rate in Resected Pancreatic Cancer

Affiliations

Tumor-Informed Approach Improved ctDNA Detection Rate in Resected Pancreatic Cancer

Kazunori Watanabe et al. Int J Mol Sci. .

Abstract

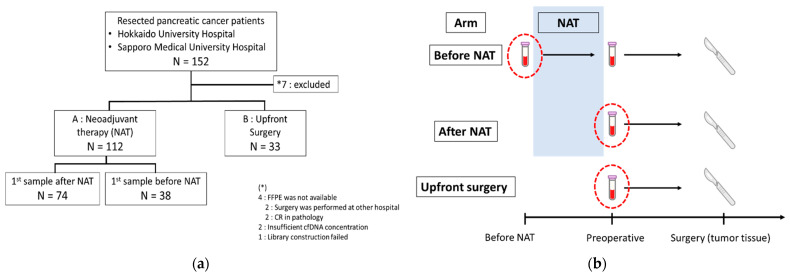
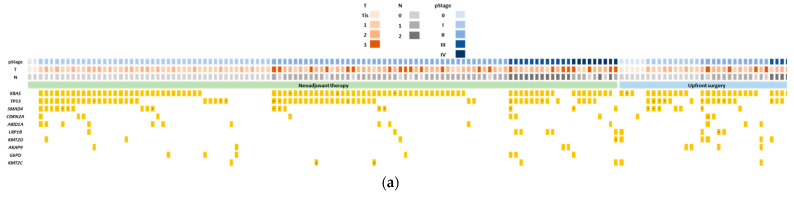
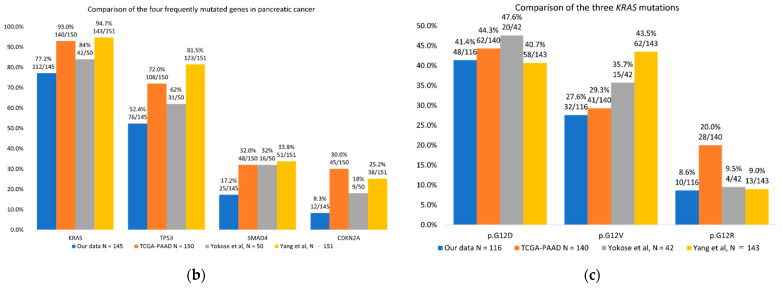
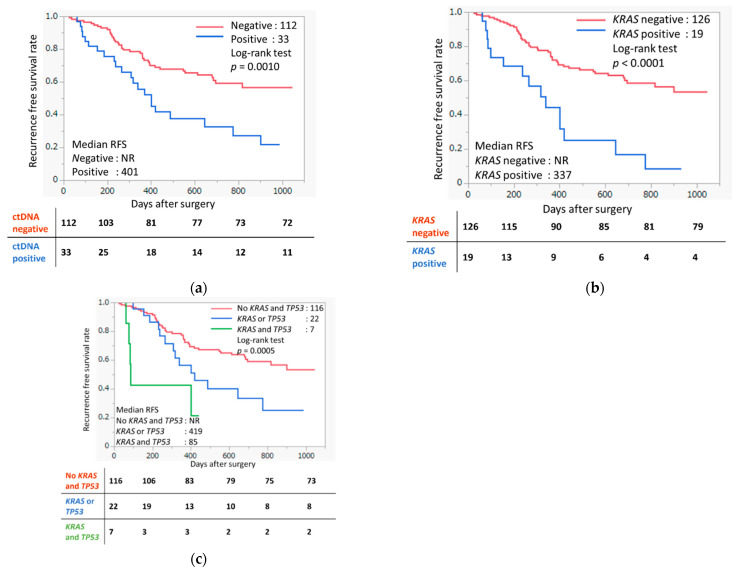
Pancreatic cancer is one of the cancers with very poor prognosis; there is an urgent need to identify novel biomarkers to improve its clinical outcomes. Circulating tumor DNA (ctDNA) from liquid biopsy has arisen as a promising biomarker for cancer detection and surveillance. However, it is known that the ctDNA detection rate in resected pancreatic cancer is low compared with other types of cancer. In this study, we collected paired tumor and plasma samples from 145 pancreatic cancer patients. Plasma samples were collected from 71 patients of treatment-naïve status and from 74 patients after neoadjuvant therapy (NAT). Genomic profiling of tumor DNA and plasma samples was conducted using targeted next-generation sequencing (NGS). Somatic mutations were detected in 85% (123/145) of tumors. ctDNA was detected in 39% (28/71) and 31% (23/74) of treatment-naïve and after-NAT groups, respectively, without referring to the information of tumor profiles. With a tumor-informed approach (TIA), ctDNA detection rate improved to 56% (40/71) and 36% (27/74) in treatment-naïve and after-NAT groups, respectively, with the detection rate significantly improved (p = 0.0165) among the treatment-naïve group compared to the after-NAT group. Cases who had detectable plasma ctDNA concordant to the corresponding tumor showed significantly shorter recurrence-free survival (RFS) (p = 0.0010). We demonstrated that TIA improves ctDNA detection rate in pancreatic cancer, and that ctDNA could be a potential prognostic biomarker for recurrence risk prediction.

Keywords: cancer prognosis; cell-free DNA; circulating tumor DNA; liquid biopsy; neoadjuvant therapy; next-generation sequencing; pancreatic cancer; tumor-informed approach.


Conflict of interest statement

Y.N. is a stockholder and a scientific advisor with OncoTherapy Science, Inc. S.-K.L. is a scientific advisor with Cancer Precision Medicine, Inc. No potential conflict of interest was disclosed by the other authors.

Figures

Figure 1
Figure 1
Patient enrollment and sample collection. (a) The consort flow diagram of patient recruitment; (b) sample collection timepoints of 3 different subgroups.
Figure 2
Figure 2
Genomic landscape of pancreatic cancer using Comprehensive Cancer Panel. (a) Genomic landscape of the 10 most commonly mutated genes in tumor tissue using next-generation sequencing (NGS) in pancreatic cancer. The clinical characteristics of patients are represented by the tiles at the top of the oncoplot, with details stated in the legend. KRAS, TP53, and SMAD4 represent hotspot mutations in the liquid biopsy panel. Asterisk indicates the presence of mutations other than hotspot mutations (detected only in the tumor panel). The percentages of patients harboring KRAS, TP53, and SMAD4 hotspot mutations were 77.2% (112/145), 44.1% (64/145), and 4.8% (7/145), respectively. All mutations below CDKN2A are mutations detected only in the tumor panel. (b) Comparison of gene mutation rates in tumor tissue against The Cancer Genome Atlas (TCGA) data and the two Asian datasets. Four mutated genes known to be commonly mutated in pancreatic cancer are shown. N indicates the number of patients. (c) Comparison of types of KRAS mutation rates in tumor tissue against TCGA data and the two Asian populations. Only the 3 most common mutations are shown. N indicates the number of mutations.
Figure 2
Figure 2
Genomic landscape of pancreatic cancer using Comprehensive Cancer Panel. (a) Genomic landscape of the 10 most commonly mutated genes in tumor tissue using next-generation sequencing (NGS) in pancreatic cancer. The clinical characteristics of patients are represented by the tiles at the top of the oncoplot, with details stated in the legend. KRAS, TP53, and SMAD4 represent hotspot mutations in the liquid biopsy panel. Asterisk indicates the presence of mutations other than hotspot mutations (detected only in the tumor panel). The percentages of patients harboring KRAS, TP53, and SMAD4 hotspot mutations were 77.2% (112/145), 44.1% (64/145), and 4.8% (7/145), respectively. All mutations below CDKN2A are mutations detected only in the tumor panel. (b) Comparison of gene mutation rates in tumor tissue against The Cancer Genome Atlas (TCGA) data and the two Asian datasets. Four mutated genes known to be commonly mutated in pancreatic cancer are shown. N indicates the number of patients. (c) Comparison of types of KRAS mutation rates in tumor tissue against TCGA data and the two Asian populations. Only the 3 most common mutations are shown. N indicates the number of mutations.
Figure 3
Figure 3
Genomic landscape of ctDNA using tumor-informed approach (TIA) from pancreatic cancer. (a) Mutation profiles showing all ctDNA SNVs detected from plasma cfTNA. The clinical characteristics of patients are represented by the tiles at the top of the oncoplot, with details stated in the legend. Mutations are indicated by color in the oncoplot, while numbers signify the number of SNVs for a gene per patient. SNVs that were detected from both plasma and tumor tissue are indicated in green. (b) ctDNA detection rates for the two approaches of the three groups. (c) ctDNA detection rates for the two approaches of the two groups. The detection rate significantly improved among the treatment-naïve group compared to the after-NAT group (p = 0.0165). p-values were calculated using Pearson’s chi-square test. (d) Overall distribution of mutations calculated as number of mutations per gene over the total 120 tumor-derived mutations, detected using TIA.
Figure 4
Figure 4
Association between the ctDNA concordant with tumor and liquid biopsy using NGS and recurrence-free survival (RFS). The differences in RFS were analyzed by log-rank test. The numbers below represent the number of recurrence-free cases at each time point (0, 200, 400, 600, 800, 1000 days). (a) Association between the ctDNA concordant with plasma and tumor and RFS. ctDNA positive cases had significantly shorter RFS than negative cases (p = 0.0010). (b) Association between KRAS detection using tumor-informed approach and RFS. Cases with detectable KRAS ctDNA from liquid biopsy using NGS had significantly shorter RFS (p < 0.0001). (c) Association between KRAS and TP53 detection using tumor-informed approach and RFS. Cases with detectable KRAS and TP53 ctDNA from liquid biopsy using NGS had significantly shorter RFS (p = 0.0005).

References

    1. Siegel R.L., Miller K.D., Fuchs H.E., Jemal A. Cancer Statistics, 2021. CA Cancer J. Clin. 2021;71:7–33. doi: 10.3322/caac.21654. - DOI - PubMed
    1. Yang J., Xu R., Wang C., Qiu J., Ren B., You L. Early screening and diagnosis strategies of pancreatic cancer: A comprehensive review. Cancer Commun. 2021;41:1257–1274. doi: 10.1002/cac2.12204. - DOI - PMC - PubMed
    1. Vincent A., Herman J., Schulick R., Hruban R.H., Goggins M. Pancreatic cancer. Lancet. 2011;378:607–620. doi: 10.1016/S0140-6736(10)62307-0. - DOI - PMC - PubMed
    1. Groot V.P., Rezaee N., Wu W., Cameron J.L., Fishman E.K., Hruban R.H., Weiss M.J., Zheng L., Wolfgang C.L., He J. Patterns, Timing, and Predictors of Recurrence Following Pancreatectomy for Pancreatic Ductal Adenocarcinoma. Ann. Surg. 2018;267:936–945. doi: 10.1097/SLA.0000000000002234. - DOI - PubMed
    1. Rahib L., Smith B.D., Aizenberg R., Rosenzweig A.B., Fleshman J.M., Matrisian L.M. Projecting cancer incidence and deaths to 2030: The unexpected burden of thyroid, liver, and pancreas cancers in the United States. Cancer Res. 2014;74:2913–2921. doi: 10.1158/0008-5472.CAN-14-0155. - DOI - PubMed

MeSH terms