. 2022 Sep 30;23(19):11566.
doi: 10.3390/ijms231911566.

Archaea Microbiome Dysregulated Genes and Pathways as Molecular Targets for Lung Adenocarcinoma and Squamous Cell Carcinoma

Affiliations

Archaea Microbiome Dysregulated Genes and Pathways as Molecular Targets for Lung Adenocarcinoma and Squamous Cell Carcinoma

Matthew Uzelac et al. Int J Mol Sci. .

Abstract

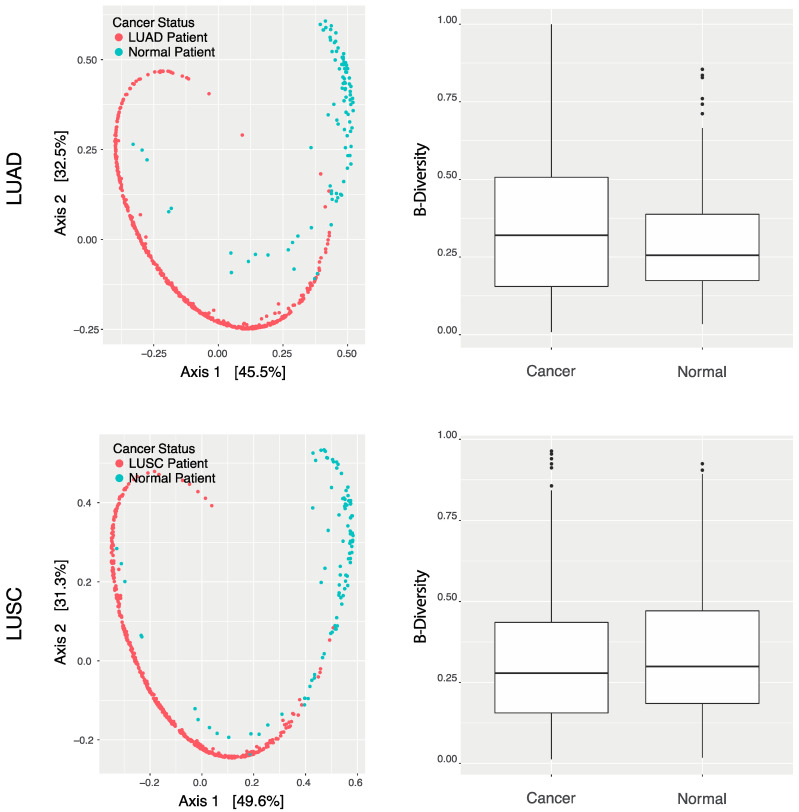
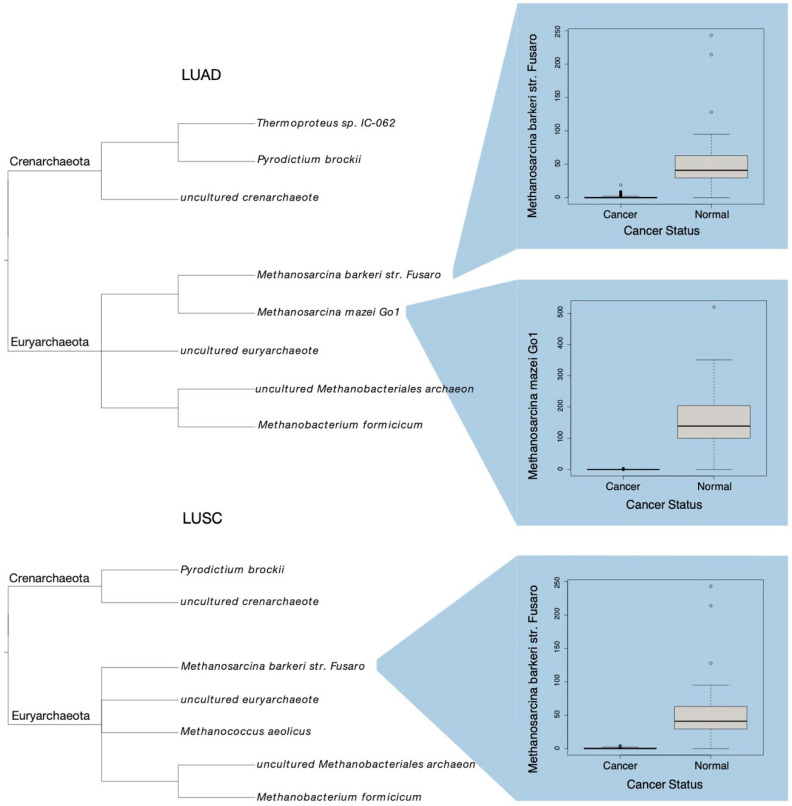
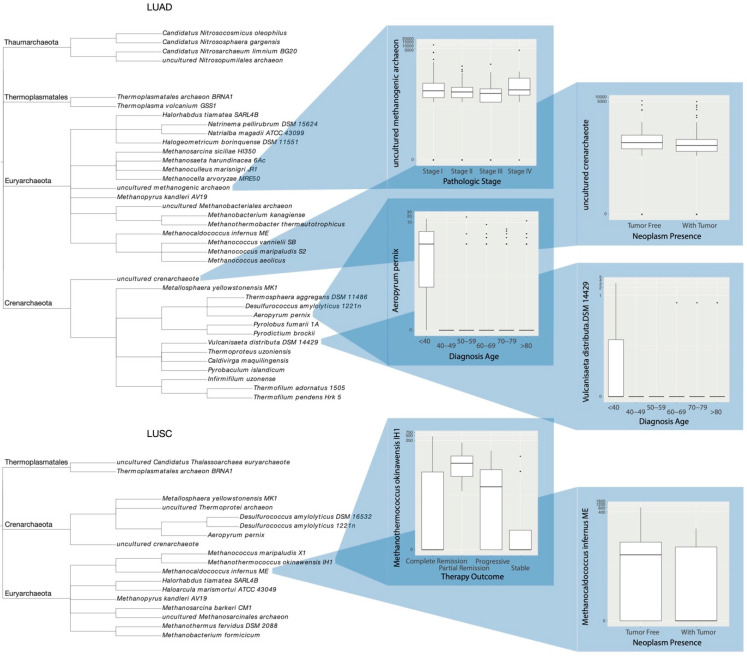
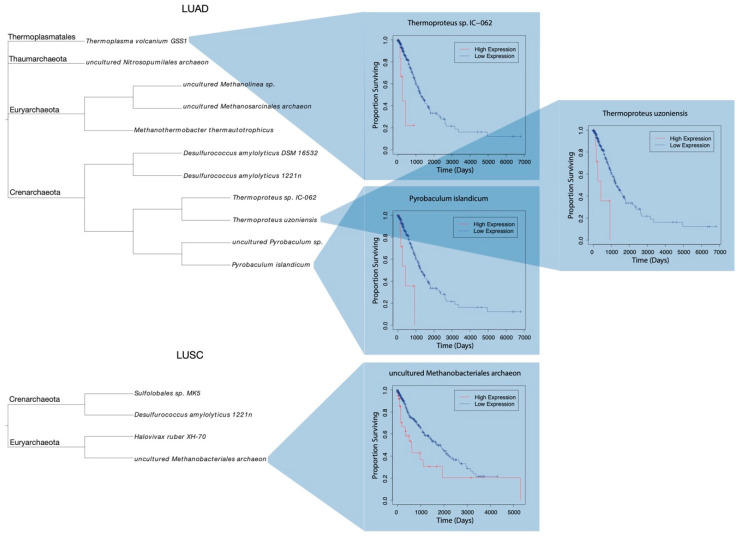
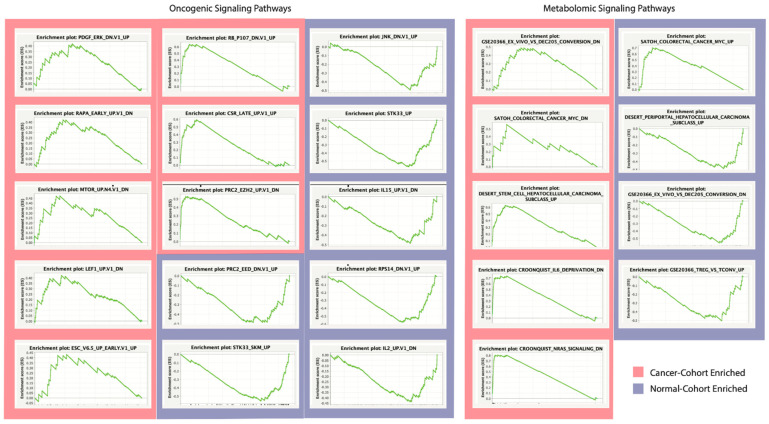
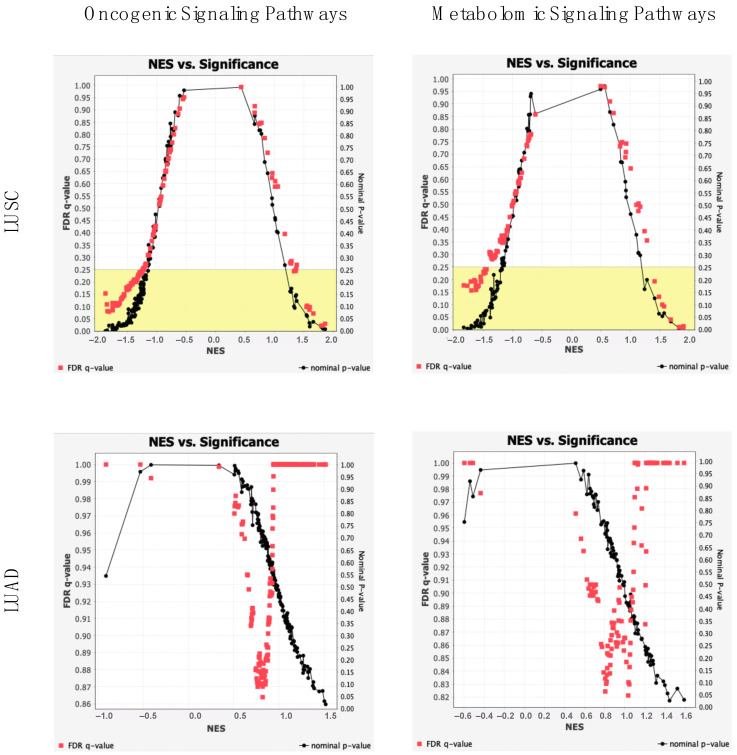
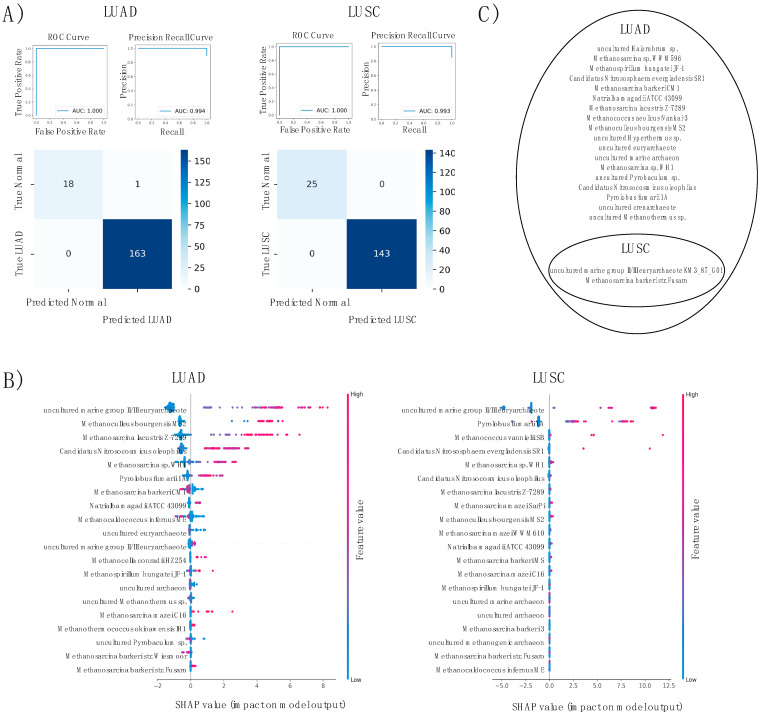
The human microbiome is a vast collection of microbial species that exist throughout the human body and regulate various bodily functions and phenomena. Of the microbial species that exist in the human microbiome, those within the archaea domain have not been characterized to the extent of those in more common domains, despite their potential for unique metabolic interaction with host cells. Research has correlated tumoral presence of bacterial microbial species to the development and progression of lung cancer; however, the impacts and influences of archaea in the microbiome remain heavily unexplored. Within the United States lung cancer remains highly fatal, responsible for over 100,000 deaths every year with a 5-year survival rate of roughly 22.9%. This project attempts to investigate specific archaeal species' correlation to lung adenocarcinoma (LUAD) and lung squamous cell carcinoma (LUSC) incidence, patient staging, death rates across individuals of varying ages, races, genders, and smoking-statuses, and potential molecular targets associated with archaea microbiome. Archaeal species abundance was assessed across lung tissue samples of 527 LUAD patients, 479 LUSC patients, and 99 healthy individuals. Nine archaeal species were found to be of significantly altered abundance in cancerous samples as compared to normal counterparts, 6 of which are common to both LUAD and LUSC subgroups. Several of these species are of the taxonomic class Thermoprotei or the phylum Euryarchaeota, both known to contain metabolic processes distinct from most bacterial species. Host-microbe metabolic interactions may be responsible for the observed correlation of these species' abundance with cancer incidence. Significant microbes were correlated to patient gene expression to reveal genes of altered abundance with respect to high and low archaeal presence. With these genes, cellular oncogenic signaling pathways were analyzed for enrichment across cancer and normal samples. In comparing gene expression between LUAD and adjacent normal samples, 2 gene sets were found to be significantly enriched in cancers. In LUSC comparison, 6 sets were significantly enriched in cancer, and 34 were enriched in normals. Microbial counts across healthy and cancerous patients were then used to develop a machine-learning based predictive algorithm, capable of distinguishing lung cancer patients from healthy normal with 99% accuracy.

Keywords: GSEA: Gene Set Enrichment Analysis; LUAD: lung adenocarcinoma; LUSC lung squamous cell carcinoma; NES: normalized enrichment score; RFE: recursive feature elimination; ROS: reactive oxygen species; SHAP: SHapley Additive exPlanations; TCGA: the Cancer Genome Atlas.


Conflict of interest statement

The authors declare no conflict of interest or personal relationships that could have appeared to influence the work reported in this paper.

Figures

Figure 1
Figure 1
Wholistic lung sample microbiome analysis. Multidimensional Scaling Bray–Curtis Ordination plots of LUAD and LUSC (red), and normal patient (turquoise) microbial landscapes. Bar chart of β-diversities of all mapped species by LUAD, LUSC, and normal samples.
Figure 2
Figure 2
Phylograms of species differentially abundant in LUAD and LUSC samples, as compared to normal adjacent samples. Respective taxonomic phylums are shown. Select box plots of species abundance in cancer samples versus normal samples.
Figure 3
Figure 3
Phylograms of species differentially abundant among LUAD and LUSC samples, with respect to patient clinical categorization. Respective taxonomic phylums are shown. Select box plots of species abundance by samples of varying clinical status.
Figure 4
Figure 4
Phylograms of species differentially abundant among LUAD and LUSC samples, with respect to patient clinical categorization. Respective taxonomic phylums are shown. Patients were classified as “high” or “low” abundance of a species. Select Kaplan–Meier survival plots of proportion of “high” and “low” abundance patients surviving with time.
Figure 5
Figure 5
GSEA Enrichment Plots. Gene sets significantly enriched in cancer sample cohorts (red) or normal sample cohorts (blue), with enrichment score magnitude and direction. Division of oncogenic associated and metabolomic associated signaling pathways of enrichment dysregulation. Signaling pathways of the largest peak height exhibit the greatest extent of dysregulation.
Figure 6
Figure 6
GSEA Significance Plots. Displays of pathway NESs with associated nominal p-values (black) and FDR q-values (red) for LUAD and LUSC analyses. Division of oncogenic associated and metabolomic associated signaling pathways. Signaling pathways of the left and right extremes of graphs exhibit the greatest extent of dysregulation, while signaling pathways of the bottom portion are of the greatest significance. Yellow shaded region signifies q-values below 0.25.
Figure 7
Figure 7
Machine learning classification of LUAD and LUSC. (A) ROC, precision recall curve and confusion matrix. Classifiers of the largest AUC, with values between 0 and 1, exhibit the greatest predictive accuracy. (B) SHAP values breakdown of two trained models. Features of the largest SHAP values are of greatest influence to the models’ predictive means. (C) Remaining features after RFE by cancer type. Most significant species to model prediction succeeding elimination.

References

    1. Gilbert J.A., Blaser M.J., Caporaso J.G., Jansson J.K., Lynch S.V., Knight R. Current understanding of the human microbiome. Nat. Med. 2018;24:392–400. doi: 10.1038/nm.4517. - DOI - PMC - PubMed
    1. Rajagopala S.V., Vashee S., Oldfield L.M., Suzuki Y., Venter J.C., Telenti A., Nelson K.E. The Human Microbiome and Cancer. Cancer Prev. Res. 2017;10:226–234. doi: 10.1158/1940-6207.CAPR-16-0249. - DOI - PubMed
    1. Wong-Rolle A., Wei H.K., Zhao C., Jin C. Unexpected guests in the tumor microenvironment: Microbiome in cancer. Protein Cell. 2021;12:426–435. doi: 10.1007/s13238-020-00813-8. - DOI - PMC - PubMed
    1. Elinav E., Garrett W.S., Trinchieri G., Wargo J. The cancer microbiome. Nat. Rev. Cancer. 2019;19:371–376. doi: 10.1038/s41568-019-0155-3. - DOI - PMC - PubMed
    1. Lü J.M., Lin P.H., Yao Q., Chen C. Chemical and molecular mechanisms of antioxidants: Experimental approaches and model systems. J. Cell. Mol. Med. 2010;14:840–860. doi: 10.1111/j.1582-4934.2009.00897.x. - DOI - PMC - PubMed

LinkOut - more resources