. 2022 Oct 2;23(19):11678.
doi: 10.3390/ijms231911678.

Resveratrol Mitigates Oxygen and Glucose Deprivation-Induced Inflammation, NLRP3 Inflammasome, and Oxidative Stress in 3D Neuronal Culture

Affiliations

Resveratrol Mitigates Oxygen and Glucose Deprivation-Induced Inflammation, NLRP3 Inflammasome, and Oxidative Stress in 3D Neuronal Culture

Ming-Chang Chiang et al. Int J Mol Sci. .

Abstract

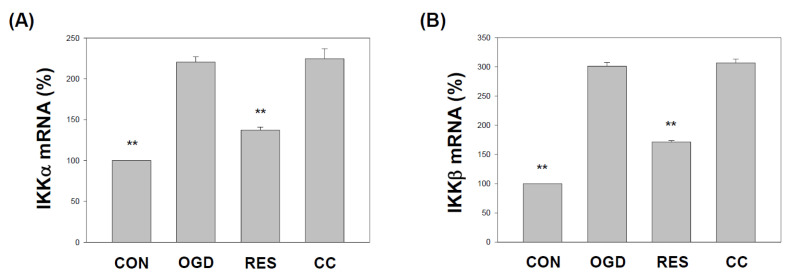
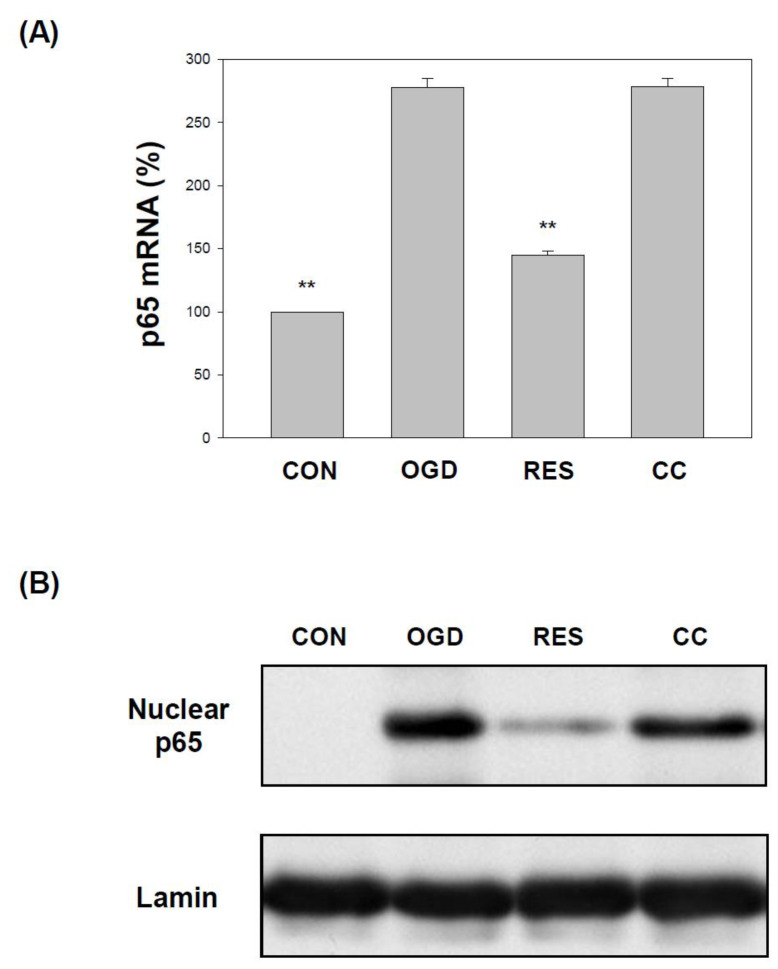
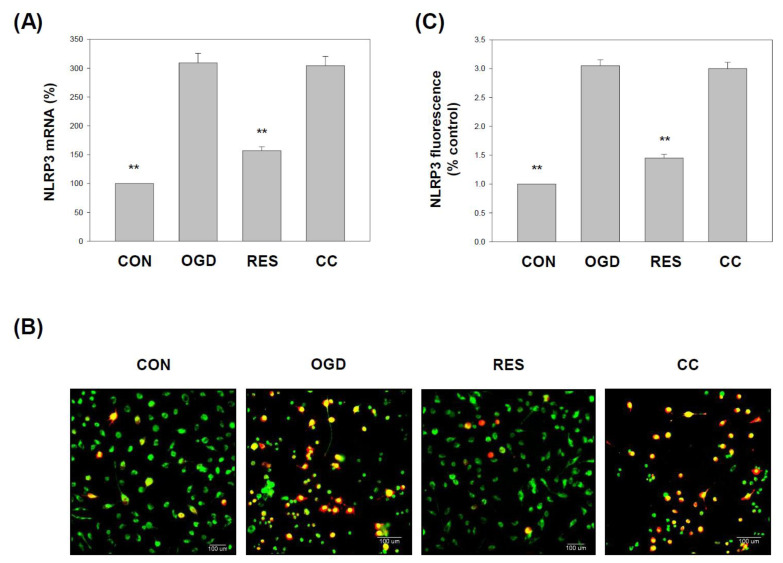
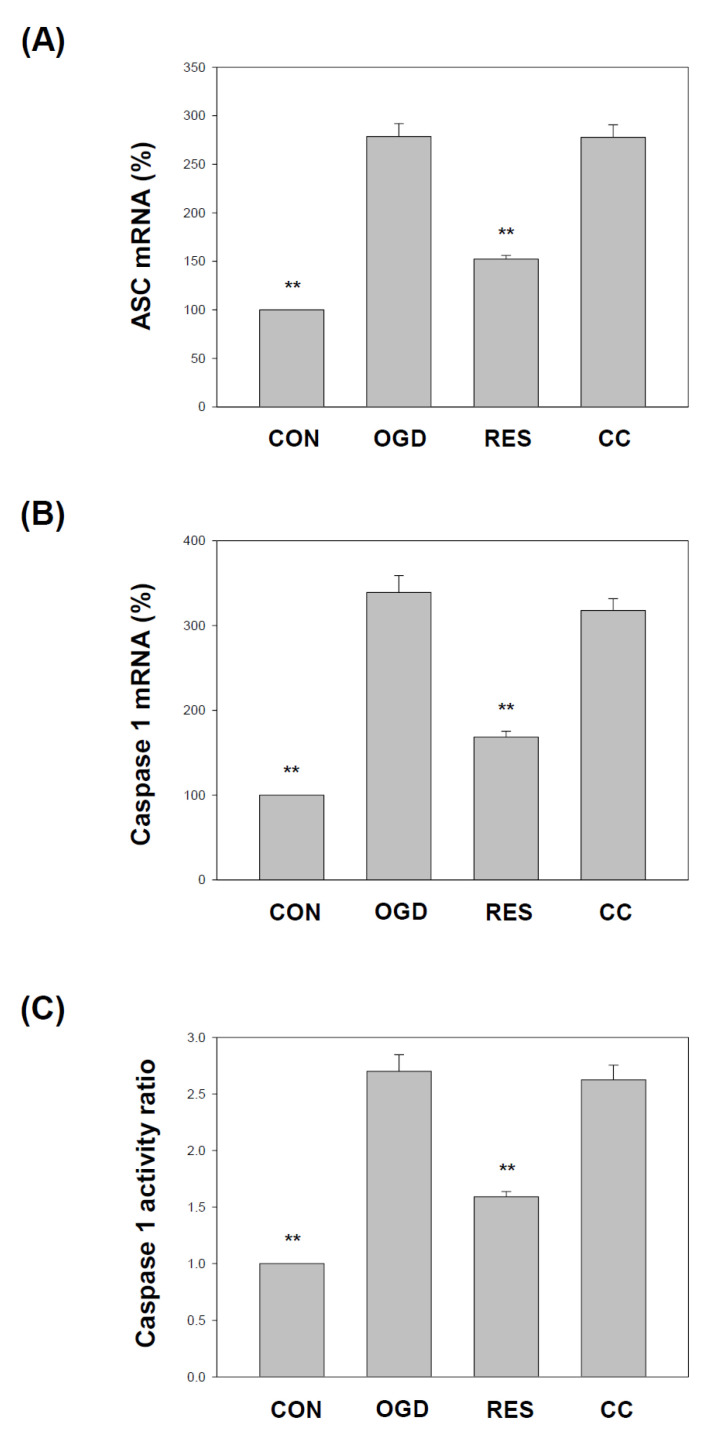
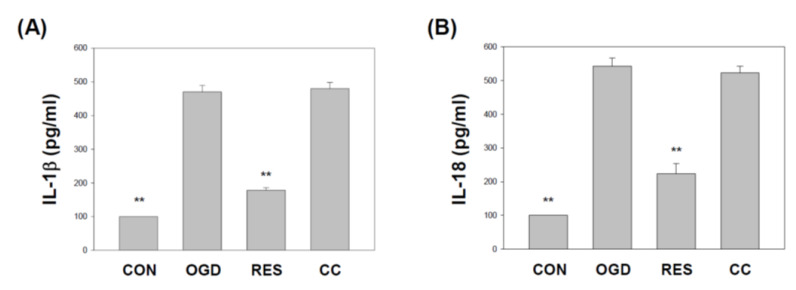
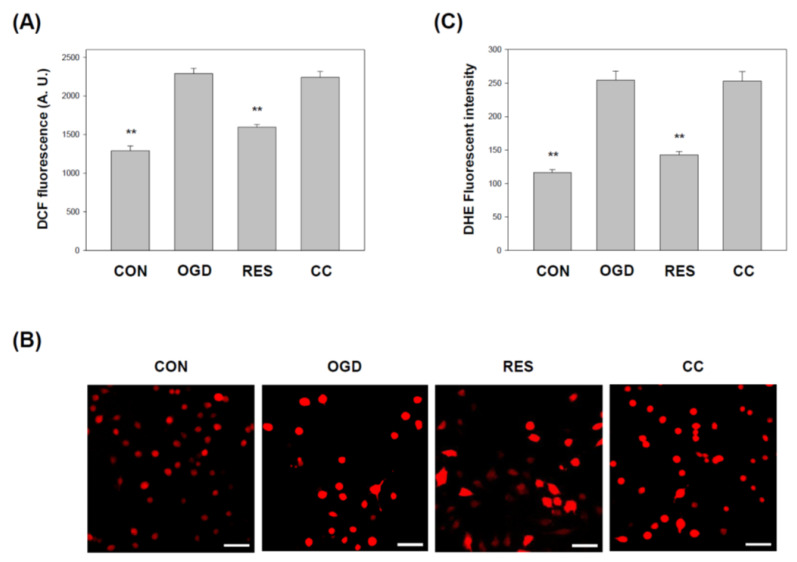
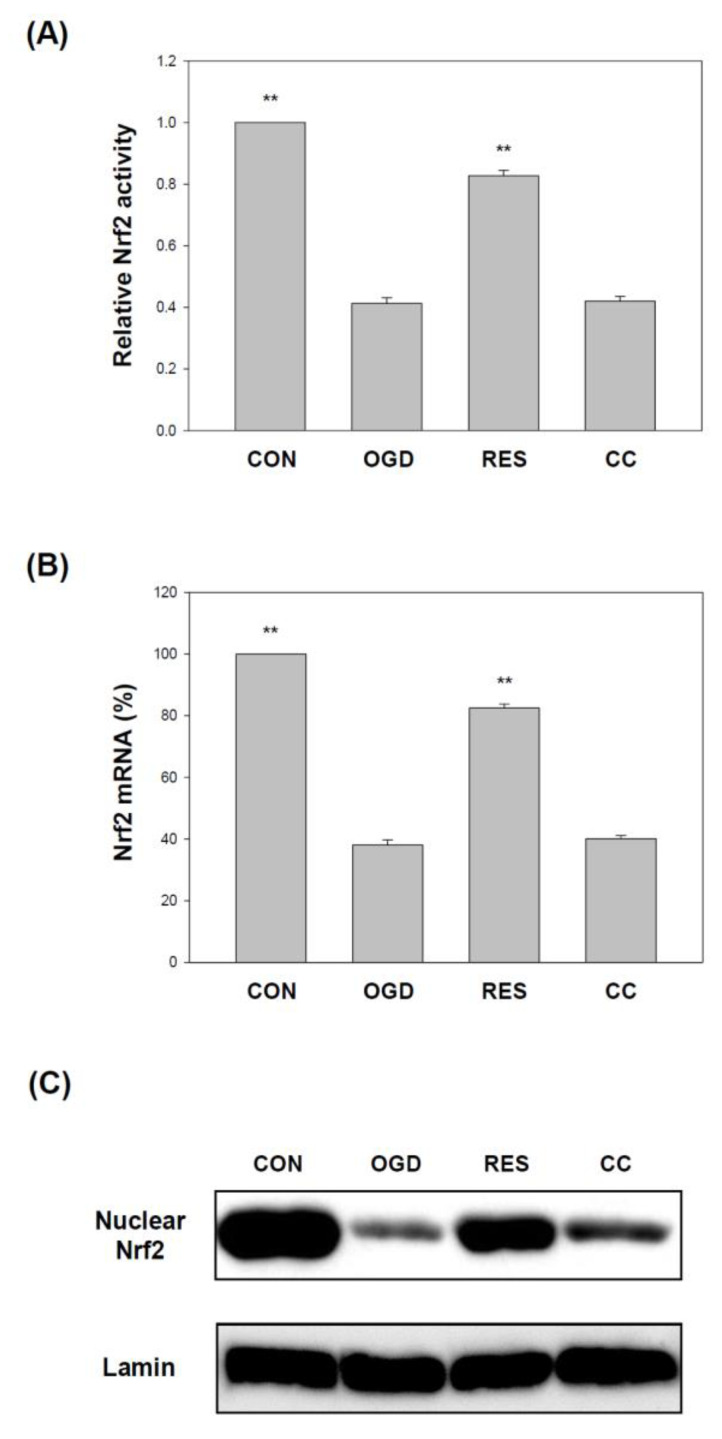
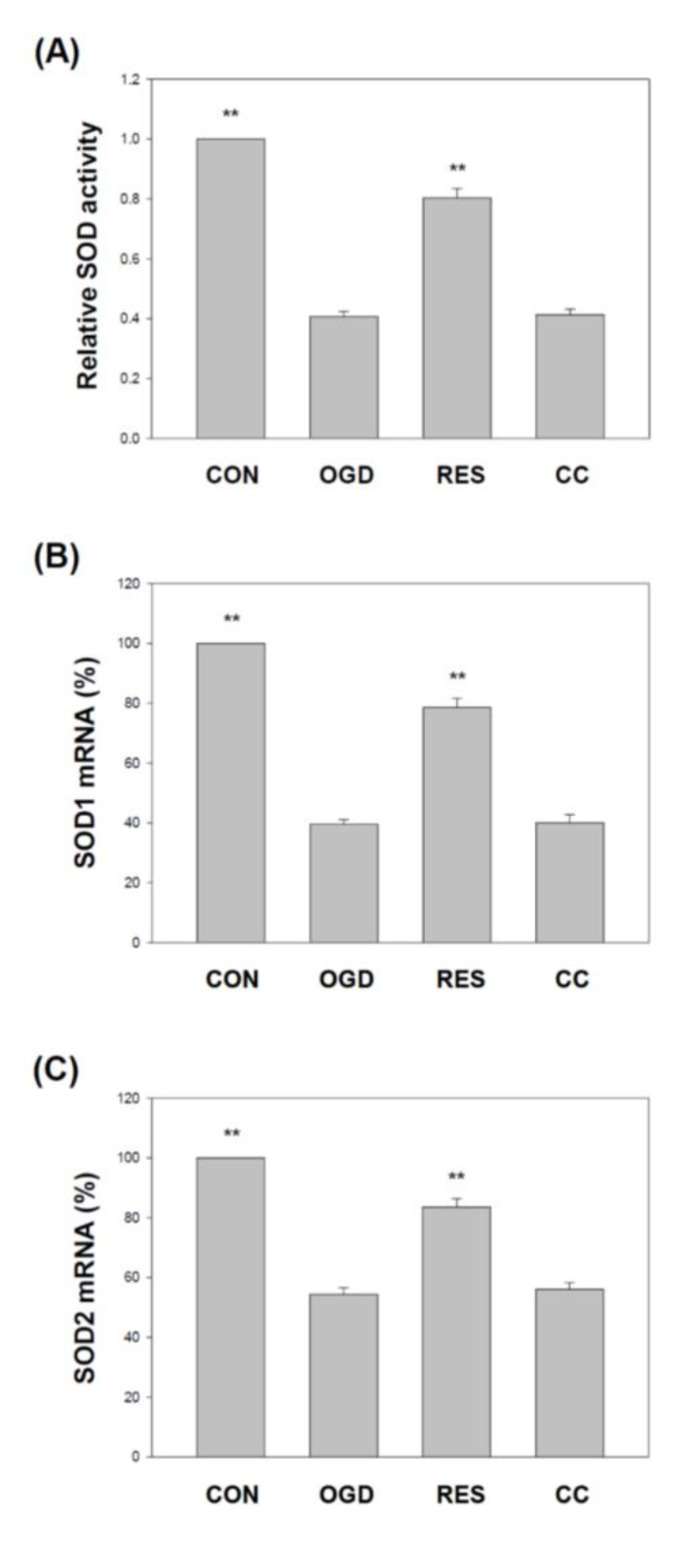
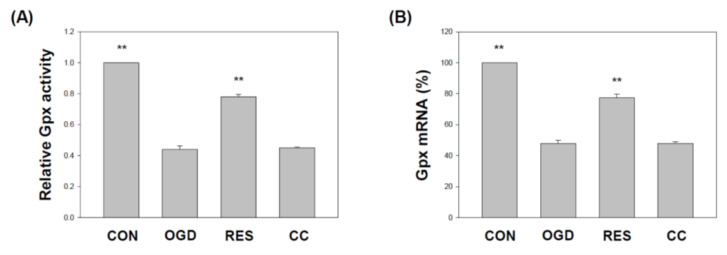
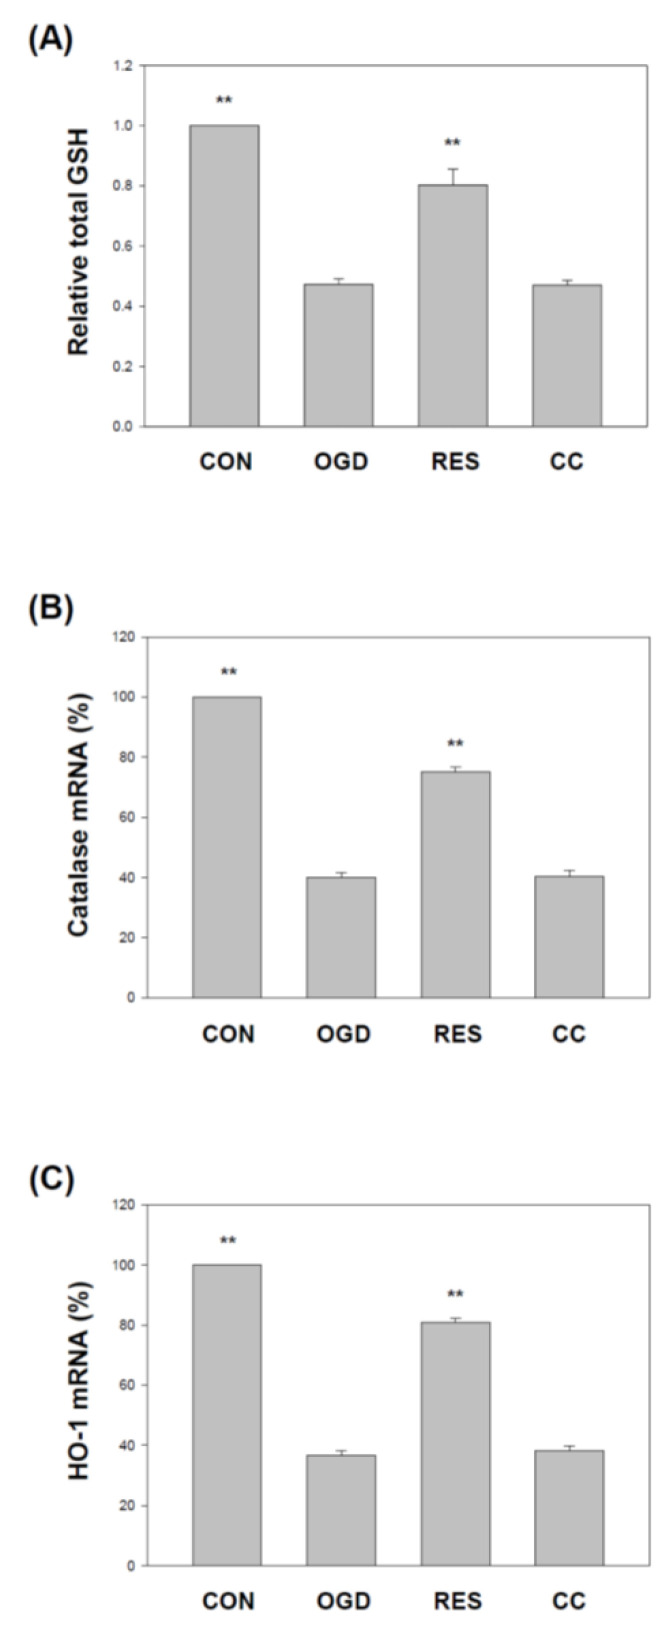
Oxygen glucose deprivation (OGD) can produce hypoxia-induced neurotoxicity and is a mature in vitro model of hypoxic cell damage. Activated AMP-activated protein kinase (AMPK) regulates a downstream pathway that substantially increases bioenergy production, which may be a key player in physiological energy and has also been shown to play a role in regulating neuroprotective processes. Resveratrol is an effective activator of AMPK, indicating that it may have therapeutic potential as a neuroprotective agent. However, the mechanism by which resveratrol achieves these beneficial effects in SH-SY5Y cells exposed to OGD-induced inflammation and oxidative stress in a 3D gelatin scaffold remains unclear. Therefore, in the present study, we investigated the effect of resveratrol in 3D gelatin scaffold cells to understand its neuroprotective effects on NF-κB signaling, NLRP3 inflammasome, and oxidative stress under OGD conditions. Here, we show that resveratrol improves the expression levels of cell viability, inflammatory cytokines (TNF-α, IL-1β, and IL-18), NF-κB signaling, and NLRP3 inflammasome, that OGD increases. In addition, resveratrol rescued oxidative stress, nuclear factor-erythroid 2 related factor 2 (Nrf2), and Nrf2 downstream antioxidant target genes (e.g., SOD, Gpx GSH, catalase, and HO-1). Treatment with resveratrol can significantly normalize OGD-induced changes in SH-SY5Y cell inflammation, oxidative stress, and oxidative defense gene expression; however, these resveratrol protective effects are affected by AMPK antagonists (Compounds C) blocking. These findings improve our understanding of the mechanism of the AMPK-dependent protective effect of resveratrol under 3D OGD-induced inflammation and oxidative stress-mediated cerebral ischemic stroke conditions.

Keywords: 3D scaffold; inflammation; oxidative stress; oxygen-glucose deprivation; resveratrol.


Conflict of interest statement

The authors declare no conflict of interest.

Figures

Figure 1
Figure 1
Resveratrol rescues OGD-mediated cell viability and TNF-α under the 3D scaffold. The cells were treated with OGD under the scaffold for 24 h and then treated with 10 μM resveratrol (AMPK activator) or 10 μM Compound C (AMPK antagonist) for another 48 h. The cell experiment under the scaffold was divided into four groups: (1) Control (CON) group represents cells with no treatment, cultured in a new medium for 72 h; (2) OGD group represents cells treated with OGD for 24 h, then exchanged with the new medium for another 48 h; (3) Resveratrol (RES) group, represents cells treated with OGD for 24 h, then exchanged the new medium with 10 μM Resveratrol for another 48 h; and (4) Compound C (CC) group represents cells treated with OGD for 24 h, then treated then exchanged the new medium with 10 μM Compound C and 10 μM Resveratrol for another 48 h. (A) Cell viability was detected by an SRB assay. (B) The cell culture supernatant was harvested, and ELISA measured the secretion of TNF-α. Values are expressed as percentages of the indicated level in CON and are presented as the mean ± SEM values from three independent experiments. Specific comparison to the indicated SH-SY5Y cells with OGD ** p < 0.001 vs. cells with OGD.
Figure 2
Figure 2
Resveratrol rescues IKKα and IKKβ mRNA expression in OGD-induced cells within a 3D scaffold. The cell experiments under the scaffolds were divided into four groups, as described in Figure 1 and the methods section. Use qPCR to analyze IKKα (A) and IKKβ (B) mRNA transcripts. Collect total RNA from SH-SY5Y cells and reverse transcribe it into cDNA. Next, perform qPCR on the specified gene and normalize it to GAPDH expression. The value is expressed as a percentage of the transcript established in CON and described as the mean ± SEM value from three independent experiments. Specific comparison to the indicated SH-SY5Y cells with OGD ** p < 0.001 vs. cells with OGD.
Figure 3
Figure 3
Resveratrol normalizes p65 levels in the OGD-induced cells in the 3D scaffold. The cell experiments under the scaffolds were divided into four groups, as described in Figure 1 and the methods section. (A) qPCR was used to analyze the p65 mRNA level in each treatment group. Collect total RNA from cells and reverse transcribe it into cDNA. Perform qPCR on the specified gene and normalize it to GAPDH expression. The value is expressed as a percentage of the transcript established in CON and the mean ± SEM value from three independent experiments. (B) Collect nuclear components (20 μg per lane) from the specified conditions and perform the level of p65 protein by a Western blot analysis. The value is expressed as the percentage of SH-SY5Y cells treated with OGD and described as the mean ± SEM value from three independent experiments. Specific comparison to the indicated SH-SY5Y cells with OGD ** p < 0.001 vs. cells with OGD.
Figure 4
Figure 4
Resveratrol normalizes NLRP3 levels in OGD-induced cells in the 3D scaffold. The cell experiments under the scaffolds were divided into four groups, as described in Figure 1 and the methods section. (A) qPCR was used to analyze the NLRP3 mRNA level in each treatment group. Collect total RNA from the cells and reverse transcribe it into cDNA. Perform qPCR on the specified gene and normalize it to GAPDH expression. (B) Immunostaining of the cells was performed using anti-NLRP3 and anti-MAP2 antibodies. NLRP3 was visualized using the Avidin-Alexa Fluor® 568 (red)-conjugated secondary antibody. MAP2 was visualized using Avidin-Alexa Fluor® 488 (green)-conjugated secondary antibody. A representative image of three independent experiments is shown. Scale bar: 100 μm. (C) The fluorescence intensity of the immunostaining was quantified. The value is expressed as a percentage of the transcript established in CON and the mean ± SEM value from three independent experiments. Specific comparison to the indicated SH-SY5Y cells with OGD ** p < 0.001 vs. cells with OGD.
Figure 5
Figure 5
Resveratrol improves the ASC and Caspase 1 levels in OGD-induced cells in the 3D scaffold. The cell experiments under the scaffolds were divided into four groups, as described in Figure 1 and the methods section. Use qPCR to analyze ASC (A) and Caspase 1 (B) mRNA transcripts. Collect total RNA from SH-SY5Y cells and reverse transcribe it into cDNA. Perform qPCR on the specified gene and normalize it to GAPDH expression. (C) Caspase 1 activity was detected by a fluorometric protease assay using substrate YVAD-AFC (AFC: 7-amino-4-trifluoromethyl coumarin). The value is expressed as a percentage of the transcript established in CON and the mean ± SEM value from three independent experiments. Specific comparison to the indicated SH-SY5Y cells with OGD ** p < 0.001 vs. cells with OGD.
Figure 6
Figure 6
Resveratrol normalizes OGD-induced of IL-1β and IL-18 under the 3D scaffold. The cell experiments under the scaffolds were divided into four groups, as described in Figure 1 and the methods section. The cell culture supernatant was harvested, and ELISA measured the secretion of IL-1β (A) and IL-18 (B). Values are expressed as percentages of the indicated level in CON and are presented as the mean ± SEM values from three independent experiments. Specific comparison to the indicated SH-SY5Y cells with OGD ** p < 0.001 vs. cells with OGD.
Figure 7
Figure 7
Resveratrol normalized cell-induced oxidative stress by OGD in 3D scaffolds. The cell experiments under the scaffolds were divided into four groups, as described in Figure 1 and the methods section. (A) The lysate harvested from the specified conditions was subjected to ROS determination by DCFH-DA. (B) Collect cells to show a typical photomicrograph of DHE dye (red). Scale bar: 100 μm. (C) Quantitative data generated by ROS evaluated by DHE fluorescence intensity is normalized to cell number data. Values are expressed as percentages of the indicated level in CON and are presented as the mean ± SEM values from three independent experiments. Specific comparison to the indicated SH-SY5Y cells with OGD ** p < 0.001 vs. cells with OGD.
Figure 8
Figure 8
Resveratrol normalized Nrf2 activity and genes by OGD in 3D scaffolds. The cell experiments under the scaffolds were divided into four groups, as described in Figure 1 and in the methods section. The Nrf2 level was detected by the Nrf2 transcription factor assay (A). (B) qPCR was used to analyze the Nrf2 mRNA level in each treatment group. (C) Collect nuclear components (20 μg per lane) from the specified conditions and perform the level of Nrf2 protein by Western blot analysis. Values are expressed as percentages of the indicated level in CON and are presented as the mean ± SEM values from three independent experiments. Specific comparison to the indicated SH-SY5Y cells with OGD ** p < 0.001 vs. cells with OGD.
Figure 9
Figure 9
Resveratrol rescues SOD activity and gene expression by OGD in 3D scaffolds. The cell experiments under the scaffolds were divided into four groups, as described in Figure 1 and the methods section. SOD activity was detected by a SOD activity assay (A). qPCR was used to analyze each treatment group’s SOD1 (B) and SOD2 (C) mRNA levels. Values are expressed as percentages of the indicated level in CON and are presented as the mean ± SEM values from three independent experiments. Specific comparison to the indicated SH-SY5Y cells with OGD ** p < 0.001 vs. cells with OGD.
Figure 10
Figure 10
Resveratrol rescues Gpx activity and gene expression by OGD in 3D scaffolds. The cell experiments under the scaffolds were divided into four groups, as described in Figure 1 and the methods section. Gpx activity was detected by the Gpx activity colorimetric method (A). (B) qPCR was used to analyze the Gpx mRNA level in each treatment group. Values are expressed as percentages of the indicated level in CON and are presented as the mean ± SEM values from three independent experiments. Specific comparison to the indicated SH-SY5Y cells with OGD ** p < 0.001 vs. cells with OGD.
Figure 11
Figure 11
Resveratrol normalized GSH levels, catalase, and HO-1 gene expression by OGD in 3D scaffolds. The cell experiments under the scaffolds were divided into four groups, as described in Figure 1 and the methods section. GSH levels were detected using the Glutathione Colorimetric Assay Kit (A). qPCR was used to analyze each treatment group’s catalase (B) and HO-1 (C) mRNA levels. Values are expressed as percentages of the indicated level in CON and are presented as the mean ± SEM values from three independent experiments. Specific comparison to the indicated SH-SY5Y cells with OGD ** p < 0.001 vs. cells with OGD.

References

    1. Katan M., Luft A. Global Burden of Stroke. Semin. Neurol. 2018;38:208–211. doi: 10.1055/s-0038-1649503. - DOI - PubMed
    1. Donkor E.S. Stroke in the 21(st) Century: A Snapshot of the Burden, Epidemiology, and Quality of Life. Stroke Res. Treat. 2018;2018:3238165. - PMC - PubMed
    1. Boehme A.K., Esenwa C., Elkind M.S. Stroke Risk Factors, Genetics, and Prevention. Circ. Res. 2017;120:472–495. doi: 10.1161/CIRCRESAHA.116.308398. - DOI - PMC - PubMed
    1. Barthels D., Das H. Current advances in ischemic stroke research and therapies. Biochim. Biophys. Acta Mol. Basis Dis. 2020;1866:165260. doi: 10.1016/j.bbadis.2018.09.012. - DOI - PMC - PubMed
    1. Kuriakose D., Xiao Z. Pathophysiology and Treatment of Stroke: Present Status and Future Perspectives. Int. J. Mol. Sci. 2020;21:7609. doi: 10.3390/ijms21207609. - DOI - PMC - PubMed

MeSH terms