. 2022 Oct 4;23(19):11745.
doi: 10.3390/ijms231911745.

Augmented CPT1A Expression Is Associated with Proliferation and Colony Formation during Barrett's Tumorigenesis

Affiliations

Augmented CPT1A Expression Is Associated with Proliferation and Colony Formation during Barrett's Tumorigenesis

Joshua N Bernard et al. Int J Mol Sci. .

Abstract

Obesity is a known risk factor for the development of gastroesophageal reflux disease (GERD), Barrett's Esophagus (BE) and the progression to esophageal adenocarcinoma. The mechanisms by which obesity contributes to GERD, BE and its progression are currently not well understood. Recently, changes in lipid metabolism especially in the context of a high fat diet have been linked to GERD and BE leading us to explore whether fatty acid oxidation plays a role in the disease progression from GERD to esophageal adenocarcinoma. To that end, we analyzed the expression of the rate-limiting enzyme, carnitine palmytoyltransferase 1A (CPT1A), in human tissues and cell lines representing different stages in the sequence from normal squamous esophagus to cancer. We determined uptake of palmitic acid, the most abundant fatty acid in human serum, with fluorescent dye-labeled lipids as well as functional consequences of stimulation with palmitic acid relevant to Barrett's tumorigenesis, e.g., proliferation, characteristics of stemness and IL8 mediated inflammatory signaling. We further employed different mouse models including a genetic model of Barrett's esophagus based on IL1β overexpression in the presence and absence of a high fat diet and deoxycholic acid to physiologically mimic gastrointestinal reflux in the mice. Together, our data demonstrate that CPT1A is upregulated in Barrett's tumorigenesis and that experimental palmitic acid is delivered to mitochondria and associated with increased cell proliferation and stem cell marker expression.

Keywords: fatty acid oxidation; gastroesophageal reflux diseases (GERD); high fat diet; inflammation; obesity.


Conflict of interest statement

The authors declare no conflict of interest.

Figures

Figure 1
Figure 1
Expression of CPT1A is increased in the sequence from normal esophageal squamous epithelium to BE and EAC. (a) Comparison of CPT1 component expression and CD36 between normal esophagus (NE), Barrett’s esophagus (BE) and gastric cardia (GC) using the GSE34619 dataset (8 patients normal squamous, 10 with BE and 10 gastric cardia). * p < 0.05 Student’s t-test (b). Expression of CPT1A, CPT1B and CD36 in normal esophagus (NE), Barrett’s esophagus (BE) and esophageal adenocarcinoma (EAC) tissues in the publically available dataset GDS1321/GSE1420;8 patients with Barrett’s associated adenocarcinomas. (c) Composite score and quantification of immunofluorescent staining using antibody against CPT1A in normal esophagus (NE), Barrett’s esophagus (BE) and esophageal adenocarcinoma (EAC) and matching normal adjacent tissues (NA). (d) Representative images of CPT1A immunofluorescence staining. * p < 0.05, Student’s t-test.
Figure 2
Figure 2
CPT1A is expressed in the esophagus and protein upregulated in the progression to EAC. (a) qRT-PCR with primers for CPT1A amplification was performed using RNA extracted from normal immortalized esophageal keratinocytes (STR), bile/acid-tolerant STRs, the Barrett’s esophagus cell lines, CPA and BAR-T, as well as esophageal adenocarcinoma cell lines (OE33 and FLO1) was evaluated. RNA expression is increased in EAC cells. (b) Protein was extracted from cell lysates and detected with antibody against CPT1A by Western Blot, showing an increased expression in bile/acid-tolerant STRs, BAR-T and BAR10T as well as EAC cell lines (OE19, OE33 and FLO1) compared to normal.
Figure 3
Figure 3
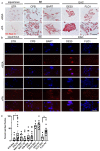
Palmitic acid uptake can be detected in esophageal epithelial cells. (a) The Oil Red O stain shows a general presence of lipids in STR, CPB and BAR-T cells as well as the EAC cell lines, OE33 and FLO1. (b) The fluorescent red signal using LipidSpotTM for the detection of neutral lipids is observed in the BE cell lines, CPB and BAR-T, and EAC cells, OE33 and FLO1 after treatment with 30 µM palmitic acid for 90 min compared to BSA control, DAPI for nuclear stain. (c) Lipidspot-positive cells were counted per field and compared to total nuclei for quantification. * p < 0.05, ** p < 0.01, t-test with Welch’s correction.
Figure 4
Figure 4
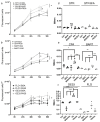
Palmitic acid promotes proliferation and increases the capacity for colony formation in EAC. Cell proliferation was determined using the CellTiter assay showing that stimulation with 30 µM palmitic assay increases growth significantly compared to BSA control in bile/acid-tolerant STR but not normal esophageal STR (a). (b) The proliferation of BE cell lines, CPA and BAR-T, is enhanced with 30 µM palmitic acid, so is cell growth in esophageal adenocarcinoma cell lines compared to BSA control (c). Crystal violet stain was quantified for colony formation of STR and STR B/A (d), BE (e) and EAC (f) cell lines. STR and STR B/A did not form measurable colonies, but colony formation is significantly increased in CPA, BAR-T and OE33 cells upon stimulation with 30 µM PA. There is a trend for augmented colony formation in the FLO cells, but it is not significant. * p < 0.05; ** p < 0.01; *** p < 0.001; **** p < 0.0001.
Figure 5
Figure 5
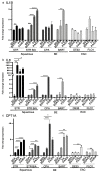
PA stimulates IL1B, IL8 and CPT1A and upregulation in the progression to EAC. RNA expression was determined by qRT-PCR with primers for the inflammatory cytokines IL1B and IL8 and CPT1A. (a) Palmitic acid increased the expression of IL1B in bile/acid-tolerant STRs and BAR-T cells. Etomoxir only inhibits PA-dependent increased expression in BAR-T. (b) IL8 expression is increased in a PA-dependent manner in BE cell lines and inhibited by etomoxir. (c) CPT1A is increased in response to PA stimulation in STR, CPA, and BAR-T cells. Etomoxir only reverses the increase in CPA cells. * p < 0.05, ** p < 0.01, *** p < 0.001, **** p < 0.0001, One-way ANOVA.
Figure 6
Figure 6
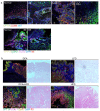
CPT1A upregulation correlates with an increase in COX2 and DCLK1 in human and mouse. (a) Human biospecimen from normal, Barrett’s (BE), esophageal adenocarcinoma (EAC) and gastric cardia were stained with antibody against CPT1A, COX2 and ki67. CPT1A and COX2 expression are increased in BE, EAC as is ki67. In biopsies capturing the junction of healthy squamous and BE, the increase in CPT1A and the stemness marker DCLK1 localize to the BE lesion, also identified with K8 using multiplex immunofluorescence staining. (b) ED-L2- IL1β mice were exposed to deoxycholate (DCA) in the drinking water, low fat diet (LFD) or high fat diet (HFD) alone and in combination with DCA. The combination treatment results in a high signal for the detection of CPT1A, DCLK1 and COX2 in K8-positive BE-like regions. Scale bar, 50 microns.

References

    1. El-Serag H.B., Hashmi A., Garcia J., Richardson P., Alsarraj A., Fitzgerald S., Vela M., Shaib Y., Abraham N.S., Velez M., et al. Visceral abdominal obesity measured by CT scan is associated with an increased risk of Barrett’s oesophagus: A case-control study. Gut. 2013;63:220–229. doi: 10.1136/gutjnl-2012-304189. - DOI - PMC - PubMed
    1. Hoyo C., Cook M.B., Kamangar F., Freedman N.D., Whiteman D., Bernstein L., Brown L.M., Risch H.A., Ye W., Sharp L., et al. Body mass index in relation to oesophageal and oesophagogastric junction adenocarcinomas: A pooled analysis from the International BEACON Consortium. Int. J. Epidemiol. 2012;41:1706–1718. doi: 10.1093/ije/dys176. - DOI - PMC - PubMed
    1. Malaty H.M., Fraley J.K., Abudayyeh S., Fairly K.W., Javed U.S., Aboul-Fotouh H., Mattek N., Gilger M.A. Obesity and gastroesophageal reflux disease and gastroesophageal reflux symptoms in children. Clin. Exp. Gastroenterol. 2009;2:31–36. doi: 10.2147/CEG.S4715. - DOI - PMC - PubMed
    1. Borodina G., Morozov S. Children with Gastroesophageal Reflux Disease Consume More Calories and Fat Compared to Controls of Same Weight and Age. J. Pediatr. Gastroenterol. Nutr. 2020;70:808–814. doi: 10.1097/MPG.0000000000002652. - DOI - PubMed
    1. Delshad S.D., Almario C.V., Chey W.D., Spiegel B.M. Prevalence of Gastroesophageal Reflux Disease and Proton Pump Inhibitor-Refractory Symptoms. Gastroenterology. 2020;158:1250–1261. doi: 10.1053/j.gastro.2019.12.014. - DOI - PMC - PubMed

Supplementary concepts