. 2022 Oct 4;23(19):11782.
doi: 10.3390/ijms231911782.

Cancer Three-Dimensional Spheroids Mimic In Vivo Tumor Features, Displaying "Inner" Extracellular Vesicles and Vasculogenic Mimicry

Affiliations

Cancer Three-Dimensional Spheroids Mimic In Vivo Tumor Features, Displaying "Inner" Extracellular Vesicles and Vasculogenic Mimicry

Ilaria Giusti et al. Int J Mol Sci. .

Abstract

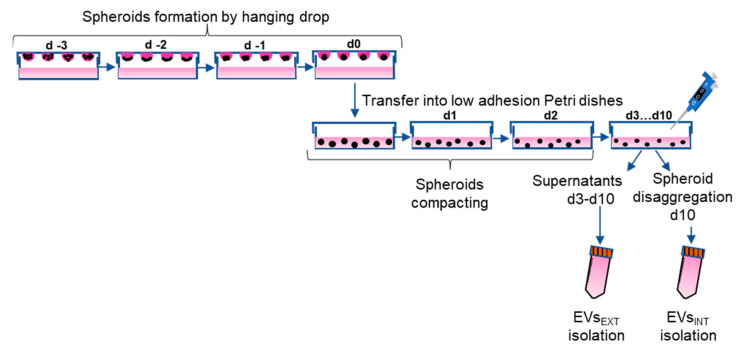
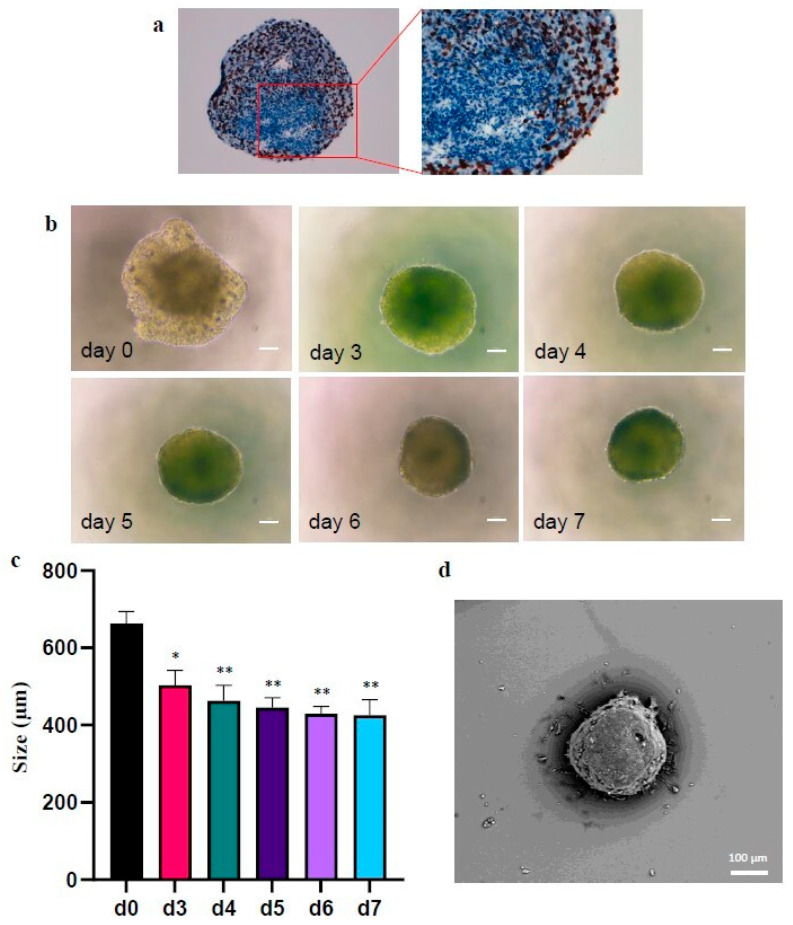
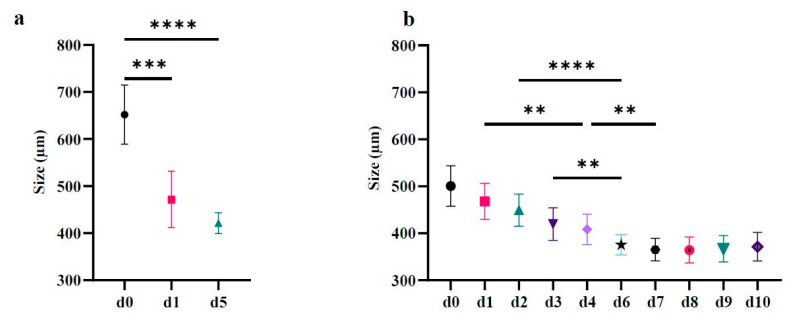
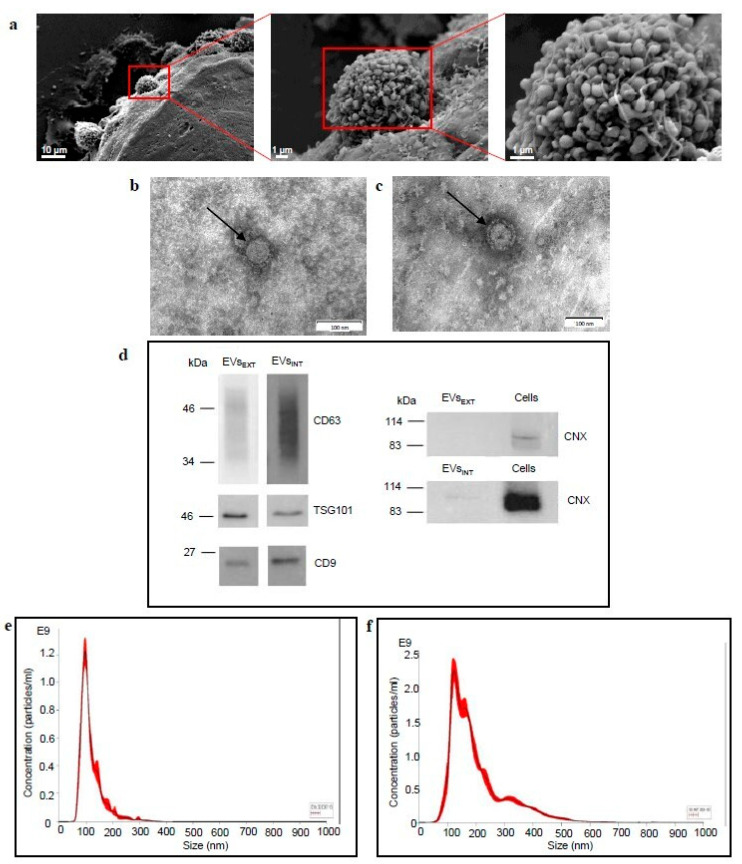
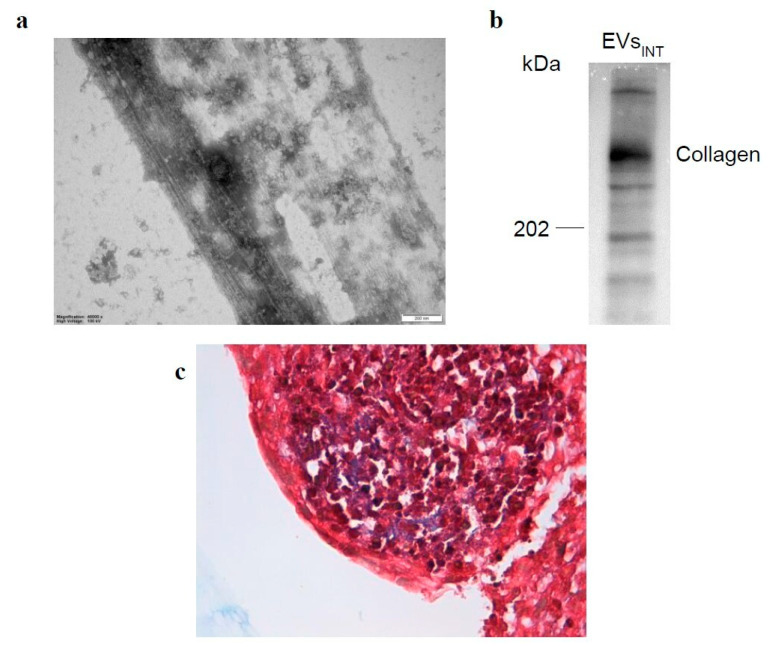
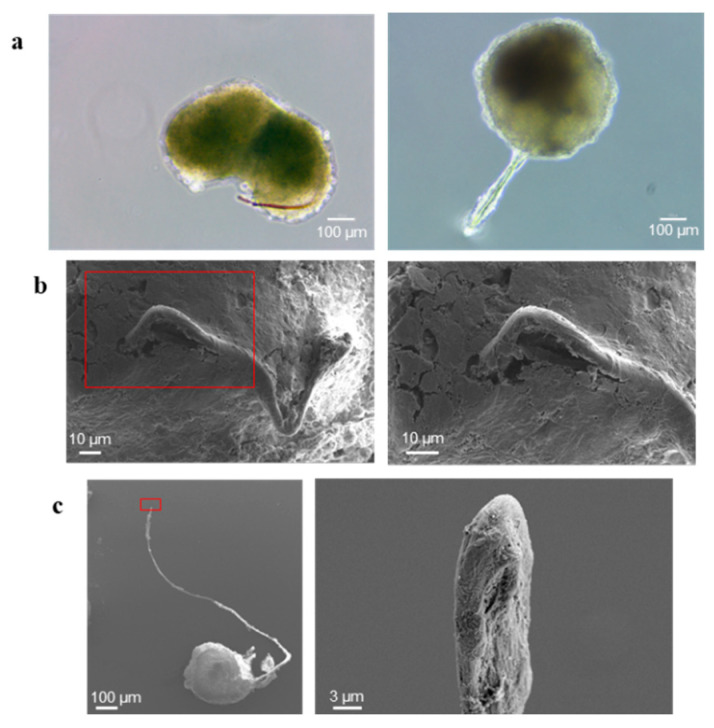
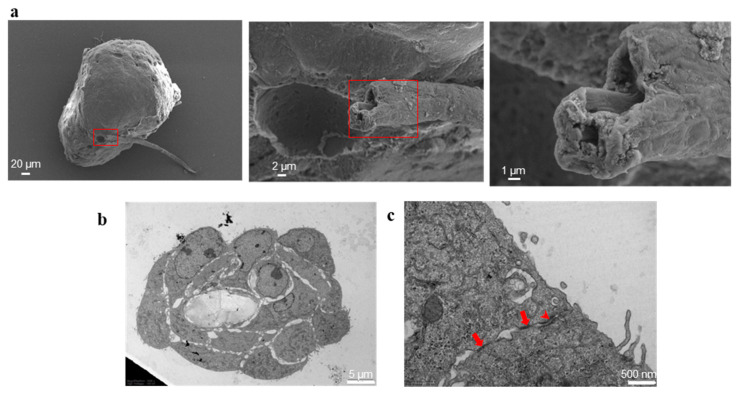
The role of extracellular vesicles (EVs) as mediators of cell-to-cell communication in cancer progression is widely recognized. In vitro studies are routinely performed on 2D culture models, but recent studies suggest that 3D cultures could represent a more valid model. Human ovarian cancer cells CABA I were cultured by the hanging drop method to form tumor spheroids, that were moved to low adhesion supports to observe their morphology by Scanning Electron Microscopy (SEM) and to isolate the EVs. EVs release was verified by SEM and their identity confirmed by morphology (Transmission Electron Microscopy, TEM), size distribution (Nanoparticles Tracking Analysis), and markers (CD63, CD9, TSG-101, Calnexin). CABA I form spheroids with a clinically relevant size, above 400 μm; they release EVs on their external surface and also trap "inner" EVs. They also produce vasculogenic mimicry-like tubules, that bulge from the spheroid and are composed of a hollow lumen delimited by tumor cells. CABA I can be grown as multicellular spheroids to easily isolate EVs. The presence of features typical of in vivo tumors (inner entrapped EVs and vasculogenic mimicry) suggests their use as faithful experimental models to screen therapeutic drugs targeting these pro-tumorigenic processes.

Keywords: extracellular vesicles; ovarian cancer; spheroids; vasculogenic mimicry.


Conflict of interest statement

The authors declare no conflict of interest.

Figures

Figure 1
Figure 1
Experimental scheme. Spheroids were formed by “hanging drop” from day −3 to day 0 (d −3–d0) then transferred into low adhesion Petri dishes on d0. Spheroids were left to compact for 72 h (d0–d3) and from d3 to d10 EVsEXT were collected. On d10, spheroids were disaggregated as described in Methods and EVsINT were isolated. “Day 0” was chosen to signify the day spheroids were moved from drop to Petri; from day zero (d0) the previous 3 days (as d −1, d −2, d −3) and the following 10 (d1–d10) were considered.
Figure 2
Figure 2
Morphology and size of a CABA I representative spheroid. (a) Ki67 staining of a representative spheroid (conventional immunohistochemical staining procedure). 20× magnification for the left image, 40× magnification for the right image; (b) Images of a representative CABA I spheroid at d0, d3–d7 from the transfer onto low attachment surface; the size bar is 100 µm. (c) Graph reporting the mean size (mean of two repeated measures of diameter) of the representative spheroid at days 0–7 (mean ± SD) (* p < 0.05; ** p < 0.01). (d) SEM image of a representative CABA I spheroid; the size bar is 100 µm.
Figure 3
Figure 3
Size trend over days of CABA I spheroids. (a) Mean ± SD of 14 spheroids observed on d0, d1 and d5. (b) Mean ± SD of 35 spheroids observed on d0-d10. Kruskal–Wallis test followed by Dunn’s post-hoc test (** p < 0.01; ***: p < 0.005; **** p < 0.001). In each graph, asterisks on horizontal bars represents the statistical significance between the two values selected. In b, all values, starting from d3 are statistically significant compared to d0 (**** p < 0.001; only d3 ** p < 0.01).
Figure 4
Figure 4
Spheroids release of EVsEXT and EVsINT. (a) SEM images, representative of several observations, showing EVs release from the spheroid surface. Each red rectangle encloses the microscope field shown, in higher magnification, on the image on the right. The lower magnification on the left shows the outer surface of spheroid; higher magnifications highlight the release of EVs from cell surface. Size bar is 10 µm in the image on the left, 1 µm on other images. (b) Ultrastructural TEM image of EVEXT; the size bar is 100 nm. (c) Ultrastructural TEM image of EVINT; the size bar is 100 nm. In b and c the arrows point to EVs. (d) Western blots of CD63, TSG101, CD9 and calnexin (CNX) on EVsEXT and EVsINT samples. For CNX, that must be negative in EVs, total cell proteins are showed as positive control. (e) Representative NTA profile of EVsEXT. (f) Representative NTA profile of EVsINT.
Figure 5
Figure 5
Collagen in EVsINT sample. (a) Ultrastructural TEM image of EVINT sample highlighting the presence of fibers; the size bar is 200 nm. (b) Western blotting of collagen in EVsINT sample. (c) Masson trichrome stain (conventional staining procedure) most likely showing, in blue/purple, the presence of connective tissue; image 60×.
Figure 6
Figure 6
Vasculogenic mimicry-like phenomenon. (a) Images of some representative spheroids containing tubules observed by optical microscopy; the size bar is 100 µm. (b,c) SEM images of representative spheroids presenting tubules: (b) shows the tubule exiting from the spheroid; (c) shows the tip of the tubule; each red rectangle encloses the microscope field shown, in higher magnification, on the image on the right, highlighting the cavity of the tubule. The size bar is 10 µm in (b), 100 and 3 µm in (c), in order from the left to the right image.
Figure 7
Figure 7
Lumen inside the vasculogenic mimicry-like tubules. (a): SEM images highlighting the tubule lumen; each red rectangle encloses the microscope field shown, in higher magnification, on the image on the right, highlighting the cavity of the tubule. The size bar is 20, 2 and 1 µm, in order from the left to the right image. (b): TEM image of a sagittal section of the tubule, highlighting the hollow lumen delimited by cells. The size bar is 5 µm. (c): representative TEM image showing the cellular junctions: the arrows point to tight junctions, the arrowhead points to desmosome. The size bar is 500 nm.

References

    1. Doyle L., Wang M. Overview of Extracellular Vesicles, Their Origin, Composition, Purpose, and Methods for Exosome Isolation and Analysis. Cells. 2019;8:727. doi: 10.3390/cells8070727. - DOI - PMC - PubMed
    1. Teng F., Fussenegger M. Shedding Light on Extracellular Vesicle Biogenesis and Bioengineering. Adv. Sci. 2021;8:2003505. doi: 10.1002/advs.202003505. - DOI - PMC - PubMed
    1. Weiss R., Gröger M., Rauscher S., Fendl B., Eichhorn T., Fischer M.B., Spittler A., Weber V. Differential Interaction of Platelet-Derived Extracellular Vesicles with Leukocyte Subsets in Human Whole Blood. Sci. Rep. 2018;8:6598. doi: 10.1038/s41598-018-25047-x. - DOI - PMC - PubMed
    1. Hovhannisyan L., Czechowska E., Gutowska-Owsiak D. The Role of Non-Immune Cell-Derived Extracellular Vesicles in Allergy. Front. Immunol. 2021;12:702381. doi: 10.3389/fimmu.2021.702381. - DOI - PMC - PubMed
    1. Robbins P.D., Morelli A.E. Regulation of Immune Responses by Extracellular Vesicles. Nat. Rev. Immunol. 2014;14:195–208. doi: 10.1038/nri3622. - DOI - PMC - PubMed