Meta-Analysis
. 2022 Oct 6;23(19):11873.
doi: 10.3390/ijms231911873.

Transcriptional and Epigenomic Markers of the Arterial-Venous and Micro/Macro-Vascular Endothelial Heterogeneity within the Umbilical-Placental Bed

Affiliations
Meta-Analysis

Transcriptional and Epigenomic Markers of the Arterial-Venous and Micro/Macro-Vascular Endothelial Heterogeneity within the Umbilical-Placental Bed

German A Arenas et al. Int J Mol Sci. .

Abstract

Umbilical and placental vessels and endothelial cells (EC) are common models to study placental function and vascular programming. Arterio-venous differences are present in the umbilical endothelium; however, the heterogeneity of small placental vessels and the expression of potential micro- vs. macro-vascular (MMV) markers are poorly described. Here, we performed a meta-analysis of transcriptomic and DNA methylation data from placental and umbilical EC. Expression and methylation profiles were compared using hierarchical clustering, dimensionality reduction (i.e., tSNE, MDS, and PHATE), and enrichment analysis to determine the occurrence of arterio-venous (AVH) and micro-macro heterogeneity (MMH). CpG sites correlated with gene expression of transcriptional markers of MMH and AVH were selected by Lasso regression and used for EC discrimination. General transcriptional profile resulted in clear segregation of EC by their specific origin. MM and AVH grouping were also observed when microvascular markers were applied. Altogether, this meta-analysis provides cogent evidence regarding the transcriptional and epigenomic profiles that differentiate among EC, proposing novel markers to define phenotypes based on MM levels.

Keywords: endothelial; epigenetics; phenotypic heterogeneity; placenta; umbilical.


Conflict of interest statement

The authors declare that the research was conducted in the absence of any commercial or financial relationships that could be construed as a potential conflict of interest.

Figures

Figure 1
Figure 1
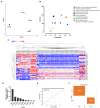
Transcriptional profiling, grouping, and proximity of umbilical and placental endothelial cells. (A) Hierarchical analysis of 17,280 transcripts commonly expressed in endothelial cells of the umbilical-placental bed. MDS (B), t-SNE (C), and PHATE (D) plots showing dissimilarities, similarities, and relative proximity among HUAEC (red dots), HUVEC (blue dots), PLAEC (light red dots), and PLVEC (light blue dots).
Figure 2
Figure 2
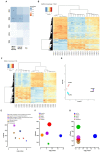
Transcriptional profile of macro and microvascular endothelial cells. (A) PCA analysis of samples distinguishing the groups by the organ of origin (color) and level (shape, circle, or square) and specifying the number of macro- (n = 9) and microvascular samples (n = 23) with the respective filter criteria and pie chart with upregulated (4.45%) and downregulated (9.78%) genes between samples. (B) Graph bar showing the contribution of cell type and vascular level origin (i.e. large or small vessels) to transcriptional variation (C) Volcano plot showing 1295 downregulated genes (green points) and 2847 upregulated genes (red points) comparing small vs large vessels with respective fold changes (D) Level hierarchical clustering between macrovascular (green) and microvascular (yellow) samples. (E) Venn diagram showing the overlap between downregulated (left) and upregulated (right) genes between chorionic and microvascular samples. (F) Hierarchical analysis of top 50 DEGs between macro-and micro-vascular endothelial cells. (G) PHATE plot depicts proximity between macro- and micro-vascular samples considering top 50 DEGs. (H) Bubble plot shows the enriched BP and pathways for differentially expressed genes between micro and macrovascular placental endothelial cells. Bubble size is representative of the number of genes regulated for the given term.
Figure 3
Figure 3
Transcriptional markers of arterial-venous identity for umbilical and placental vessels. (A) The PHATE plot shows the proximity between endothelial cells samples considering arterial-venous markers. (B) Bubble plots show the enriched BP and pathways for differentially expressed genes between arterial and venous endothelial cells. Bubble size represents the number of genes regulated for each term. (C) Hierarchical clustering of arterial-venous DEGs in umbilical and placental endothelial cells. (D) Lasso regression analysis addressed 9 genes highly correlated with arterio-venous nature dichotomy. (E) Logistic regression and (F) confusion matrix plot validates the high discriminating ability for 9 DEGs.
Figure 4
Figure 4
DNA methylation profile of micro- and macro-vascular endothelial cells. (A) PCA analysis for the first five principal components for micro- and macro-vascular, arterio-venous, and sex-differentiated samples. (B) Heatmap for DMPs and DMRs (C) in each sample. (D) PHATE proximity plot to each sample: HPAEC (red dots), HUVEC (blue dots), PLAEC (light red dots), and PLVEC (light blue dots). (E) Epigenomic-specific functional enrichment analysis bubble plots depict the enriched pathways and transcriptions factor generated by ENCODE (F) and TRANSFAC and JASPAR databases (G). Bubble size represents the number of genes regulated for each term. In A, * p < 0.05, ** p < 0.01 p-values for correlation between principal components and sample traits.
Figure 5
Figure 5
DNA methylation profile of arterial and venous endothelial cells. (A) Heatmap for DMPs and DMRs (B) in each sample. (C) Epigenomic-specific functional enrichment analysis bubble plots depict the enriched pathways and transcriptions factor generated by ENCODE (D) and TRANSFAC and JASPAR databases (E).
Figure 6
Figure 6
Validation of DEG/DMC for arterial-venous and umbilical/placental identity. (A) Schematic proportional representation of probes laying micro- and macro-vascular genes. Proportions are represented by no correlated and no DMP genes (black dots), no correlated but DMP genes (gray dots), correlated but no DMP genes (red dots), and correlated and DMP genes (red dots). (B) Graph bars show six probes ID with high predictive power differentiating microvascular endothelial cells tested by Lasso regression analysis and validated by logistic regression (C). (D) Schematic proportional representation of probes laying arterio-venous genes. Proportions are represented by no correlated and no DMP genes (black dots), no correlated but DMP genes (gray dots), correlated but no DMP genes (red dots), and correlated and DMP genes (red dots). (E) Graph bars show nine probes ID with high predictive power differentiating arterio-venous nature of endothelial cells tested by Lasso regression analysis and validated by logistic regression (F).

Similar articles

Cited by

References

    1. Krause B.J. Novel insights for the role of nitric oxide in placental vascular function during and beyond pregnancy. J. Cell. Physiol. 2021;236(12):7984–7999. doi: 10.1002/jcp.30470. - DOI - PubMed
    1. Casanello P., Schneider D., Herrera E.A., Uauy R., Krause B.J. Endothelial heterogeneity in the umbilico-placental unit: DNA methylation as an innuendo of epigenetic diversity. Front. Pharmacol. 2014;5:49. doi: 10.3389/fphar.2014.00049. - DOI - PMC - PubMed
    1. Aird W.C. Endothelial cell heterogeneity. Cold Spring Harb. Perspect. Med. 2012;2:a006429. doi: 10.1101/cshperspect.a006429. - DOI - PMC - PubMed
    1. Gale N.W., Baluk P., Pan L., Kwan M., Holash J., DeChiara T.M., McDonald D.M., Yancopoulos G.D. Ephrin-B2 selectively marks arterial vessels and neovascularization sites in the adult, with expression in both endothelial and smooth-muscle cells. Dev. Biol. 2001;230:151–160. doi: 10.1006/dbio.2000.0112. - DOI - PubMed
    1. Foo S.S., Turner C.J., Adams S., Compagni A., Aubyn D., Kogata N., Lindblom P., Shani M., Zicha D., Adams R.H. Ephrin-B2 controls cell motility and adhesion during blood-vessel-wall assembly. Cell. 2006;124:161–173. doi: 10.1016/j.cell.2005.10.034. - DOI - PubMed

Publication types