. 2022 Oct 6;23(19):11880.
doi: 10.3390/ijms231911880.

Data Integration-Possibilities of Molecular and Clinical Data Fusion on the Example of Thyroid Cancer Diagnostics

Affiliations

Data Integration-Possibilities of Molecular and Clinical Data Fusion on the Example of Thyroid Cancer Diagnostics

Alicja Płuciennik et al. Int J Mol Sci. .

Abstract

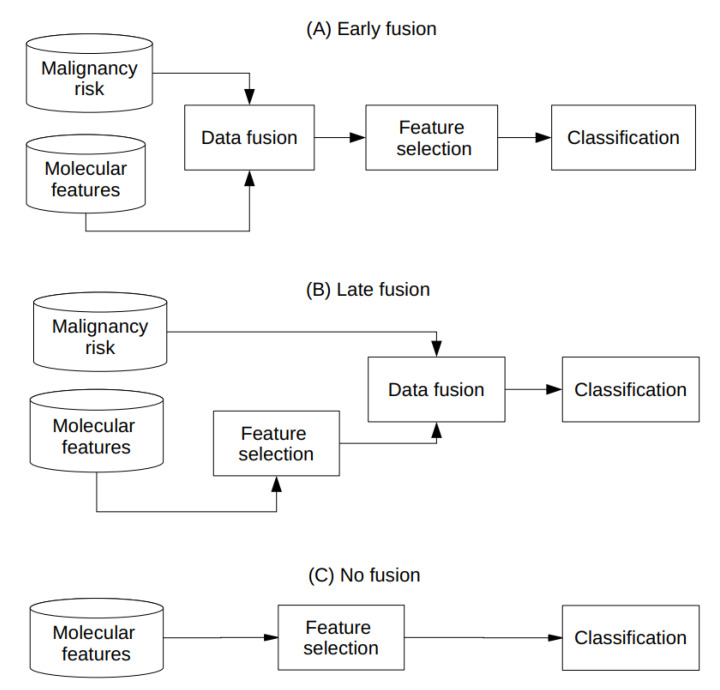
(1) Background: The data from independent gene expression sources may be integrated for the purpose of molecular diagnostics of cancer. So far, multiple approaches were described. Here, we investigated the impacts of different data fusion strategies on classification accuracy and feature selection stability, which allow the costs of diagnostic tests to be reduced. (2) Methods: We used molecular features (gene expression) combined with a feature extracted from the independent clinical data describing a patient's sample. We considered the dependencies between selected features in two data fusion strategies (early fusion and late fusion) compared to classification models based on molecular features only. We compared the best accuracy classification models in terms of the number of features, which is connected to the potential cost reduction of the diagnostic classifier. (3) Results: We show that for thyroid cancer, the extracted clinical feature is correlated with (but not redundant to) the molecular data. The usage of data fusion allows a model to be obtained with similar or even higher classification quality (with a statistically significant accuracy improvement, a p-value below 0.05) and with a reduction in molecular dimensionality of the feature space from 15 to 3-8 (depending on the feature selection method). (4) Conclusions: Both strategies give comparable quality results, but the early fusion method provides better feature selection stability.

Keywords: bioinformatics; biomarkers; cancer; classification; data fusion; data integration; thyroid cancer.


Conflict of interest statement

The authors declare no conflict of interest. The funders had no role in the design of the study; in the collection, analyses, or interpretation of data; in the writing of the manuscript, or in the decision to publish the results.

Figures

Figure 1
Figure 1
The estimated Bayesian network structure. The yellow node represents the outcome—the Malignancy_risk—the source of our new variable. The arrows represent strong connections between nodes; however, their meanings may be interpreted as: the Bethesda influence on risk; age should be considered as an indicator for an in-depth analysis toward thyroid cancer. Both nodes belong to the Markov-blanket of Malignancy_risk and should be included when performing inference on a given node.
Figure 2
Figure 2
Histograms of correlation coefficients within the analyzed sets of molecular features (gene expression) and molecular features and malignancy risks for given samples. Please note that the number of high correlation coefficients between malignancy risk and genomic features is similar in both datasets.
Figure 3
Figure 3
The histograms of mutual information between each pair of genomic features and between Malignancy_risk and genomic features.
Figure 4
Figure 4
Comparison of the different fusion strategy model accuracies with confidence intervals for the Microarray_163 feature set and Malignancy risk (Risk). Please note that for the ReliefF method, the data fusion strategies show similar accuracies.
Figure 5
Figure 5
Comparison of different fusion strategy model accuracies with 95% confidence intervals for the Microarray_40 feature set and Malignancy risk (risk). Please note that for the ReliefF feature selection, the method resulted in similar accuracies for models with 2–15 features. Moreover, this feature selection method resulted in a lower accuracy for the no fusion model than the Wilcoxon test method.
Figure 6
Figure 6
Comparison of the Kuncheva index for different data fusion strategies for Microarray 163 and Malignancy_risk features. Note the difference between the two feature selection methods for models with low feature numbers (nFeatures).
Figure 7
Figure 7
Comparison of the Kuncheva index for different data fusion strategies for Microarray 40 and Malignancy_risk features. Note the difference between the two feature selection methods for models with a low number of features (nFeatures). For the nFeatures close to the maximum number of features, the stability obtained the higher value and rose to its limit.
Figure 8
Figure 8
The difference between early fusion (A) and late fusion (B) with comparison to no fusion (C).

Similar articles

Cited by

References

    1. Shah P., Kendall F., Khozin S., Goosen R., Hu J., Laramie J., Ringel M., Schork N. Artificial Intelligence and Machine Learning in Clinical Development: A Translational Perspective. NPJ Digit. Med. 2019;2:100. doi: 10.1038/s41746-019-0148-3. - DOI - PMC - PubMed
    1. Leclercq M., Vittrant B., Martin-Magniette M.L., Scott Boyer M.P., Perin O., Bergeron A., Fradet Y., Droit A. Large-Scale Automatic Feature Selection for Biomarker Discovery in High-Dimensional OMICs Data. Front. Genet. 2019;10:452. doi: 10.3389/fgene.2019.00452. - DOI - PMC - PubMed
    1. Hira Z.M., Gillies D.F. A Review of Feature Selection and Feature Extraction Methods Applied on Microarray Data. [(accessed on 5 April 2020)]. Available online: https://www.hindawi.com/journals/abi/2015/198363/ - PMC - PubMed
    1. Li G.-Z., Bu H.-L., Yang M.Q., Zeng X.-Q., Yang J.Y. Selecting Subsets of Newly Extracted Features from PCA and PLS in Microarray Data Analysis. BMC Genom. 2008;9:S24. doi: 10.1186/1471-2164-9-S2-S24. - DOI - PMC - PubMed
    1. Wee L.J., Simarmata D., Kam Y.-W., Ng L.F., Tong J.C. SVM-Based Prediction of Linear B-Cell Epitopes Using Bayes Feature Extraction. BMC Genom. 2010;11:S21. doi: 10.1186/1471-2164-11-S4-S21. - DOI - PMC - PubMed