. 2022 Sep 22;11(19):5549.
doi: 10.3390/jcm11195549.

Molecular Features of SLC26A4 Common Variant p.L117F

Affiliations

Molecular Features of SLC26A4 Common Variant p.L117F

Arnoldas Matulevičius et al. J Clin Med. .

Abstract

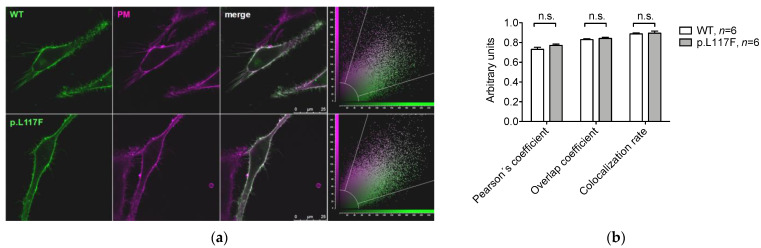
The SLC26A4 gene, which encodes the anion exchanger pendrin, is involved in determining syndromic (Pendred syndrome) and non-syndromic (DFNB4) autosomal recessive hearing loss. SLC26A4 c.349C>T, p.L117F is a relatively common allele in the Ashkenazi Jewish community, where its minor allele frequency is increased compared to other populations. Although segregation and allelic data support the pathogenicity of this variant, former functional tests showed characteristics that were indistinguishable from those of the wild-type protein. Here, we applied a triad of cell-based assays, i.e., measurement of the ion transport activity by a fluorometric method, determination of the subcellular localization by confocal microscopy, and assessment of protein expression levels, to conclusively assign or exclude the pathogenicity of SLC26A4 p.L117F. This protein variant showed a moderate, but significant, reduction in ion transport function, a partial retention in the endoplasmic reticulum, and a strong reduction in expression levels as a consequence of an accelerated degradation by the Ubiquitin Proteasome System, all supporting pathogenicity. The functional and molecular features of human pendrin p.L117F were recapitulated by the mouse ortholog, thus indicating that a mouse carrying this variant might represent a good model of Pendred syndrome/DFNB4.

Keywords: DFNB4; Pendred syndrome; SLC26A4; functional testing; hearing loss; pendrin.


Conflict of interest statement

The authors declare no conflict of interest. The funder had no role in the design of the study; in the collection, analyses, or interpretation of data; in the writing of the manuscript; or in the decision to publish the results.

Figures

Figure 1
Figure 1
Ion transport activity of human (a) and Mus musculus (b) wild-type pendrin and pendrin variant p.L117F. HEK 293 Phoenix cells were co-transfected with wild-type (WT) or p.L117F pendrin, and the iodide sensor enhanced yellow fluorescent protein (EYFP) H148Q;I152L or EYFP H148Q;I152L alone (empty vector) and bathed in chloride- or iodide-containing solutions. The arrow indicates the addition of the iodide-containing solution to the bath. Left panels show the average fluorescence intensity over time normalized for the average fluorescence intensity measured in the chloride-containing solution. Right panels represent the % decrease in fluorescence intensity determined over the experimental period (19 s). n = 60 measurements from 5 independent experiments. *** p < 0.0001, one-way ANOVA with Bonferroni’s multiple comparison post-test.
Figure 2
Figure 2
Transcript and protein levels of human wild type pendrin and pendrin variant p.L117F. (a) HEK 293 Phoenix or HeLa cells were left untransfected (native) or transfected with the same plasmid constructs used for the determination of protein levels, and the SLC26A4 transcript levels were quantified by qPCR. Human thyroid was tested in parallel as a reference. n refers to the number of biological replicates. (b) Representative images of fixed Hela cells transfected with wild type (WT) or p.L117F SLC26A4-EYFP (yellow) and counterstained with DAPI (cyan). The corresponding merge images are shown. Scale bar: 100 μm. (c) Pendrin protein expression levels expressed as fluorescence intensity (levels of gray) normalized for the cell density. n = 24 imaging fields from 4 independent subcultures. (d) Representative western blot on HEK 293 Phoenix cells transfected with wild type (WT) or p.L117F SLC26A4 or with an empty vector (mock). (e) Densitometry of n = 6 samples from 3 independent subcultures. n.s., not significant, ** p < 0.01, *** p < 0.0001, unpaired, two-tailed Student´s t test.
Figure 2
Figure 2
Transcript and protein levels of human wild type pendrin and pendrin variant p.L117F. (a) HEK 293 Phoenix or HeLa cells were left untransfected (native) or transfected with the same plasmid constructs used for the determination of protein levels, and the SLC26A4 transcript levels were quantified by qPCR. Human thyroid was tested in parallel as a reference. n refers to the number of biological replicates. (b) Representative images of fixed Hela cells transfected with wild type (WT) or p.L117F SLC26A4-EYFP (yellow) and counterstained with DAPI (cyan). The corresponding merge images are shown. Scale bar: 100 μm. (c) Pendrin protein expression levels expressed as fluorescence intensity (levels of gray) normalized for the cell density. n = 24 imaging fields from 4 independent subcultures. (d) Representative western blot on HEK 293 Phoenix cells transfected with wild type (WT) or p.L117F SLC26A4 or with an empty vector (mock). (e) Densitometry of n = 6 samples from 3 independent subcultures. n.s., not significant, ** p < 0.01, *** p < 0.0001, unpaired, two-tailed Student´s t test.
Figure 3
Figure 3
Colocalization of human wild-type pendrin and pendrin variant p.L117F with the plasma membrane. (a) Representative images of living Hela cells transfected with wild type (WT) or p.L117F SLC26A4-EYFP (green) and stained with the plasma membrane (PM) marker CellMaskTM Deep Red (magenta). The corresponding merge images and scatter plots are shown. Scale bar: 25 μm. (b) Average Pearson’s correlation coefficient, overlap coefficient, and colocalization rate. n refers to the number of cells from 3 independent subcultures. n.s., not significant, unpaired, two-tailed Student´s t test.
Figure 4
Figure 4
Colocalization of human wild-type pendrin and pendrin variant p.L117F with the endoplasmic reticulum. (a) Representative images of living Hela cells transfected with wild type (WT) or p.L117F SLC26A4-EYFP (green) and stained with the endoplasmic reticulum (ER) marker ER-TrackerTM Red (red). The corresponding merge images and scatter plots are shown. Scale bar: 25 μm. (b) Average Pearson´s correlation coefficient, overlap coefficient, and colocalization rate. n refers to the number of cells from 3 independent subcultures. * p < 0.05, ** p < 0.01, unpaired, two-tailed Student´s t test.
Figure 5
Figure 5
Expression and function of Mus musculus wild type pendrin and pendrin variant p.L117F in the presence of carfilzomib or its vehicle in HEK 293 Phoenix cells. (a) Cells were transfected with wild type (WT) or p.L117F SLC26A4-EYFP for 48 h and incubated with 1 μM carfilzomib or the vehicle (0.01% DMSO) for 16 h. Protein expression levels are expressed as fluorescence intensity (levels of gray) normalized for the cell density. n = 20 imaging fields from 4 independent subcultures. (b) Cells were co-transfected with wild type (WT) or p.L117F SLC26A4 and the iodide sensor enhanced yellow fluorescent protein (EYFP) H148Q;I152L or EYFP H148Q;I152L alone (empty vector) for 48 h and incubated with carfilzomib or the vehicle for 16 h. The % decrease in fluorescence intensity indicates an iodide influx from the bath solution towards the intracellular environment. n = 24 measurements from 4 independent experiments. * p < 0.05, ** p < 0.01, *** p < 0.001, one-way ANOVA with Bonferroni’s multiple comparison post-test.
Figure 6
Figure 6
Multiple sequence alignment of the SLC26A4 protein sequence with its orthologues (top) and human paralogues (bottom). Amino acid residues conserved in all proteins are shaded in gray. The putative position of the second transmembrane (TM 2) α-helix according to [45] is indicated above the sequence. The position of the amino acid Leu117 (L117) is also given. (a) H. sapiens (NP_000432.1), (b) P. Anubis (XP_021791848.1), (c) S. scrofa (XP_003357559.1), (d) C. familiaris (XP_022260905.1), (e) F. catus (XP_003982698.1), (f) M. musculus (NP_035997.1), (g) R. norvegicus (NP_062087.1), (h) X. laevis (AAI69726.1), (i) X. tropicalis (NP_001107135.1), (l) D. rerio (NP_001159387.1), SCL26A4 (NP_000432.1), SLC26A1 (NP_998778.1), SLC26A2 (NP_000103.2), SLC26A3 (NP_000102.1), SLC26A5 (NP_945350.1), SLC26A6 (NP_075062.2), SLC26A7 (NP_001269285.1), SLC26A8 (NP_001180405.1), SLC26A9 (NP_443166.1).

Similar articles

Cited by

References

    1. Everett L.A., Glaser B., Beck J.C., Idol J.R., Buchs A., Heyman M., Adawi F., Hazani E., Nassir E., Baxevanis A.D., et al. Pendred syndrome is caused by mutations in a putative sulphate transporter gene (PDS) Nat. Genet. 1997;17:411–422. doi: 10.1038/Ng1297-411. - DOI - PubMed
    1. Dossena S., Nofziger C., Tamma G., Bernardinelli E., Vanoni S., Nowak C., Grabmayer E., Kossler S., Stephan S., Patsch W., et al. Molecular and functional characterization of human pendrin and its allelic variants. Cell. Physiol. Biochem. 2011;28:451–466. doi: 10.1159/000335107. - DOI - PubMed
    1. Everett L.A., Morsli H., Wu D.K., Green E.D. Expression pattern of the mouse ortholog of the Pendred’s syndrome gene (Pds) suggests a key role for pendrin in the inner ear. Proc. Natl. Acad. Sci. USA. 1999;96:9727–9732. doi: 10.1073/pnas.96.17.9727. - DOI - PMC - PubMed
    1. Royaux I.E., Wall S.M., Karniski L.P., Everett L.A., Suzuki K., Knepper M.A., Green E.D. Pendrin, encoded by the Pendred syndrome gene, resides in the apical region of renal intercalated cells and mediates bicarbonate secretion. Proc. Natl. Acad. Sci. USA. 2001;98:4221–4226. doi: 10.1073/pnas.071516798. - DOI - PMC - PubMed
    1. Kim H.M., Wangemann P. Epithelial cell stretching and luminal acidification lead to a retarded development of stria vascularis and deafness in mice lacking pendrin. PLoS ONE. 2011;6:e17949. - PMC - PubMed

LinkOut - more resources