. 2022 Sep 21;15(19):6563.
doi: 10.3390/ma15196563.

Upconversion Emission Studies in Er3+/Yb3+ Doped/Co-Doped NaGdF4 Phosphor Particles for Intense Cathodoluminescence and Wide Temperature-Sensing Applications

Affiliations

Upconversion Emission Studies in Er3+/Yb3+ Doped/Co-Doped NaGdF4 Phosphor Particles for Intense Cathodoluminescence and Wide Temperature-Sensing Applications

Abhishek Kumar et al. Materials (Basel). .

Abstract

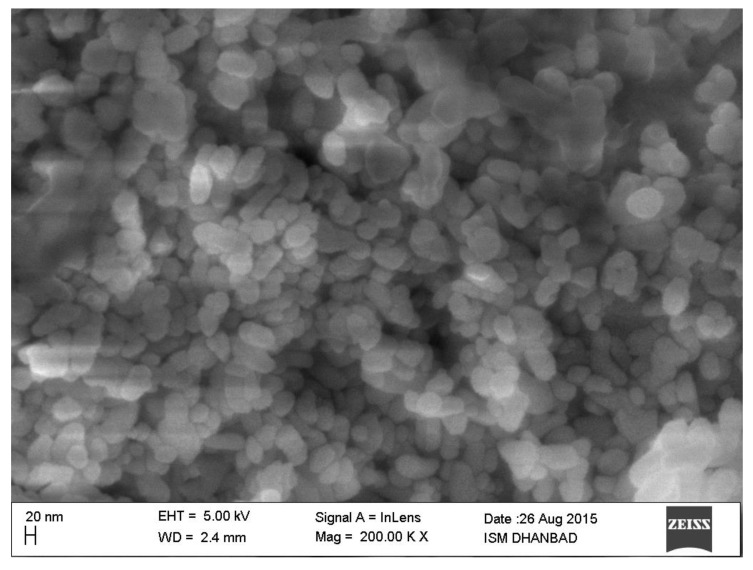
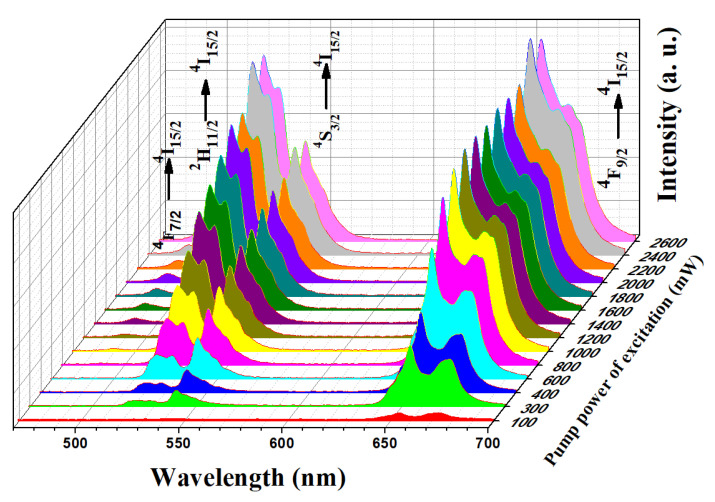
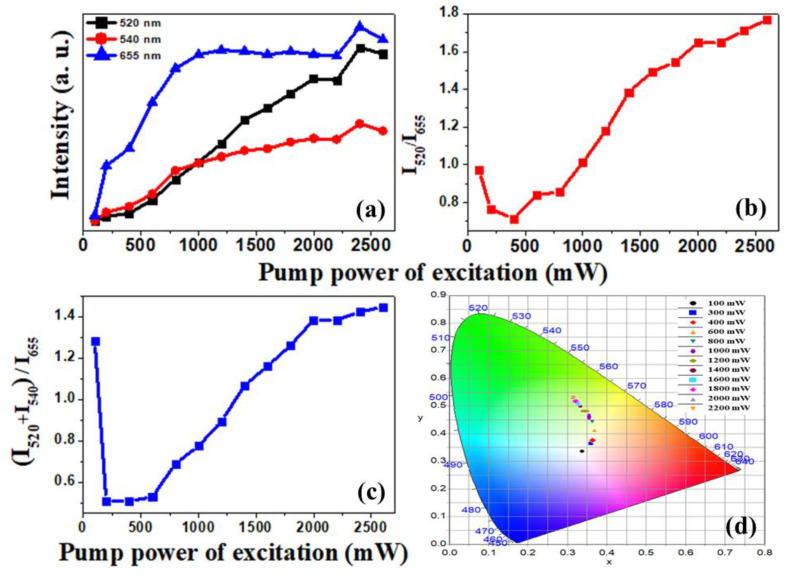
Er3+/Yb3+ doped/co-doped NaGdF4 upconversion phosphor nanoparticles were synthesized via the thermal decomposition route of synthesis. The α-phase crystal structure and nanostructure of these particles were confirmed using XRD and FE-SEM analysis. In the power-dependent upconversion analysis, different emission bands at 520 nm, 540 nm, and 655 nm were obtained. The sample was also examined for cathodoluminescence (CL) analysis at different filament currents of an electron beam. Through CL analysis, different emission bands of 526 nm, 550 nm, 664 nm, and 848 nm were obtained. The suitability of the present sample for temperature-sensing applications at a wide range of temperatures, from room temperature to 1173 K, was successfully demonstrated.

Keywords: NaGdF4:Er3+/Yb3+; cathodoluminescence; luminescence; temperature sensor; upconversion.


Conflict of interest statement

The authors declare no conflict of interest.

Figures

Figure 1
Figure 1
The XRD analysis of NaGdF4: Er3+/Yb3+ phosphor particles for α-phase formation.
Figure 2
Figure 2
The field emission scanning electron microscopy (FE-SEM) image of NaGdF4: Er3+/Yb3+ phosphor particles.
Figure 3
Figure 3
Power-dependent upconversion emission spectra analysis of NaGdF4: Er3+/Yb3+ at room temperature excited by a 980 nm diode laser source in the range of 100–2200 mW pump power of excitation.
Figure 4
Figure 4
(a) A comparison of the variation of upconversion luminescence intensity with the pump power (from 100 mW to 2600 mW) at different emission bands of 520 nm, 540 nm, and 655 nm. (b) The ratio of intensities of the thermally coupled levels at 520 nm and 540 nm corresponds to each excitation power. (c) The variation of the ratio of total green to red intensities corresponds to the pump power of excitations. (d) CIE (International Commission on Illumination chromaticity diagram) color coordinates (x, y) representation on CIE color diagram of samples with different excitation powers.
Figure 5
Figure 5
Filament current-dependent cathodoluminescence emission spectra variation of NaGdF4: Er3+/Yb3+ upconversion phosphor particles.
Figure 6
Figure 6
(a) Photograph of the sample prepared with NaGdF4: Er3+/Yb3+ upconversion phosphor particles for cathodoluminescence under the illumination of white light. (bj) Photomicrograph in transmitted light at different filament currents of canal rays from 0.10 mA to 0.70 mA and the respective CL images.
Figure 7
Figure 7
Energy level pathways for upconversion emissions bands of Yb3+ (sensitizer) and Er3+ (activator) with possible excitation for NaGdF4: Er3+/Yb3+ upconversion phosphor particles. Along the side, we explain the CL emissions due to the excitation of canal rays.
Figure 8
Figure 8
Temperature sensing behavior of NaGdF4: Er3+/Yb3+ upconversion phosphor particles sampled at low power excitation of 500 mW. (a) Samples surrounding temperature-dependent upconversion emission intensity variations at different selected temperatures; (b) ln (FIR) with the function of inverse temperature; (c) variation of absolute sensor sensitivity with temperature; (d) variation of relative sensor sensitivity with temperature.

References

    1. Liu J.N., Bu W.B., Shi J.L. Silica Coated Upconversion Nanoparticles: A Versatile Platform for the Development of Efficient Theranostics. Acc. Chem. Res. 2015;48:1797–1805. doi: 10.1021/acs.accounts.5b00078. - DOI - PubMed
    1. Kumar A., Couto M.H.M., Tiwari S.P., Kumar K., Esteves da Silva J.C.G. Effect of pH of precursor on up/downconversion and cathodoluminescence of Gd2O3:Ho3+/Yb3+ phosphor and magneto-optic studies. ChemistrySelect. 2018;3:10566–10573. doi: 10.1002/slct.201801556. - DOI
    1. Han Q., Jianxia W.G., Zhao Q.X., Zhang J., Wang Y., Dong S., Liu W., Hao A., Dong J. Enhanced luminescence of a new red phosphor Na13Sr2Ta2(PO4)9:Eu3+ by co-doping charge compensators Li+/Na+/K+ J. Lumin. 2019;212:227–232. doi: 10.1016/j.jlumin.2019.04.039. - DOI
    1. Gai S., Li C., Yang P., Lin J. Recent progress in rare earth micro/nanocrystals: Soft chemical synthesis, luminescent properties, and biomedical applications. Chem. Rev. 2013;114:2343–2389. doi: 10.1021/cr4001594. - DOI - PubMed
    1. Zhang N., Molokeev M.S., Liu Q., Xia Z. Pure red upconversion luminescence and optical thermometry of Er3+ doped sensitizer-rich SrYbInO4 phosphors. J. Mater. Chem. C. 2018;6:7361–7366. doi: 10.1039/C8TC02565G. - DOI

LinkOut - more resources