. 2022 Oct 1;27(19):6473.
doi: 10.3390/molecules27196473.

Biomimetic Targeted Theranostic Nanoparticles for Breast Cancer Treatment

Affiliations

Biomimetic Targeted Theranostic Nanoparticles for Breast Cancer Treatment

Suphalak Khamruang Marshall et al. Molecules. .

Abstract

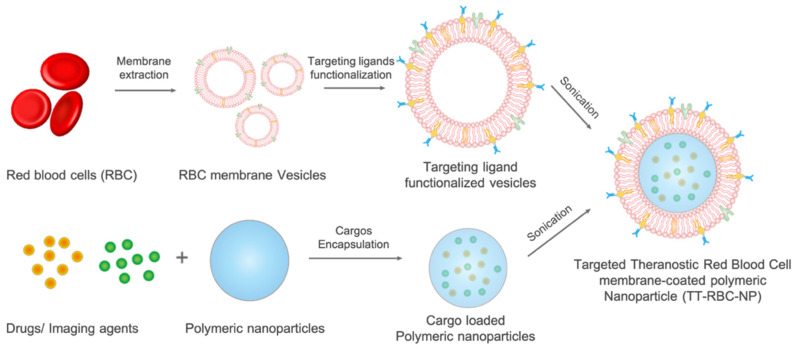
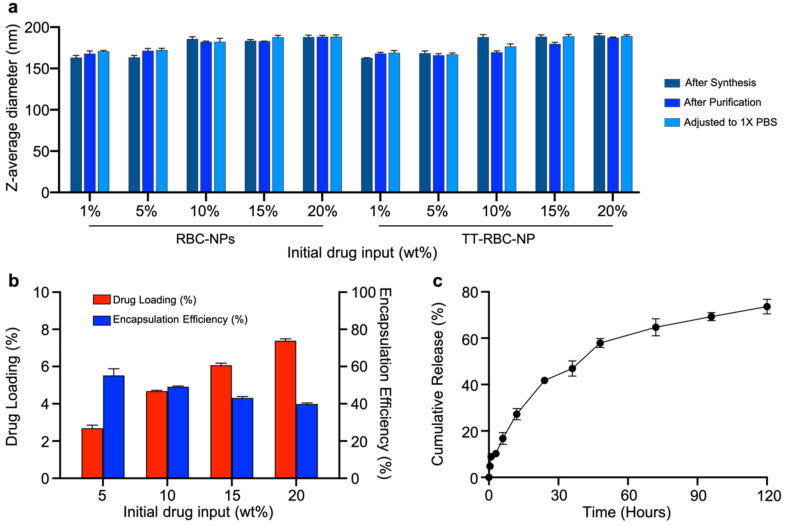
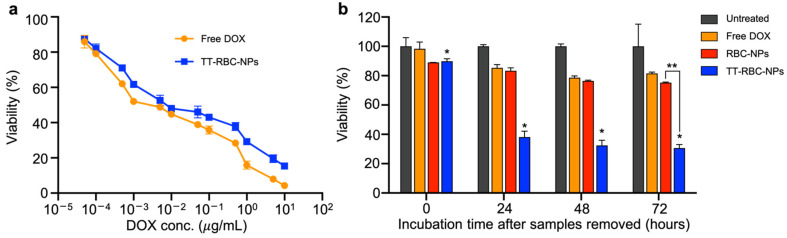
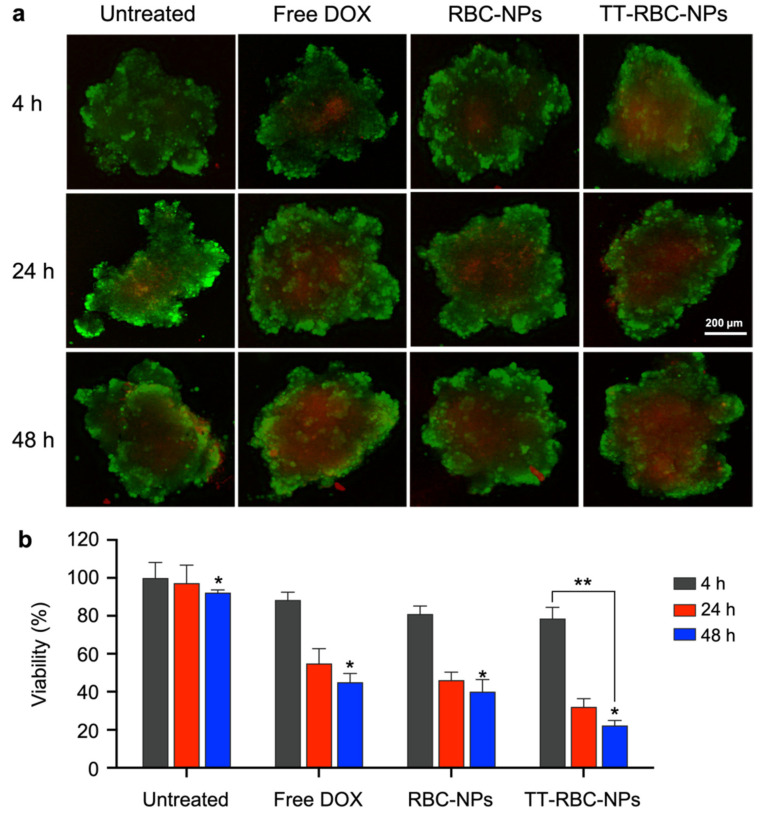
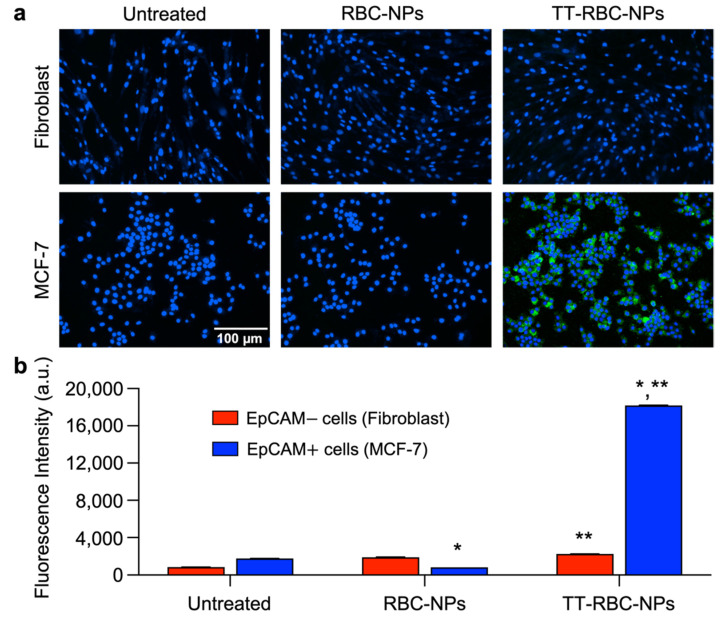
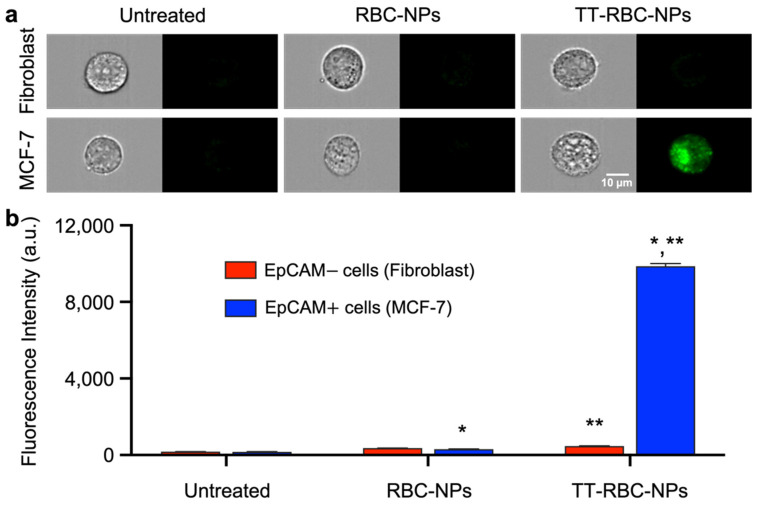
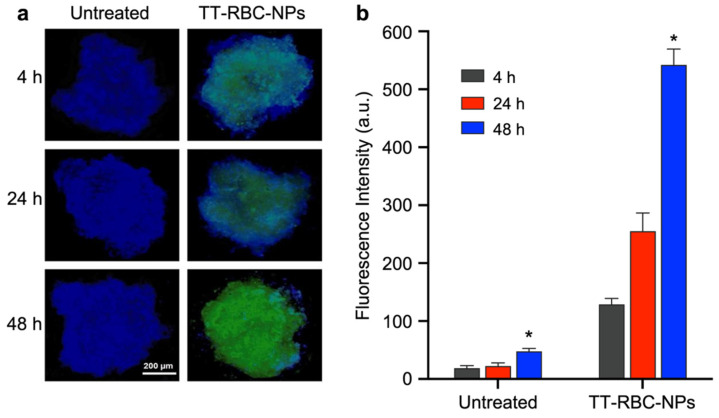
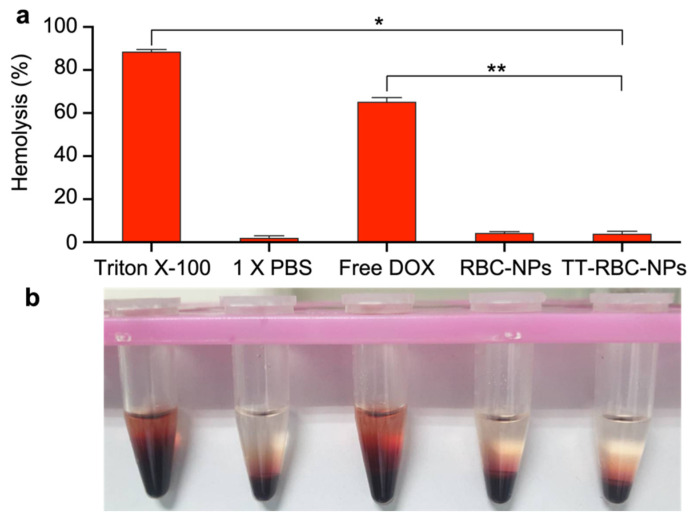
The development of biomimetic drug delivery systems for biomedical applications has attracted significant research attention. As the use of cell membrane as a surface coating has shown to be a promising platform for several disease treatments. Cell-membrane-coated nanoparticles exhibit enhanced immunocompatibility and prolonged circulation time. Herein, human red blood cell (RBC) membrane-cloaked nanoparticles with enhanced targeting functionality were designed as a targeted nanotheranostic against cancer. Naturally, derived human RBC membrane modified with targeting ligands coated onto polymeric nanoparticle cores containing both chemotherapy and imaging agent. Using epithelial cell adhesion molecule (EpCAM)-positive MCF-7 breast cancer cells as a disease model, the nature-inspired targeted theranostic human red blood cell membrane-coated polymeric nanoparticles (TT-RBC-NPs) platform was capable of not only specifically binding to targeted cancer cells, effectively delivering doxorubicin (DOX), but also visualizing the targeted cancer cells. The TT-RBC-NPs achieved an extended-release profile, with the majority of the drug release occurring within 5 days. The TT-RBC-NPs enabled enhanced cytotoxic efficacy against EpCAM positive MCF-7 breast cancer over the non-targeted NPs. Additionally, fluorescence images of the targeted cancer cells incubated with the TT-RBC-NPs visually indicated the increased cellular uptake of TT-RBC-NPs inside the breast cancer cells. Taken together, this TT-RBC-NP platform sets the foundation for the next-generation stealth theranostic platforms for systemic cargo delivery for treatment and diagnostic of cancer.

Keywords: biomimetic; cancer; nanomedicine; nanoparticles; theranostics.


Conflict of interest statement

The authors declare no conflict of interest.

Figures

Figure 1
Figure 1
Schematic illustration of the targeted theranostic red blood cell membrane-coated nanoparticles (TT-RBC-NPs). Red blood cell membrane is extracted by hypotonic treatment, sonication, and extrusion. Targeting ligands are functionalized by lipid insertion into red blood cells membrane vesicles. The targeting ligand functionalized vesicles are coated on cargo-loaded polymeric cores to form TT-RBC-NPs.
Figure 2
Figure 2
Physicochemical characterization of TT-RBC-NPs. (a) Hydrodynamic size and (b) zeta potential of non-coated doxorubicin-loaded nanoparticles (DOX NPs), RBC membrane vesicles, and TT-RBC NPs (mean ± SD, n = 3). (c) Transmission electron micrographs of TT-RBC-NPs. Scale bar = 100 nm.
Figure 3
Figure 3
Optimization and stability of TT-RBC-NPs. (a) Z-average size and b) Polydispersity index (PDI) as measured by dynamic light scattering (DLS) at varying RBC membrane protein to PLGA weight ratios of doxorubicin-loaded NPs immediately after synthesis, after purification, after adjusting to 1× PBS, and after adjusting to 1× FBS. (c) Stability of TT-RBC NPs made at a membrane to core ratio of 0.5 mg protein per 1 mg PLGA versus DOX-NPs over time. Data given as mean ± SD (n = 3).
Figure 4
Figure 4
Drug loading and cumulative release of doxorubicin from TT-RBC-NPs: (a) Z-average size of RBC-NPs and TT-RBC-NPs right after synthesis, after purification, after adjusting to 1× PBS at various initial drug input. (b) Drug loading yield and encapsulation efficiency (%) of DOX in TT-RBC-NPs at varying initial drug inputs. (c) Cumulative release profile (%) of DOX from TT-RBC-NPs with 6 wt% of DOX loading yield over a period of 5 days. Results represent mean ± SD (n = 3).
Figure 5
Figure 5
In vitro therapeutic response of TT-RBC-NPs. (a) In vitro cytotoxicity of free DOX and TT-RBC-NPs against MCF-7 breast cancer cells after 72 h incubation. (b) In vitro efficacy of free DOX, RBC-NPs and TT-RBC-NP (equivalent of 1 µg/mL DOX) against MCF-7 cells. In this assay, samples were incubated for 2 h, and cells were subsequently washed and incubated in fresh medium for additional 0, 24, 48 and 72 h before quantifying toxicity. Data represents mean ± SD (n = 3). * the significance between TT-RBC-NPs at 0, 24, 48, and 72 h incubation (p < 0.05). ** the significance between RBC-NPs and TT-RBC-NPs at 72 h incubation (p < 0.05).
Figure 6
Figure 6
In vitro cellular toxicity of TT-RBC-NPs in three-dimensional (3D) spheroids. (a) In vitro live/dead cell imaging of tumor spheroid untreated, and treated with free DOX, RBC-NPs and TT-RBC-NPs (equivalent of 1 µg/mL DOX) for a period of 4, 24 and 48 h. Two-color fluorescence, live (green channel) and dead (red channel), enables evaluation of live and dead cells to determine cell viability. Scale bar = 200 µm. (b) In vitro cytotoxicity study using CellTiter-Glo® 3D cell assay of untreated, free DOX, RBC-NPs and TT-RBC-NPs against 3D MCF-7 spheroids. Results represent mean ± SD (n = 3). * the significance between Untreated, Free DOX, RBC-NPs, and TT-RBC-NPs at 48 h incubation (p < 0.05). ** the significance between 4 h and 48 h incubation of TT-RBC-NPs (p < 0.05).
Figure 7
Figure 7
Targeting ability study of TT-RBC-NPs by fluorescence microscopy. (a) Fluorescence microscopy images of MCF-7 (EpCAM+) and skin fibroblast (EpCAM–) treated with RBC-NPs (non-targeted NPs) and TT-RBC-NPs (targeted NPs). All samples were labeled with FITC (green channel). After 1 h incubation, cells were washed and incubated for another 1 h in fresh medium before imaging. The nucleus was stained with DAPI (blue channel). Scale bar = 100 µm. (b) Quantification of mean fluorescence intensities of RBC-NPs and TT-RBC-NPs on MCF-7 (EpCAM+) and skin fibroblast (EpCAM–) cells. Bars represent mean ± SD (n = 3). * the significance between RBC-NPs of EpCAM+ cells (MCF-7) and TT-RBC-NPs of EpCAM+ cells (MCF-7) (p < 0.05). ** the significance between TT-RBC-NPs of EpCAM– cells (fibroblast) and TT-RBC-NPs of EpCAM+ cells (MCF-7) (p < 0.05).
Figure 8
Figure 8
TT-RBC-NPs bind to MCF-7 (EpCAM+) cell. (a) Fluorescence images of MCF-7 (EpCAM+) and skin fibroblast (EpCAM–) cells treated with RBC-NPs (non-targeted NPs) and TT-RBC-NPs (targeted NPs). Images and fluorescent signals were measured by flow cytometer. The cancer cell morphology was imaged in bright field. All samples were labeled with FITC (green channel). Scale bar = 10 µm. (b) Quantification of mean fluorescence intensities of untreated, RBC-NPs and TT-RBC-NPs on skin fibroblast and MCF-7 cells. Bars represent mean ± SD (n = 3). * the significance between RBC-NPs of EpCAM+ cells (MCF-7) and TT-RBC-NPs of EpCAM+ cells (MCF-7) (p < 0.05). ** the significance between TT-RBC-NPs of EpCAM– cells (Fibroblast) and TT-RBC-NPs of EpCAM+ cells (MCF-7) (p < 0.05).
Figure 9
Figure 9
TT-RBC-NPs penetration in tumor spheroids. (a) Fluorescence images of MCF-7 (EpCAM+) spheroids with and without treated with TT-RBC-NPs (green channel). The nucleus was stained with DAPI (blue channel). Scale bar = 200 µm. (b) Quantification of mean fluorescence intensities of TT-RBC-NPs on MCF-7 spheroids with incubation times of 4, 24 and 48 h. Bars represent mean ± SD (n = 3). * the significance between Untreated and TT-RBC-NPs at 48 h incubation (p < 0.05).
Figure 10
Figure 10
Hemotoxicity of TT-RBC-NPs. (a) Hemolysis of Triton X-100, PBS, free DOX, RBC-NPs and TT-RBC-NP (equivalent of 1 µg/mL DOX). Data represents mean ± SD (n = 3). (b) Images of red blood cells treated with Triton X-100, PBS, free DOX, RBC-NPs and TT-RBC-NP (equivalent of 1 µg/mL DOX) for 48 h. * the significance between Triton X-100 and TT-RBC-NPs at 48 h incubation (p < 0.05). ** the significance between Free DOX and TT-RBC-NPs at 48 h incubation (p < 0.05).

References

    1. Matsumura Y., Hamaguchi T., Ura T., Muro K., Yamada Y., Shimada Y., Shirao K., Okusaka T., Ueno H., Ikeda M. Phase I clinical trial and pharmacokinetic evaluation of NK911, a micelle-encapsulated doxorubicin. Br. J. Cancer. 2004;91:1775–1781. doi: 10.1038/sj.bjc.6602204. - DOI - PMC - PubMed
    1. Xia C., Dong X., Li H., Cao M., Sun D., He S., Yang F., Yan X., Zhang S., Li N. Cancer statistics in China and United States, 2022: Profiles, trends, and determinants. Chin. Med. J. 2022;135:584–590. doi: 10.1097/CM9.0000000000002108. - DOI - PMC - PubMed
    1. Sung H., Ferlay J., Siegel R.L., Laversanne M., Soerjomataram I., Jemal A., Bray F. Global cancer statistics 2020: GLOBOCAN estimates of incidence and mortality worldwide for 36 cancers in 185 countries. CA Cancer J. Clin. 2021;71:209–249. doi: 10.3322/caac.21660. - DOI - PubMed
    1. Curigliano G., Cardinale D., Suter T., Plataniotis G., De Azambuja E., Sandri M.T., Criscitiello C., Goldhirsch A., Cipolla C., Roila F. Cardiovascular toxicity induced by chemotherapy, targeted agents and radiotherapy: ESMO Clinical Practice Guidelines. Ann. Oncol. 2012;23:vii155–vii166. doi: 10.1093/annonc/mds293. - DOI - PubMed
    1. Peer D., Karp J.M., Hong S., Farokhzad O.C., Margalit R., Langer R. Nanocarriers as an emerging platform for cancer therapy. Nat. Nanotechnol. 2007;2:751–760. doi: 10.1038/nnano.2007.387. - DOI - PubMed

Substances