. 2022 Oct 5;27(19):6591.
doi: 10.3390/molecules27196591.

Effects of Donepezil Treatment on Brain Metabolites, Gut Microbiota, and Gut Metabolites in an Amyloid Beta-Induced Cognitive Impairment Mouse Pilot Model

Affiliations

Effects of Donepezil Treatment on Brain Metabolites, Gut Microbiota, and Gut Metabolites in an Amyloid Beta-Induced Cognitive Impairment Mouse Pilot Model

Jae-Kwon Jo et al. Molecules. .

Abstract

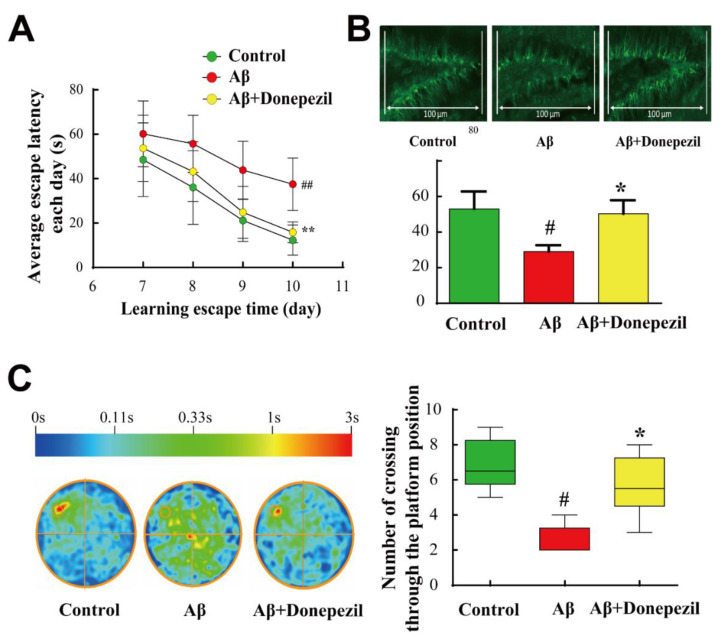
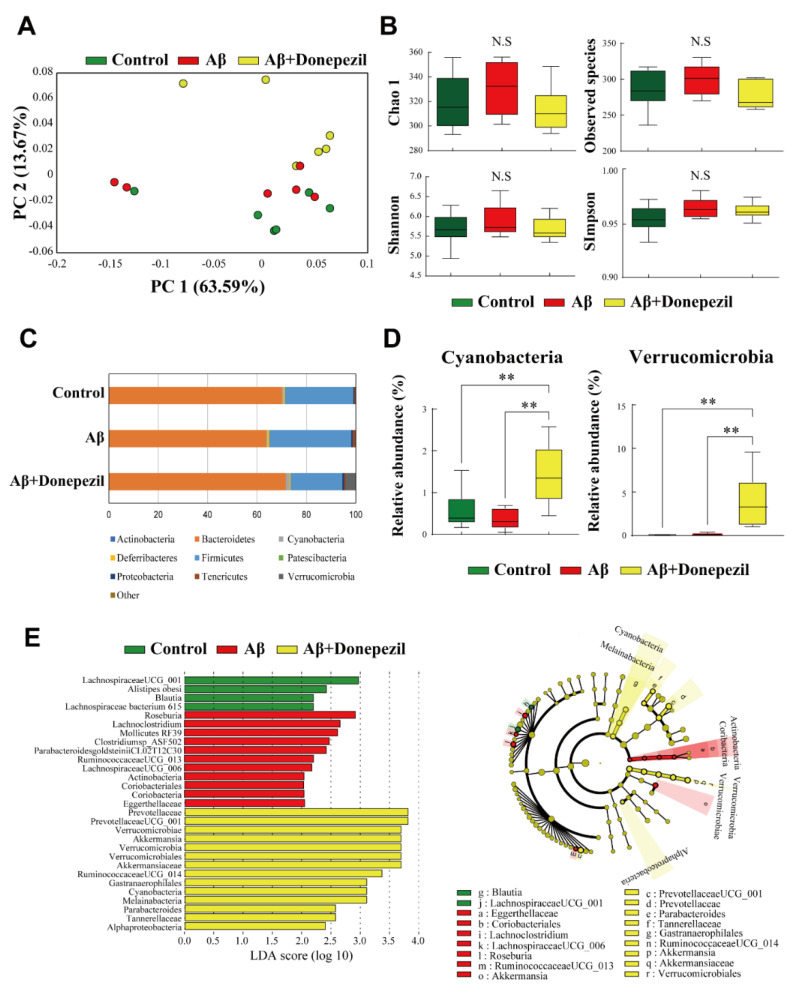
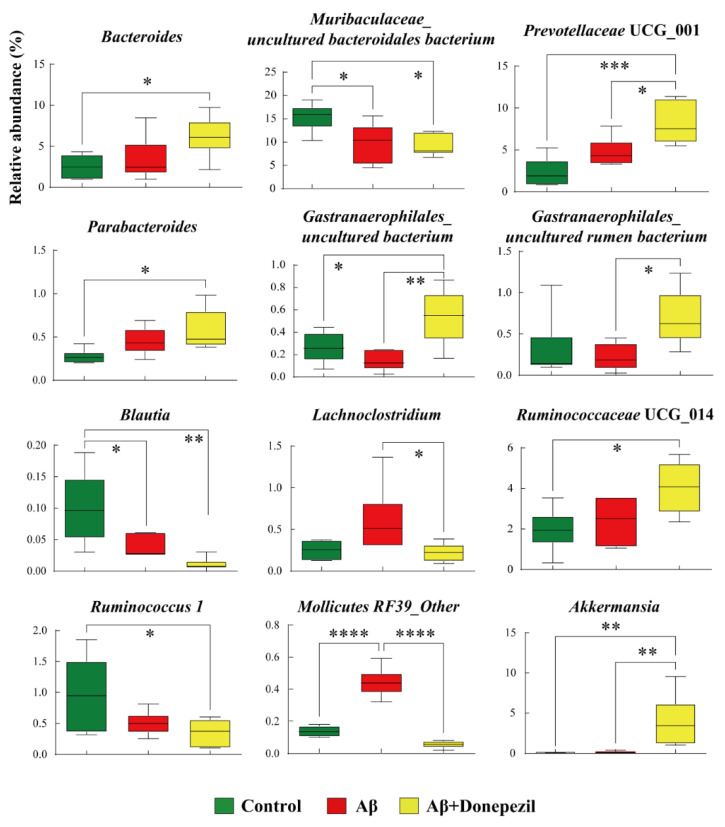
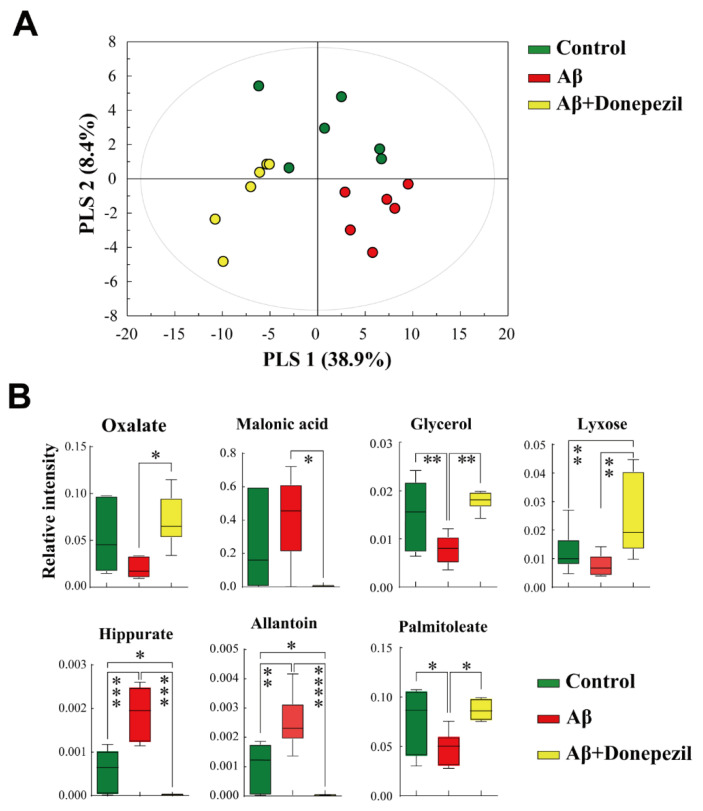
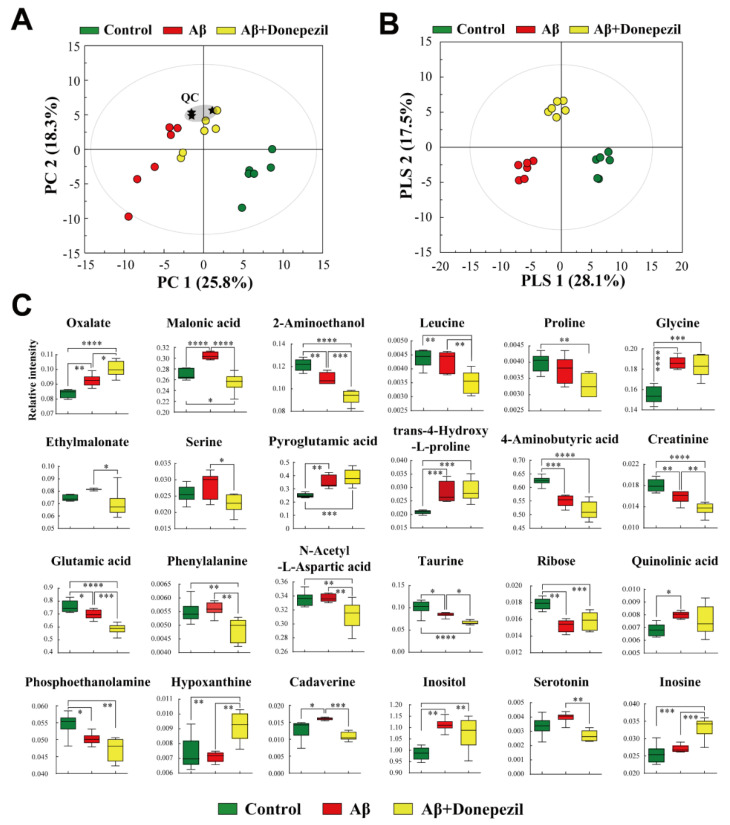
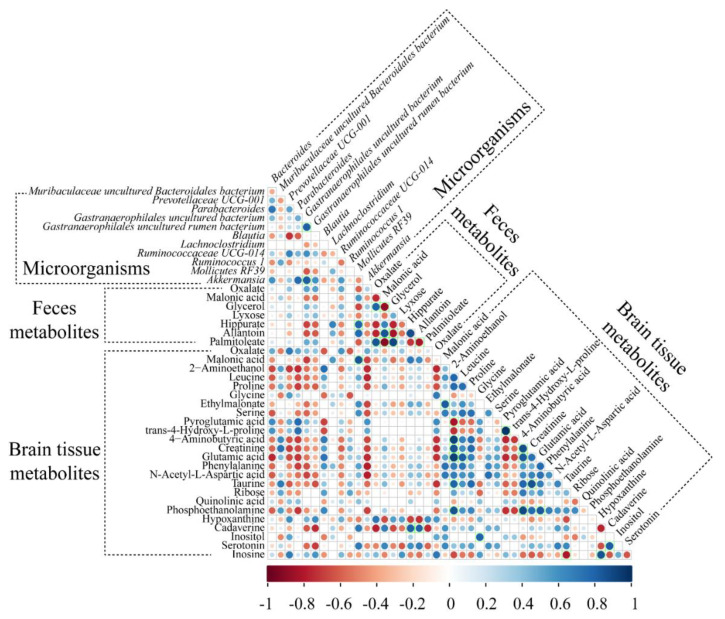
Accumulated clinical and biomedical evidence indicates that the gut microbiota and their metabolites affect brain function and behavior in various central nervous system disorders. This study was performed to investigate the changes in brain metabolites and composition of the fecal microbial community following injection of amyloid β (Aβ) and donepezil treatment of Aβ-injected mice using metataxonomics and metabolomics. Aβ treatment caused cognitive dysfunction, while donepezil resulted in the successful recovery of memory impairment. The Aβ + donepezil group showed a significantly higher relative abundance of Verrucomicrobia than the Aβ group. The relative abundance of 12 taxa, including Blautia and Akkermansia, differed significantly between the groups. The Aβ + donepezil group had higher levels of oxalate, glycerol, xylose, and palmitoleate in feces and oxalate, pyroglutamic acid, hypoxanthine, and inosine in brain tissues than the Aβ group. The levels of pyroglutamic acid, glutamic acid, and phenylalanine showed similar changes in vivo and in vitro using HT-22 cells. The major metabolic pathways in the brain tissues and gut microbiota affected by Aβ or donepezil treatment of Aβ-injected mice were related to amino acid pathways and sugar metabolism, respectively. These findings suggest that alterations in the gut microbiota might influence the induction and amelioration of Aβ-induced cognitive dysfunction via the gut-brain axis. This study could provide basic data on the effects of Aβ and donepezil on gut microbiota and metabolites in an Aβ-induced cognitive impairment mouse model.

Keywords: Alzheimer’s disease; amyloid beta; donepezil; gut microbiome; metabolite.


Conflict of interest statement

The authors declare that they have no known competing financial interests or personal relationships that could have influenced the work reported in this study.

Figures

Figure 1
Figure 1
(A) Morris water maze test. The escape latency of mice on days 7–10 was recorded. (B) Doublecortin-positive cells in the dentate gyrus region. (C) Number of platform area crossings was determined by conducting a probe test at the end of day 10. The color scale indicates the average position distribution time of animals within each group. Data are presented as the mean ± standard error of the mean values of sextuple determinations. #, p < 0.05; ##, p < 0.01 vs. control group; *, p < 0.05; **, p < 0.01 vs. amyloid β (Aβ) group.
Figure 2
Figure 2
(A) Beta diversity analysis of the control, Aβ, and Aβ + donepezil groups based on weighted UniFrac distance matrices. (B) Alpha diversity analysis of the control, Aβ, and Aβ + donepezil groups. (C) Comparison of microbiota composition at the phylum level. (D) Relative abundance of cyanobacteria and Verrucomicrobia. (E) Linear discriminant analysis (LDA) and the cladogram show the phylogenetic distribution of microbes that are associated with the control, Aβ, and Aβ + donepezil groups. Taxonomic levels of the phylum, class, and order are labeled, while family and genus are abbreviated. Plots are represented using LDA effect size (LEfSe). **, p < 0.01.
Figure 3
Figure 3
Box plots of significantly different microorganisms at the genus level in the feces of the control, Aβ, and Aβ + donepezil groups. The p values were obtained using one-way analysis of variance (ANOVA) with Tukey’s posthoc test for differences between groups; *, p < 0.05; **, p < 0.01; ***, p < 0.001; ****, p < 0.0001. A false discovery rate (FDR) of 5% was applied to all tests to correct for multiple testing.
Figure 4
Figure 4
(A) Supervised partial least squares discriminant analysis (PLS-DA) score plot derived from gas chromatography-mass spectrometry (GC-MS) data of feces. (B) Box plots of significantly different metabolites in feces. *, p < 0.05; **, p < 0.01; ***, p < 0.001; ****, p < 0.0001. A false discovery rate (FDR) of 5% was applied to all tests to correct for multiple testing.
Figure 5
Figure 5
(A) Principal component analysis (PCA) score plot based on GC-MS data sets from brain tissues. (B) Supervised PLS-DA score plot derived from the GC-MS data from brain tissues. (C) Box plots of significantly different metabolites in the brain tissues. *, p < 0.05; **, p < 0.01; ***, p < 0.001; ****, p < 0.0001. A false discovery rate (FDR) of 5% was applied to all tests to correct for multiple testing.
Figure 6
Figure 6
Heat map shows correlations (Spearman’s rank correlation, p < 0.05) among the identified brain tissue metabolites, feces metabolites, and feces microbiota. R-values of 0.8 or more are highlighted with green borders.

References

    1. Ausó E., Gómez-Vicente V., Esquiva G. Biomarkers for Alzheimer’s disease early diagnosis. J. Pers. Med. 2020;10:114. doi: 10.3390/jpm10030114. - DOI - PMC - PubMed
    1. Worley B., Powers R. Multivariate analysis in metabolomics. Curr. Metab. 2013;1:92–107. - PMC - PubMed
    1. Mahajan U.V., Varma V.R., Griswold M.E., Blackshear C.T., An Y., Oommen A.M., Varma S., Troncoso J.C., Pletnikova O., O’Brien R. Dysregulation of multiple metabolic networks related to brain transmethylation and polyamine pathways in Alzheimer disease: A targeted metabolomic and transcriptomic study. PLoS Med. 2020;17:e1003012. - PMC - PubMed
    1. Kim E., Jung Y.S., Kim H., Kim J.S., Park M., Jeong J., Lee S.K., Yoon H.G., Hwang G.S., Namkoong K. Metabolomic signatures in peripheral blood associated with Alzheimer’s disease amyloid-β-induced neuroinflammation. J. Alzheimers Dis. 2014;42:421–433. doi: 10.3233/JAD-132165. - DOI - PubMed
    1. Wang J., Gu B.J., Masters C.L., Wang Y.J. A systemic view of Alzheimer disease—Insights from amyloid-β metabolism beyond the brain. Nat. Rev. Neurol. 2017;13:612–623. doi: 10.1038/nrneurol.2017.111. - DOI - PubMed

MeSH terms